
Chapter 9
Starting and Scaling Agile Data Warehousing
What is the best way to start an agile warehousing team?
How should an organization scale up an agile DWBI program?
What core set of metrics should we use to track an agile warehousing team’s performance?
The preceding chapters provided a deep dive on several practices that agile warehousing teams find essential for business intelligence projects whenever they involve any significant degree of data integration work. Looking back on the depth and breadth of the material covered, the fully adapted agile warehousing method is clearly too much to drop on a new team all at once. The notions of user stories and time-boxed delivery alone may be all the novelty that developers from traditional projects will be able to manage during their first several agile iterations. Because the aspects of iterative and incremental delivery must be introduced over time, data warehousing/business intelligence (DWBI) departments planning to implement agile data warehousing will find it useful to formulate a multipart implementation plan. Many of the components of such a plan can be found in this final chapter.
These components start with a step-by-step path for introducing a new development team to agile data warehousing. It then presents some options for scaling up the method so that several teams can pursue a large endeavor in parallel. Scaling approaches will be followed by techniques that measure and compare the progress of different agile warehousing team so that program managers can coordinate multiple efforts through milestones and even balance work between their iterative teams. Finally, a presentation of a new approach to incremental project management—pull-based work flow systems—will be presented. Many agile practitioners consider pulled-based systems to be the next logical step beyond Scrum, and therefore a likely future for agile data warehousing.
Starting a scrum team
Whereas it would be truly wonderful to simply flip a switch and have all of a department’s warehouse project teams suddenly “go agile,” the savvy program organizer will search instead for a manageable series of transition steps for each group of engineers. He will not want to leave the evolution of each team completely to chance. Although the Scrum approach underlying the agile warehousing method invites teams to innovate the details of their iterative collaboration patterns, new teams often make some big mistakes when first crafting and tuning an iterative approach, especially when deadlines force them to evolve faster than they can experiment and learn. More often than not, they resort to many plan-driven techniques in their search for fast organizing concepts and fundamentally undermine the velocity that an agile approach offers.
Even Scrum’s core of self-organized teams and minimal to-be specifications alone can be an uncomfortably big leap for many traditional software engineers. Estimating in story points and switching to test-led development will be overwhelming. An agile program organizer can give his developers an overview of the entire agile data warehousing method so they understand their eventual destination, but then he will have to let them work on just a couple of notions at a time. Once developers get those ideas sorted out, they can then return to the agile data warehousing coach for a few more suggestions on how to streamline their process further. Table 9.1 lists a set of six major stages an agile promoter could use for introducing agile warehousing to a new team. The table also estimates how many sprints the developers will need to work through each stage. It then infers how much the calendar time this introduction process will require based on 2- and 3-week iterations.
Table 9.1 Introducing agile data warehousing to a new team
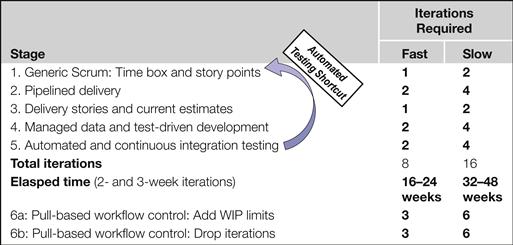
With even the first one or two of these suggested steps, teams usually demonstrate noticeably faster delivery speeds than the company experienced with traditional methods. However, as can be seen from the totals at the bottom of Table 9.1, achieving a team’s full potential in both velocity and quality will take a good part of a year to complete. Because the full transition requires several steps over many months, agile champions need to plan for regular assessments and increments of coaching to steadily guide their teams through this transition.
There is an important point implied by the step-by-step organization of Table 9.1: Because developers need significant time to master each stage, agile data warehousing programs clearly benefit by keeping each team of developers together for the duration of a project, even after their first project comes to an end. By casually disbanding and reformulating teams as if developers are plug-compatible components, a company can require its developers to reestablish the interpersonal arrangement and method customization already perfected in their previous groupings. True, teams need different skills sets as projects change, but with some thought, DWBI management can keep the shuffling of developers to a minimum, thereby letting teams build upon the velocity established on prior projects rather than forcing them to continually starting from scratch.
Stage 1: time box and story points
One of the easiest ways to get a new team of developers started with agile is to simply ask them to see how much shippable code they can demonstrate in 3 weeks. Of course, the agile promoter will have to invest a little up front for this approach to succeed. Working with functional managers so that the team members can focus predominantly on the agile project will do wonders to minimize the velocity lost to multitasking. Arranging for colocation will help tremendously as well. Scheduling a training day to cover the notion of user stories and the phases of Scrum as a suggested collaboration approach will enable the developers to achieve a higher velocity from the start.
In this initial step, the emphasis will be pushing generic user stories through time-boxed iterations with little structure beyond daily stand-ups and an end-of-cycle product demo. The scrum master’s primary objective for this stage is to combine the pressure of a short sprint with the convenience of working eye to eye to scrub away the slow work habits that the waterfall’s “big design up-front” approach entailed. The key insight one hopes the developers achieve during this stage is that though agile is simple, making it work is hard. Success will depend on their individual desires to deliver business-valued software quickly, plus their ability to work and learn as a team. The fact that programmers can succeed and even perform better with little more than index cards, cork boards, and whiteboards will take them a couple of iterations to accept.
The Scrum/XP community speaks of four generic phases in the development of new teams: forming, storming, norming, and performing. [Tuckman 1965] The first “generic Scrum” step suggested in this table of team maturation steps is the toughest because it involves both forming and storming. An ordinary team can reasonably require two or three iterations to work through this first increment. For some teams, just getting the daily stand-up meetings to 15 minutes or less will be a major victory. When developers start norming their particular work habits, significant leaps in performing will result and they will be ready for Stage 2.
Depending on the degree of storming, the scrum coach can introduce additional Scrum elements during this latter portion of this first stage, such as size-based estimation, a task board, burndown charts, a product board, and measures of team velocity. He can touch upon the quality of the estimates, but in this early stage, the objective should be just to quantify the programmers’ forecasting accuracy so that it can be improved later. Lofty goals such as 95% forecasting accuracy will have to wait for the introduction of developer stories during a later stage.
Stage 2: pipelined delivery
One purpose of Stage 1 is to let the team experiment with the dysfunctional Waterscrum or Scrummerfall mash-ups, as discussed in the prior chapter. Developers will need a chance to first appreciate how much faster a team can deliver through colocation and generalizing specialists. They will also soon observe first-hand how difficult it is to keep all members of the team productive for the entire sprint if they all try to work their specialty on a module during the same iteration. When the developers in each specialty become clearly vexed with how little time they get in one iteration to complete their work, the scrum master can safely introduce pipelining. Broach it any sooner and the developers may confuse the notion with strict work role assignments and a return to waterfall.
Unfortunately, it will take a couple of iterations just to fill the pipeline. Moving through this step takes longer if the team does not immediately hit upon the best way to define the work stations along the pipeline. One way to know if a team is ready for the next stage is to track the “net promoters’ scores,” described later, which will measure the quality of hand-offs between the specialties in the pipeline.
Stage 3: developer stories and current estimates
Once a team has their pipeline of generalizing specialists roles worked out, the next discernible impediment upon their velocity will be the stories they are working—the user stories will seem to be “too fat” for quick time-boxed delivery. Furthermore, the sponsors will be by this time undoubtedly demanding to know how long the team thinks the project will take. Both these needs can be addressed at once by transitioning the team from user stories down to the more granular notion of developer stories for their data integration work. As discussed in previous chapters, this transition aligns the work units flowing through the iterations with the natural components dictated by the application’s macro data architecture.
The product owner will need to make the mental transition to developer stories as well. So that the transition can be made as soon as the team is ready, scrum masters and project architects can work offline with the product owner, familiarizing him with just the basics of data warehousing ahead of time so that he is ready to work with developer stories when the time for this step comes.
Story points may need to be recalibrated for this next step, as developer stories are smaller and thus the team’s velocity measure will be redefined. As a result, this stage can be frustrating for stakeholders because the planning metrics will be in flux for an iteration or two. At the conclusion of this transition, however, the team should feel like their work units are well matched to the tight window formed by the sprint time box and that they have driven out much of the imprecision of their earlier estimates. With such confidence in place, it will be straightforward to take 1 day away from development and produce the team’s first current estimate for the benefit of its stakeholder community.
Stage 4: managed development data and test-driven development
Now that work is flowing into the team in bite-sized packets, the developers can turn their attention to perfecting their development process. They may have been following some form of test-driven development up until now, but typically it has been applied inconsistently and shallowly. They may be also losing considerable time to the scourge of data churn discussed in the previous chapter.
At this point it makes sense for the teammates to perform a deep think about the awkward volumes of development data they utilize and the limits upon testing it imposes. As discussed in the last chapter, deriving a subset of production data that support quick, representative loads will require analysis. It will also require some scripting to enable the team to occasionally refresh the development records in the test data repository. Such a managed development data set is a natural prerequisite to fast, test-driven development because it will enable the coders to “get intimate” with the native keys and attribute values within their data. Such familiarity allows them to check the output of unit and component tests rapidly by looking for the expected results on the records they have memorized.
Stage 5: automatic and continuous integration testing
The previous chapter recommended that agile warehousing teams subset production data to managed development data sets. With a collection of well-understood and controlled data sets in place, the team can continue driving for rock-solid, quality deliverables by automating the comparisons of actual to expected results. That automation can then be scheduled to run against a nightly build of their application. With automated and nightly integration testing established, the team will have a report each morning indicating whether any modules added during the previous day have failed to integrate properly. It will also be clear where yesterday’s changes have caused troubles for untouched modules that were working the day before. Typically this step will require implementing an automated test engine, and sometimes an automated build utility if that feature is not part of the extract, transform, and load (ETL) package the team uses. Given that tool implementation may be involved, project planners may need to anticipate this stage and have an automated testing package waiting for implementation.
For managers of data warehousing programs hoping for a fast conversion to agile, automated and continuous integration (ACIT) testing provides a shortcut across the maturity path outlined earlier. As shown in Table 9.1, the “Automated Testing Shortcut” occurs when the warehousing department implements an automated test engine before an individual agile warehousing team gets underway. This strategy represents test-led development at the whole project level, above the realm of unit and component development.
Of course, at the beginning of the project, the team cannot provide all of the test cases an application will eventually have to pass. But even at that early juncture, the product owner, project architect, data architect, and system analysts should be able to provide dozens of appropriate test cases, such as “targets should reconcile to source tables,” “all orders should have one and only one customer,” and “all type-two dimensions should have a current record for every natural key.”
By putting ACIT in place from the start, the leaders provide for the coders an instant visualization of the whole notion of iterative development. As shown in Figure 9.1, these leaders can set up a few major tests for each topic area of the project and each layer in the data architecture. The quality assurance engine will then run these tests each night, starting from the first day of the project. Getting the team into the mind-set required for fast incremental delivery then becomes as simple as asking the developers “which of these traffic lights on the QA board do you all want to turn green when we run this test suite on the morning of the next demo?” Such a question makes defining deliverables very tangible and strongly focuses the conversation of the next story conference.
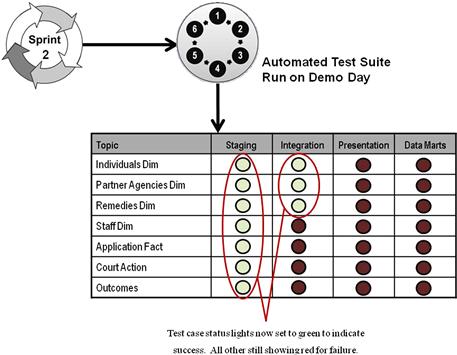
Figure 9.1 Automated testing gives team in an incremental point of view.
Installing automated testing from the start also puts an instant cap on sloppy coding and careless application design. If a programmer throws a module on the heap that undermines the function of the other modules already in the build, a light that used to turn green suddenly shows red the next morning, making it very easy for the team to figure out which developer probably caused the problem. Automated testing allows the developers to self-police, thus accelerating how quickly a new team will travel down the maturity path laid out earlier.
Stage 6: pull-based collaboration
The final step in maturing an agile warehousing team is to incorporate some or all of the techniques of a newer approach to managing work flow through the project. These techniques are based on “work-in-progress limits” placed on a task board that has been refined for the particular development process a team wants to utilize. With these modifications, work is pulled through the development cycle and time boxes become unnecessary. Because such an approach requires some additional process measurements besides story points and velocity, this discussion will have to wait until later in this chapter after discussing the metrics with which agile teams can quantify and communicate their results.
Scaling agile
Getting one agile team established and performing is only a first milestone for a full iterative warehousing program. More than likely, a company will have this first team try only a modest project, such as a data mart with one or two fact tables. Should this pilot project meet with success, the agile champions in the organization will soon face the challenge of scaling the agile warehousing method to address larger, more complex projects and even multiproject development efforts. To succeed, these planners will need to consider how to coordinate a half-dozen or more agile development teams working through tough requirements and complex corporate situations. Solving these challenges typically requires analyzing what makes growing a program difficult and the best practices for addressing each of those challenges.
Like many engineering disciplines, the software industry has labored for decades to identify scaling factors that might reveal how much one should multiply the cost and durations of known projects to create reasonable estimates for a new application that differs along some codified notion of project size. Some algorithmic cost estimation models from the prior century actually quantified these scaling factors into predictive formulas (see, for example, [Barry Boehm et al. 1995]). The agile community has not yet been so bold as to publish such scaling formulas, probably because most agile approaches are closer to adaptive collaboration frameworks than iron-clad methodologies. However, the community has done well at identifying what the most important scaling factors seem to be, as summarized in Table 9.2, which lists a recent IBM summary of agile scaling factors.
Table 9.2 Agile scaling factors
Application complexity. More complex and expansive problem domains require more time for exploration and experimentation, including prototyping, modeling, and simulation.
Geographical distribution. Effective collaboration becomes more challenging and disconnects are more likely to occur when team members work in different buildings, cities, or countries.
Team size. Mainstream agile processes work very well for smaller teams of 10 to 15 people, but paper-based, face-to-face strategies start to fall apart as the team size grows.
Compliance requirements. Regulatory issues and international quality standards may impose process standards upon teams that consume velocity and stifle process innovations.
Information technology governance. Formal IT process controls can sap a team velocity by imposing ceremonies and audits that run counter to agile notions such as self-organization, fail fast and fix quickly, and 80/20 specifications.
Organizational culture. A project team may include members from different divisions or even different companies, thereby increasing the risk to your project greatly.
Organizational complexity. An organization’s structure and culture may reflect traditional values, increasing the complexity of adopting and scaling modern agile strategies within your organization.
Organizational distribution. Teams can lose velocity when they must resolve conflicts between organization units over goals, definitions, access, and funding.
Adapted from [Ambler 2009].
Each scaling factor listed in Table 9.2 is a complex topic in of itself. Many may well deserve a book of their own. While there are no silver bullets that solve all of them quickly, a few strategies exist for each that agile project planners can investigate when challenges emerge in that arena as they grow their agile warehousing program.
Application complexity
For all the advances ETL tools have made since the early 2000s, they still leave data warehousing teams with a lot of hard thinking to do when it comes to data architecture and transformation rules for data integration. The primary means for mitigating this complexity was discussed in previous chapters. First, staff the team with project and data architects who spend Iterations −1 and 0 performing business and logical modeling so that they can inform the team where the complexity lies within the scope of the project. Second, staff the team with a systems analyst who can spend Iteration 0 profiling data and identifying the nature of the project’s most challenging data transformation requirements. Third, have teams organize these finding using “developer stories,” which are each specific to a layer of the warehouse macro data architecture, and thus reasonably sized for iterative development. Fourth, allow the team to conduct a spike (see Chapter 2) to complete some prototyping solutions around any deeply challenging developer stories. Finally, organize the team for a pipelined delivery approach, which will give the leadership subteam time to fill in the remaining gaps concerning data modeling and transformation rules for the developer stories that will be programmed during the next iteration.
Geographical distribution
Agile thrives on close collaboration. Spreading the team across the map requires careful planning and some good remote-presence communication products, as discussed in Chapter 3.
Team size
Because of the time spent planning and estimating during each iteration, generic Scrum teams hit peak effectiveness in the 6 to 10 developer range. Scaling past this point can be addressed by splitting the program into multiple coordinated teams or modifying the collaboration model, both of which are discussed later in this chapter.
Compliance requirements
Many large organizations adopt compliance goals that all information technology (IT) development efforts within the company, including the agile warehousing projects, are expected to uphold. The impetus for adopting these demanding compliance goals may originate with externally imposed regulatory agencies or with voluntary notions to meet international quality standards. The maturity models that companies adopt frequently for their compliance efforts largely predate agile methods. Therefore, many compliance planners have trouble understanding how their models can accommodate iterative development efforts. Such compliance schemes often involve software development process audits, such as those based on SEI’s Capabilities Maturity Model (CMM). [SEI 2006] Although large organizations typically interpret these maturity models as if they only supported plan-driven, “command and control” styles of project management, careful reading of their guidance reveals that they have no inherent conflict with iterative methods. [Glazer 2008] Melding the two worlds takes some careful definitional thinking to align the concepts and practices. [See Hughes 2008, Chapter 7] Once management can articulate a combined approach, it then takes a considerable investment to document the new “bilingual” standards to the point where both waterfall and iterative development teams can understand how to work within the process defined. True to the agile manifesto, the iterative teams will want to emphasize whole team solutions over following a formal process. So that they can thrive within an audited environment, it helps for management to emphasize not the audits, but instead the coaching on the adapted method so that the agile teams receive fast and consistent resolutions each time; delivering quickly seems to conflict with the documented process.
Perhaps a more attractive alternative for organizations will be to avoid trying to “agilize” maturity models such as CMM that originated during the waterfall era and employ instead those arising from the agile world itself. These efforts are in their infancy, which is advantageous because young maturity models are less detailed, so they can be read and adapted with relatively little effort. [See, for example, Petit 2006] The disadvantage of new and unelaborated models is that corporate compliance planners who do not trust self-organization to innovate process challenges will view them as incomplete and doubt their potential compared to their waterfall counterparts.
Information technology governance
Information technology governance is a broad set of practices for reliably aligning IT services with the needs of the enterprise. The topics of concern within IT governance can be as broad as the proper definition and approval of projects, as well as their assembly into funded programs and managed portfolios. Governance topics can also be as detailed as the best change control process to follow when stakeholders request new features for an application already under development.
There are several formal definitions of these practices, including the Information Systems Audit and Control Association’s COBIT and the United Kingdom’s IT Infrastructure Library (ITIL). ITIL’s IT Service Management system, for example, focuses upon five service areas that should be placed under governance through definition and periodic assessment: business relationship management, demand management, strategy management, portfolio management, and financial management. ITIL also provides detailed guidance on operational areas such as infrastructure security, application management, and implementation planning. [Cartlidge 2007]
Agile warehousing programs will find IT governance to be a challenging scaling factor when the policy and procedures of IT department preclude many of the shortcuts suggested by agile principles, such as sourcing detailed requirements through eye-to-eye conversations with users and treating source code as a modules working design until it passes validation. Perhaps the fastest approach to resolving such points of conflicts can be found among the agile communities emerging literature on “Lean IT” governance schemes. [Bell 2011] These studies strive to map agile practices arising out of the “lean” family of agile approaches to the general categories of IT governance such as ITIL, including policy and standards, roles and responsibilities, processes, and measures. [Ambler & Kroll 2011]
Organizational culture
Invariably, agile programs encounter a seemingly impenetrable wall composed of the company’s beliefs—crystallized in its many policies, templates, and checklists—that allow no room for the innovative philosophies and techniques that agile depends upon. Often, the root causes of these conflicts are summarized by nonagile staff in statements as terse as “iterative methods just won’t work in this company.” Frustrated by such pronouncements, many agile champions will realize that to succeed, they will have to find a way to change the entire culture of the IT department or the CIO’s organization, a daunting proposition at best.
Luckily, the field of organizational change management can provide a model for creating opportunities for agile advocates to insert incremental delivery concepts into the corporate culture. Starting in the mid-1990s, the change management industry has been promoting structured approaches to shifting individuals, teams, and organizations from a limited, current state to a desired future orientation with greater potential. These strategies revolve around changing the mind-sets, behaviors, and systems employed by the individuals, teams, and larger groupings that exist within a company. [Anderson 2010]
A fast way for the agile advocate to begin strategizing mechanisms for warming an organization to new ideas such as incremental methods can be found in Change the Culture, Change the Game. [Connors 2011] This management consulting book offers aspiring change agents a particularly streamlined approach to planning new experiences for staff and managers that will spark changes in beliefs and practices so that new cultural directions begin to emerge.
Organizational distribution
Because data warehouses are such large, multipurpose applications, often the agile teams building them cannot identify a single product owner who can articulate all the necessary requirements, let alone communicate with all the impacted stakeholders in a large company. Because data ownership is often unclear within large companies, warehouse planners can find it difficult to secure solid definitions of the source and target elements from the many stakeholder groups involved. When the business community gets too large and disjointed, agile teams will need some data-specific groupware tools to secure solid agreements on shared business terms. The next volume of this book set looks at some of those tools and the techniques they make possible in a section that focuses upon requirements management.
Beyond business-term definitions, agile warehouse projects often stumble over organizational politics within a distributed company. Control of legacy BI applications, plus the business rules and staffing that goes with them, can become heavily guarded when new warehousing projects emerge. Although one might cynically look for solutions to this challenge in Machiavelli’s The Prince, a two-fold contemporary approach will probably lead to more desirable results. First, linking the project to the business’s money-making machine is always the bedrock of building the political support needed to mitigate an organization obstruction. To this end one can tap into general business management books, such as Charan’s What the CEO Wants You to Know [Charan 2001], which—title aside—identifies basic business drivers linking the interests of directors, middle managers, and knowledge workers throughout an organization. Second, there are business books specifically about managing tumultuous events, including those that disruptive technologies such as agile frequently set off. The First 90 Days provides a quick approach to properly categorizing which of four possible business situations a new project may find itself: start-ups, turnarounds, realignments, or sustained success. This book then provides step-by-step processes for combining elements from the company’s structure, systems, strategies, and skills into a 3-month roadmap for success. [Watkins 2003]
Finally, distributed organizations frequently cause tough problems for enterprise data warehousing programs in particular. In many corporate settings, funding for DWBI is allocated through the business departments on a project-by-project basis. This arrangement leaves the enterprise architects without any resources of their own with which they can pursue reusable components to be shared between the departmental projects, inviting a myriad of unmanageable, stovepiped solutions to result. Without shared development, the architects find themselves unable to ensure that an enterprise data warehouse will somehow emerge from a long series of many, loosely coupled, agile data mart projects. The enterprise architecture group could have already compiled a comprehensive data architecture for the company and be striving to instill it into departmental projects through mandatory architectural review sessions. However, because enterprise architecture groups rarely have any funding to contribute toward development, the dictates of their review boards are sidestepped easily by the departmental application teams when they do not speak to the immediate objectives of each project.
In practice, enterprise architects facing project-level funding schemes need to offer a set of DWBI services that are so attractive to the departmental development teams that enterprise architecture gets invited to join the agile projects as visiting resources. With a seat at the table, they can begin to steer the individual project designs toward shared enterprise objectives. A recent white paper provides a good list of over 50 such services an enterprise architecture group can offer to departmental development projects. [Hughes 2011] This white paper also provides a balancing framework, reproduced in Figure 9.2, which guides enterprise BI planners in monitoring and optimizing their relationship with each individual project. By managing the balance suggested by this framework properly, the corporate architecture group will find itself providing enough project-level support that it will be able to coax the departmental teams into contributing to enterprise-level warehouse assets. With such participation from the departmental development efforts, an enterprise warehouse can emerge from a collection of separately funded agile BI projects.
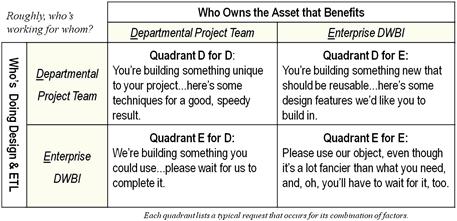
Figure 9.2 Enterprise business intelligence architecture balancing framework.
Coordinating multiple scrum teams
Projects with a long list of stories to deliver within a compressed amount of time will need more developers than a single agile team can support. Project planners naturally need to know the point where simply adding developers to an existing team no longer works and at which point additional teams need to be inaugurated. The answer differs upon the agile method the program has employed. It is easier to discuss Scrum first and then reconsider the answer for pull-based approaches once they have been presented below as an evolution for iterative development schemes.
Using time-boxed Scrum, DWBI departments will need to keep the teams fairly small. Scrum dedicates a full day to the story conference and task planning session. Unfortunately, a team can only decompose a limited number of user stories from product owner concepts to detailed development tasks within a single day. Moreover, Scrum performs its fine-grained developer coordination through the stand-up meetings. Only so many people can check using the three Scrum questions during a short meeting of 15 to 20 minutes.
These factors determine that Scrum teams become ineffective as they approach the 10-member mark. Given that limit, individual teams will have to stay small, forcing program planners to establish many teams for big applications, coordinating between them for the proper sequencing of large deliverables. There are three straightforward means for coordinating a collection of multiple agile teams: “scrum of scrums,” milestones marked on time-bracketed backlogs, and the progress visualization made possible by earned-value reporting.
Coordinating through scrum of scrums
The original Scrum book described scrum of scrums as “a daily scrum consisting of one member from each team in a multiteam project.” [Schwaber 2004] Perhaps because data integration projects frequently involve meta data, which is defined as “data about data,” warehousing teams sometimes drop the awkward-sounding “scrums of scrum” and speak instead of meta scrums. In the simplest of scaling situations, individual teams will hold their morning stand-ups and then send one member each to program-level scrum of scrums. This meta scrum follows the same format as the project scrums, where each participant quickly covers the three questions:
Agile coaches make several suggestions to ensure smooth scaling through scrum of scrums:
• Perform sufficient preproject planning to eliminate as many dependencies between the teams as possible by giving them an independent and coherent portion of the program’s release backlog.
• Colocate the teams in a single building or small campus so that meta scrums and other incidental communication can occur fluidly.
• Synchronize the teams’ iterations if possible so that (a) no team is locked away in a story conference or retrospective when other teams need their input and (b) they can easily include each other’s newly produced deliverables in their normal planning phases.
In practice, however, these suggestions do not add up to a robust scaling solution. It is not always possible to assign each team an “orthogonal” portion of a program backlog free of any major dependencies, especially in data warehousing. Far more frequently, these applications serve as key data exchange points for multiple functional groups within the corporation. The clinical trial warehouse shown in Figure 9.3, taken from one of the author’s projects in the biomedical industry, is a typical example. As indicated by the differing circles at the end of the lines in this data topology diagram, the warehouse provided a crucial data interchange between multiple lines of business applications, sometimes serving as a consumer of data for information collation purposes and other times serving as a “source of record” once the information has been scrubbed and integrated. Many warehousing thought leaders strongly caution against using data warehouses to feed operational systems, but regardless of guidance, the practice is all too common.
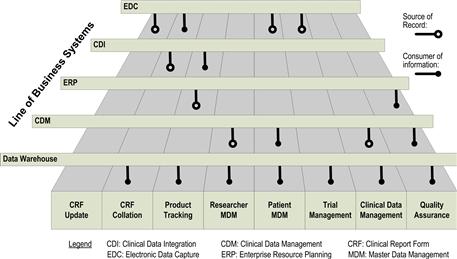
Figure 9.3 Data topology diagram for typical warehouse program with extensively interdependent projects.
The program depicted in Figure 9.3 was complicated further by the fact that the warehouse department was organized into several standing teams with widely varying skill inventories and sprint lengths. A single data architecting team owned the company’s shared integration layer and followed an 8-week cycle for updating the database, flatly denying the possibility of a shorter time box. Pulling data from the corporate warehouse were several project-based ETL teams that each owned a separate data mart and preferred to work on 4-week cycles. Finally, the multiple BI teams that maintained individual dashboard applications were quite happy delivering on 2-week cycles.
The company truly valued the delivery speed and quality provided by Scrum, but it needed something more robust than simply scrum of scrums to coordinate work across so many teams with such a divergent set of work cadences At first, the program managers tried to synchronize the top of cycles across all three types of teams, but something always occurred with one or another team to knock them off the cadence. Figure 9.4 portrays a far more forgiving arrangement of meta scrums needed to solve this challenge. Although only one instance for each type of team is depicted here, the diagram shows a pipeline with typical stages for analysis and design, coding, and high-volume testing presented in the prior chapter.
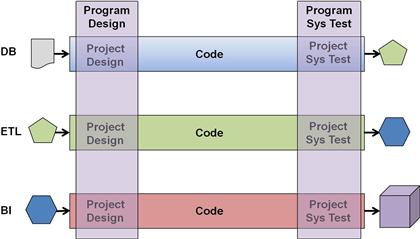
Figure 9.4 Specialty-based meta scrums coordinate projects across large programs.
Overlaid across the first stage of each pipeline is a meta scrum of project architects, one from each team. Instead of shuttling between short daily scrums at project and program levels, these architects would spend the entire morning with their project teams and then relocate in the afternoon to a project space dedicated for project architects. There they could struggle with and mitigate the interdependencies between their many projects, preparing materials with which to guide their separate project teams on the following morning. In this fashion, development took place at the detailed project level but architecture and design occurred at a comprehensive program level.
Quality assurance took a similar approach in which the meta scrum for system testers gathered every afternoon in a meeting space the program maintained just for them. Like the architects, these testers spent mornings in the work rooms of their separate project teams, wrestling with the validation issues of their particular development teams. In the afternoon, they met as a cross-project, specialty meta scrum. Together they labored upon a single, all-project build with which they would perform nightly program-level integration testing. As a result, the enterprise data warehouse received unit and component tested at the project level, but integration and regression tested at the program level.
In this manner, an agile data warehousing program can be scaled into the realm of a half-dozen teams or more. The limiting factor is not the number of project teams but the ability of the specialty-driven meta scrums to understand, plan, and disseminate direction back to the individual coding teams. In this variation of scrum of scrums, specialty roles take the place of developers and often have more interdependencies to sift through than coders on a regular development team. Thus, meta scrums can often start to feel too big at even the six to seven member level. With this limit on the scrum of scrum, the ceiling on scaling Scrum to the program level is then in the range of 60 to 70 coders.
Matching milestones
Assuming that they do not share coders or resident scholars, the biggest point of coordination between agile development teams on a program will be the timing of the deliverables that represent the connect points between them. When listed on a project calendar, these major deliverables become project “milestones” that the program managers need the project teams to deliver close to their appointed times, lest other teams fall idle because they have not received the starting components their work requires.
The current estimate artifact described in Chapter 7 provides a handy means for identifying milestones and reasoning whether a particular delivery date for a desired component is reasonable. Figure 9.5 depicts the current estimates of two teams and shows a pair of milestones that they have in common. For clarity, this diagram has omitted the velocity brackets employed earlier in Figure 7.5. Those brackets combined with the story points to determine the iteration in which each developer story would most likely be delivered. With current estimates, it is straightforward to determine the iteration during which the producing team will finish the stories its sister project needs for its milestone. One only has to understand the team’s delivery velocity and then use it to bracket the developer stories on a team’s project backlog. Such projections also make it easy for data architects collaborating in a scrum of scrums to reason about ways to reprioritize their modeling backlogs in the event that a milestone delivery begins to slip in the schedule.
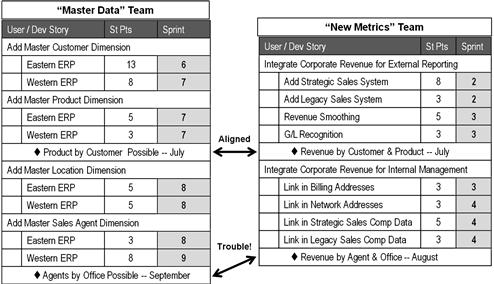
Figure 9.5 Using current estimates for milestone planning between agile DWBI projects.
In practice, milestones from agile-style current estimates are far more dependable than waterfall projections for two reasons in particular. First, the story points on the backlogs come from teams that practice their estimating skills every iteration and get regular confirmation of their accuracy. Second, the velocity brackets used to predict the sprint where a particular story will be completed are derived from the actual delivery speeds of the teams doing the work. The milestone predictions are themselves easy to keep up to date. It requires only shuffling items on a simple list of features on a backlog each time priorities change and then rebracketing them whenever a team displays new velocity. This process is far less work than the waterfall equivalent of rebalancing a PERT graph or updating a Gantt chart full of predecessor and successor relationships, which, for large programs, appear more like microcircuitry than project plans. This combined accuracy and ease of update is often the factor that tips the scale in favor of iterative methods for project management offices deciding whether to try an agile approach.
Balancing work between teams with earned-value reporting
Specialty-driven scrum-of-scrums and current-estimate milestones both make coordinating multiple agile warehousing projects possible, but they do not provide a means of tracking how well each team is performing and whether one should consider reallocating work between the teams in order to match their delivery speeds. Naturally, the sooner a program planner can detect a team that is struggling to keep up, the more options he will have for correcting the situation. Traditional project management has many mechanisms for visualizing progress such as Gantt charts, critical paths, and critical chains. All of them require more information than an agile team typically collects. Traditional project management artifacts require managed links between predecessors and successors tasks, plus confidence intervals on the developer’s estimates for tasks. In contrast, Agile developers can manage their iterations by revisiting the story point estimated earlier for the project’s story cards and then updating each day the remaining labor estimates on a couple of task cards.
Luckily, a technique called earned-value reporting can visualize progress and determine slippage given the information the scrum master already gathers from his teammates: value points, story points, and whether stories are accepted or rejected. Earned-value reporting is typically depicted as a set of line graphs as shown in Figure 9.6. To build such a graph for a team, a program planner needs only the following items:
• a project plan that identifies work ahead and when it should be finished (one can use the current estimate described in Chapter 7)
• a valuation of the planned work (one can use the value points the product owner has assigned to the user stories on his project backlog, also described in Chapter 7)
• predefined “earning rules” to quantify the value of the work delivered (a typical schedule of earning ratios as a function of delivery quality is shown in Table 9.3)
Table 9.3 Typical Schedule of Earning Rules for Earned-Value Reporting
| Quality of Deliverable | Code | Earned |
| Accepted | ACC | 100% |
| Tech debt | TD | 80% |
| Rejected back to coders | R2C | 50% |
| Rejected to designers | R2D | 10% |
| Rejected to architect | R2A | 0% |
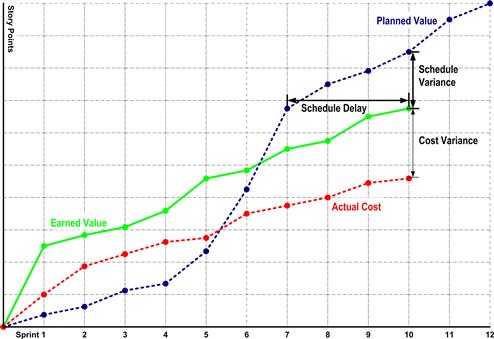
Figure 9.6 Typical earned-value reporting graph for a waterfall project.
Note that the scrum master from each team can provide the first two of these items readily. No additional input is needed from the developers, and thus this reporting device will not interfere with their activities or their velocity.
Lines on the sample earned-value graph mentioned earlier are typical for a waterfall project. The actual cost line takes a nonlinear path because all project expenses are being tracked; those costs typically do not accumulate evenly across time. The planned value line shows the anticipated cost of deliverables plotted using the dates each item is expected to be complete. The earned-value line is the actual cost of deliverables plotted against the date they were actually completed.
The diagram reveals the power of earned-value reporting that makes these graphs so appealing to program manages. Contrasting the earned value against the planned value line for the last time point reveals how far the project is behind in terms of dollars. By examining the time points for the same level of earned versus planned value, one can calculate how far behind the project is running in terms of time. By comparing the earned value to the actual cost line, one can see how much the project is over or below budget. Earned-value graphs are easy to read and quickly answer the crucial questions concerning project spend and performance.
When managing the milestones of an agile data warehouse program, program planners can simplify the earned-value reporting graphs a bit further. For this purpose, one needs graphs for two or more individual teams, as shown in Figure 9.7. The planner will also want to focus upon the performance of the resident team—developers and leadership roles only—leaving participation of visiting resource to be considered later, if there is a problem. By focusing upon just the resident team’s expense, the actual cost line becomes very predictable. It is simply the dollar cost of a stable headcount, and therefore linear and uninteresting. Planners tend not to plot the actual cost line when using earned-value reporting to balance work between agile teams.
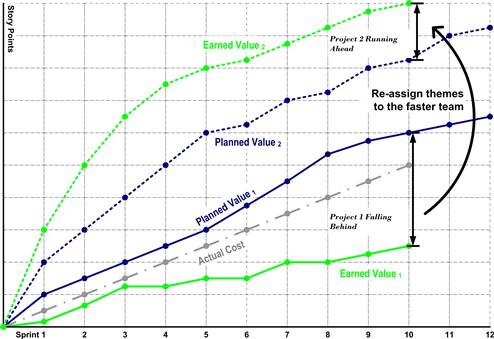
Figure 9.7 Balancing work between teams using earned-value analysis.
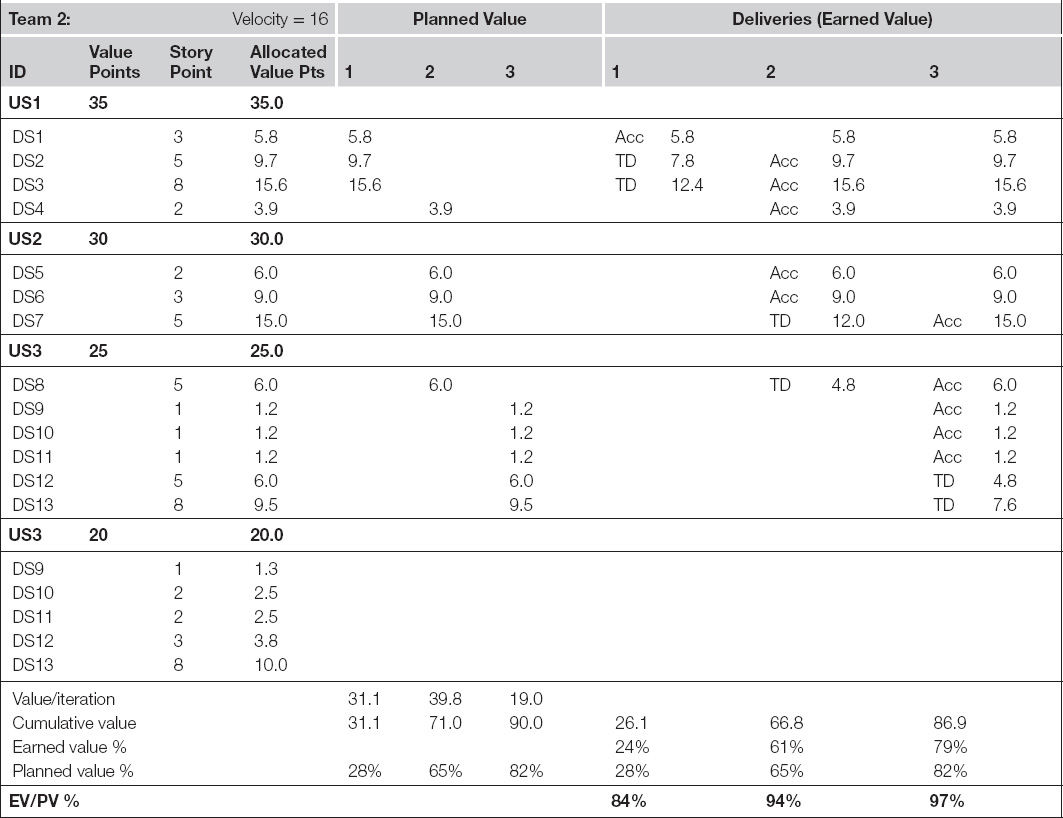
On graphs for an agile data warehousing project, the planned value line is based on value points awarded to the user stories. To make the earned-value lines more granular and responsive to up-to-the minute events, the planner needs these allocated down to developer stories where data integration work is involved. The scrum master or product owner can make this allocation, usually proportioning the value points to developer stories based on the story points the developers estimated for each. This allocation is illustrated in Table 9.4, which details the earned-value calculation for typical iterative project over three iterations. With this approach, the planned value line is simply the allocated value points that would have been delivered if all the developers’ stories were completed in the iterations that the current estimate had scheduled them for.
Table 9.4 Midproject Earned-Value Report for Team 1

The earned-value line is even simpler to calculate. It is the allocated value points of the stories delivered, adjusted for the quality of the deliverable. As depicted for this example earlier in Table 9.3, the program planner gives the team 100% credit for stories accepted by the product owner, 80% for modules accepted with tech debt, and only 50% if they are rejected back for more coding. Stories that are rejected for further analysis and design work are credited as being only 10% complete, and if they need architectural work, no credit at all is given.
The graph of a team’s earned value versus its planned value is interesting enough, but it becomes truly useful when compared to that of another team, as shown in Figure 9.7. Without earned-value reporting, it is very easy to misjudge the relative situations of the individual agile projects that make up a program. For example, which of the following projects sounds like it is in greater trouble?
• Team 1 has had one story rejected every sprint, and others accepted with tech debt. One of the rejected stories had to go all the way back for rework with the project architect.
• Team 2 has had all its stories accepted, although a couple of them were associated with a bit of tech debt.
Based on these simple descriptions alone, one could reasonably think Team 1 was in worse shape and perhaps some of its work should go to Team 2. However, as a close study of Tables 9.4 and 9.5 will reveal, we must factor in the story points and whether stories were delivered before they were expected before drawing this conclusion. Because Team 1’s troubles involved only developer stories with very low points, and because its tech debt was incurred on stories that were not expected until the following iteration, they were actually ahead of schedule when calculated using earned-value metrics. Team 2’s tech debt centered upon modules with very high story points, bringing their earned-value performance down considerably.
Table 9.5 Midproject Earned-Value Report for Team 2
Using earned-value reporting to compare teams can lead to graphs that look very much like the one shown in Figure 9.7. Such graphs provide program planners with the insights they need to rebalance work between teams. In this diagram, Team 1 is clearly ahead of schedule and Team 2 is behind. Especially if the latter team’s performance has an important milestone coming due on their project backlog, the program planner would be shrewd to consider Team 2’s project backlog in detail and find work he can reassign to Team 1 in order to achieve a more balanced delivery schedule.
In an agile setting, it is important to reallocate work to the teams instead of moving developers between teams. Changing the composition of teams midproject will require the developers to reestablish its internal work patterns and discover its velocity measure from scratch. Although it is better to reassign work to teams, the practice takes a modicum of care. Developer stories are usually difficult to understand and program outside of their context—they make sense only to their parent user story. Furthermore, as discussed in the middle chapters of this book, user stories can also be hard to understand in isolation because they often correspond with an analytical step rather than an obvious business goal, which is more typically linked to their parent theme. It is the themes that represent the “minimally marketable features” of the project, that is, they are the components that make business sense all on their own and thus can be readily designed, programmed, and validated independently. For this reason, when earned-value reporting suggests that work needs to be rebalanced between teams, the scrum of scrums or other program planners should consider reassigning “themes to teams” for their corrective action.
What is agile data warehousing?
So far, this chapter has described how to get agile warehousing teams started and scaled up for multiple projects, plus how to plan and balance multiteam deliveries. As a new agile warehousing program grows, its champions will want to gather some hard statistics to demonstrate that their new approach is working well and has truly benefited the company. Incremental delivery methods do, in fact, provide a large collection of progress metrics, but because tracking each measure requires effort, it is worth identifying a minimalist set if possible. To identify a select few metrics to focus upon, agile programs will need to be clear about what they are trying to demonstrate. They must be clear on what they mean by the terms “agile” and “agile data warehousing.”
What is “agile?” The reader will by now understand that agile is such a large change in development practices that it is difficult to provide a definition that is at once concise and comprehensive. Is it iterative? Does it thoroughly involve the customer? How much ceremony must it have? How much ad hoc anarchy will it allow? Even seasoned agile practitioners can debate these points at length. If one considers the dozen different agile approaches—from XP and Scrum, to Kanban and RUP—plus the diverse ways they are implemented across thousands of programs, he will find an argument on both sides of all the fundamental questions such as these. The presentation of agile in this book began with the basic tenets and principles of the agile manifesto and then added suggested patterns for team work to them. That layering indicates that agile is a set of philosophies, principles, behaviors, and techniques for developing software, but we still need to state the end that goes with these means.
Figure 9.8 attempts to present the entirety of the agile approach offered in this book, with the highest objectives depicted on the right and the suggested techniques for achieving them flowing into them from the left. It cannot comply with everyone’s definition of agile, but it will make it easy to identify some key metrics for demonstrating to sponsors that the new iterative approach—whether the purist decides to call it agile or not—has made an improvement.
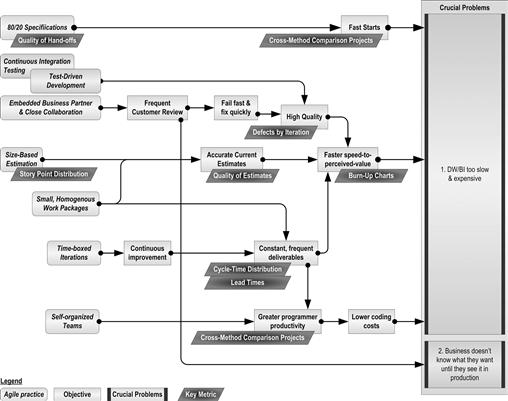
Figure 9.8 One answer to “What is agile data warehousing?”
Figure 9.8’s definition of agile revolves about solving an urgent existential problem that many DWBI shops face today: their customers think they are too slow to deliver and far too expensive. Added to this challenge is another elemental problem, expressed from the DWBI department’s perspective: the business cannot state what it is they want until they first see it on a dashboard. Solving these twin problems calls for a few fundamentally different strategies: faster starts, greater programmer productivity, and—above all else—faster speed to value.
As can be traced to the left side of Figure 9.8, the need for speed requires us to employ many innovative, labor-saving techniques such as self-organized teams, 80/20 specifications, and close collaboration (even colocation, if possible). However, speed to market cannot be a one-time deliverable, so the diagram includes notions such as constant, frequent deliverables and continuous improvement, which suggests an iterative approach, at least at the outset.
As this book further explored techniques for fast delivery, it discussed other priorities of a team’s business partners, such as dependable data and clear forecasts for delivery cost and dates. These priorities added the notions of high-quality and current labor estimates to the objectives of agile warehousing as elements of customer satisfaction. The key role of quality also requires several other familiar aspects: test-driven development, frequent customer reviews, and the whole notion of fail fast and fix quickly.
This carefully vetted chain of challenges and solutions, then, results in a single-sentence outline of agile data warehousing that is probably more a good start on a definition than the final formulation:
Agile data warehousing is a set of principles, behaviors, and techniques that provides our customers a far shorter time to value for quality business intelligence through fast project starts, high business involvement, frequent increments of value, and regularly updated planning information.
Any agile warehousing team can test this definition quite easily by compromising on any one aspect. Take a year to start a new project, or 12 months to deliver a first, working product. Alternatively, give the end users less than perfect data or deny them any idea of how much time and money the project will require. Teams that try any one of these compromises will quickly hear the same gripes sprouting among their end users again: DWBI takes too long and far too much money to create anything useful. In the definition given earlier, speed to market is the primary goal. Indeed, we opened this book with one study suggesting that accelerations of two to four times waterfall delivery rates can be achieved based on methods alone. It may be instructive, then, to take a moment and describe where agile gets all its speed. Table 9.6 lists the primary accelerators agile data practitioners emphasize when instructing new teams. Of course, constantly improving, self-organized teams are prominent on the list, as is the deprecation of big, to-be specifications throughout the project. Upon reflection, many of the elements in Table 9.6 provide speed through an indirect mechanism: they help the team avoid big mistakes that would consume inordinate amounts of time. These are noted in Table 9.6 and can be used by agile warehousing champions to counter the notion that fast starts and 80/20 specifications are not disciplined enough to represent a careful approach to building applications.
Table 9.6 Where Agile Gets Its Speed
| Aspect | Direct Acceleration | Avoids Time-Consuming Mistakes |
| Self-organized teams | Y | |
| 80/20 specifications | Y | |
| Technical leads stay in project room | Y | Y |
| Customer descopes stories that lose value | Y | Y |
| More accurate estimation | Y | |
| Test-driven development | Y | |
| Coding starts early→feedback sooner | Y | |
| Business frequently reviews deliverables | Y | |
| Automated testing catches errors | Y | |
| Paying off tech debt early | Y |
Communicating success
The quick sketch given of agile data warehousing provides a handy means of identifying a core set of metrics to demonstrate the effectiveness of an iterative DWBI implementation. As indicated by the dark slanted boxes in Figure 9.8, a few key metrics address the value delivered, reveal when teams need coaching, or demonstrate whether a coach’s recommendations has helped them improve their agile practices. The descriptions that follow work from the left of Figure 9.8 toward the right. Those metrics to the left are closer to the developers’ concerns regarding their collaboration. Those on the right pertain to the higher level issues determining customer satisfaction. As seen from their definitions, all of these metrics besides the cross-method project comparison can be compiled easily by the scrum master and system testers using measures they already have or can acquire quickly during a sprint retrospective. For multiproject environments, these metrics can be displayed on a daily dashboard in order to give both stakeholders and developers the regular feedback needed to monitor performance. Those metrics that change daily will benefit from this regular refresh, of course. Those measures gathered at the end of each iteration may remain static for multiple weeks for a given team. If they are part of larger programs, however, their aggregate value will change more frequently because at least one project will provide an updated input every day or two.
Handoff quality
The development process presented in previous chapters sets up a considerable challenge for the software developers on the team. The process established a pipeline of labor specialties, but still exhorted the members of the team to work quickly, using lightweight specifications that focus upon the most important 80% of the remaining unknowns related to each module. Although such pared-down specs allow us to get a project started after investing only 20% or so of the time waterfall efforts consume, even these minimalist specifications must be of high quality. Despite the fact that the missing details will be supplied via eye-to-eye consultation with the upstream party, if the lightweight sketch prepared ahead of time is grossly incomplete, these discussions will take far too long and project work will grind to a halt.
For this reason, agile warehousing teams need a means for ensuring that these 80/20 artifacts are usable and that the handoffs between teammates are effective. However, in order to measure this effectiveness, scrum coaches do not want to resort to a point-by-point audit of the deliverables exchanged between roles, as is done in many highly elaborate waterfall methods. A better approach is to measure the downstream party’s satisfaction with the handoff without trying to define what each handoff must be. Once that satisfaction or lack thereof is measured, the two parties involved in the exchange can work through the details of how to make it better.
Because we want to know whether consumers all along the agile warehousing value chain are happy, why not use the ubiquitous tool that the corporate world uses to measure its customer satisfaction: the net promoter score? For this purpose, the net promoter score can be obtained by asking each “customer” in the value chain a single question: “On a scale of 0 to 10, how likely would you be to recommend your upstream partner to a friend in the company performing the same role as you?” Here “10” is “extremely likely” and “0” is “not at all.” Based on their responses, customers are categorized into three groups. Folks responding a 9 to 10 rating are considered “promoters.” Customers answering 7 to 8 are “passives,” and those replying with anything lower are considered “detractors.” The percentage of detractors is then subtracted from the percentage of promoters to obtain a net promoter score (NPS). The NPS will range from −100 for those situations where everyone is a detractor to +100 when everyone is a promoter of the teammate in question. In marketing surveys, an NPS score above 0 is considered good, with values of +50 considered excellent.
On an agile team, because the scrum master can collect individual promoter scores quickly during the sprint retrospectives, gathering them will not impact team velocity. He can track them at the developer story level rather than for each task so there will be only a handful of scores to collect for each producer on the team. Even the product owner can be rated by the project architect, which will provide important feedback on this crucial area of business-IT alignment.
For agile warehousing teams, upstream producers in the value chain should be able to do far better than a net promoter score of 50%. The close collaboration and frequent appraisals at the sprint retrospectives should provide the motivation and guidance producers need to please their development partners 90% of the time after a little discussion of each party’s expectations. More important than the absolute level, however, is the trend. If the NPS starts low at the beginning of the project, it only points out where work needs to be done. As long as the NPS moves upward quickly and remains high once reaching the 90% level, team leads can be reasonably assured that the developers are communicating well all along the value chain and that the risk of the team making a big mistake in requirements or design has been minimized.
Quality of estimates
On the agile warehousing definition chart shown in Figure 9.8, accurate current estimates build good rapport with business partners by demonstrating a faster speed to value even before the whole project has completed. Scrum coaches need to ensure that the team is honoring these forecasts, so the diagram affixed this objective with a metric called quality of estimates. As discussed earlier in Chapter 7, this metric is also pivotal in detecting new troubles within the team’s work process. Whereas time to value (or, equivalently, speed to market) considers “Job Number One” for the developers, the quality of their estimates can only stay high if they are conducting all parts of the method effectively, and therefore this measure serves as their “canary in the coal mine.”
To remind the reader, this metric is defined as the number of labor hours originally estimated for tasks on stories accepted at each user demo divided by the estimated hours of all tasks included in the sprint, after subtracting from the numerator the hours estimated for any tech debt carried over into the next sprint. The quality of estimates may start low for new teams but should reach the mid-90 percentage range by the third or fourth iteration. If anything goes wrong with the team’s self-organized process, this number will fall, alerting the program that this team in particular could use some coaching.
Defects by iteration
Faster speed to market will not impress a DWBI department’s business partner unless its developers are delivering quality data. Without it, they risk losing their product owner’s support and their project’s funding altogether. True, earned-value reporting does provide some indication of quality by reducing the value credited to the team when stories get pushed back to earlier stages in the pipeline due to defects, but the root cause still remains hidden in the earned-value line.
Figure 9.9 provides a mechanism for making careless coding instantly visible for the team. This Defects by Iteration bar chart depicts the number of defects found during integration testing. Defects are categorized by the iteration in which they first appeared, which is important because defects can be fixed only to reappear two or three sprints later if not truly corrected. By measuring quality at the system integration level, this diagram nets out the chaos occurring during unit or component testing, which typically takes place on the developers’ workstations. Instead, Figure 9.9 reveals only the flaws found in modules the developers have sent to integration testing, claiming they were “done” (that is, “error free”).
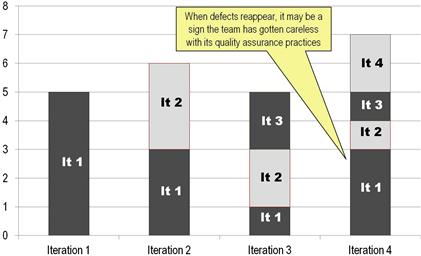
Figure 9.9 Tracking defects by iteration.
When testing gets particularly busy after the first three or four iterations, the chart in Figure 9.9 can be meaningfully compiled on a daily basis for the team to review before every stand-up meeting. For prior sprints on the diagram, the height of the bars shows the total number of defects open at the end of the iteration. For the sprint in progress, the bar height indicates the number of defects currently open. As defects emerge, the system testers actively identify them in a way that they can be recognized should they reappear after being fixed. Recording the module and error type for each bug is often sufficient.
Ideally, defects appearing in one sprint will be resolved by the time the next sprint concludes, but teams are less than perfect when it comes to resolving coding flaws. Bugs come back “from the dead,” as can be seen in the last bar for the current sprint. Teams need some feedback on how they are doing at truly fixing data quality flaws. When supposedly corrected bugs return, it can indicate deep problems with the team’s approach to root cause analysis or coordination between the developers. Moreover, as discussed in the last chapter, some defects must go back to analysis and design or even architecture for resolution. By highlighting persistent defects, this diagram can suggest when certain defects may need that extreme level of attention.
Burn-up charts
Because the agile data warehousing definition diagram ties faster speed to market to customer satisfaction, teams must have a measure of their delivery speed to share with their business partners. For this purpose, an agile burn-up chart is a graphical depiction of the value the team has created for the business community to date. This metric, too, can be compiled by the scrum master using data he already tracks with only a minimum of additional effort.
As revealed by Figure 9.10, this burn-up chart reveals the value delivered by the team with each iteration. In the generic agile version of this graph, the scrum master simply adds the value points associated with the user stories that have been accepted by the product owner during the sprint demos. Agile warehousing programs can base it instead upon accepted developer stories to make the graph a bit more granular. The product owner has collected value points for the themes in the backlog by using estimating poker with the project’s community of business stakeholders. To build the burn-up chart, the scrum master can proportion each theme’s value points to its component developer stories based on the ratio of one story’s story points compared to total story points encompassed by the theme.
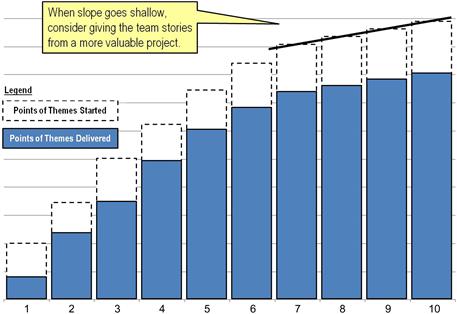
Figure 9.10 Burn-up chart showing value points delivered by sprint.
So that the chart is as meaningful as possible, the scrum master should give his team credit for stories that have been accepted based on the large-volume demo performed by the system tester rather than the programmers’ small-volume demo. The former set contains stories that can actually be promoted into user acceptance testing should the product owner call for a new product release, and therefore are the only stories that truly matter to him.
For greater transparency, the sample burn-up diagram uses two overlaid styles of bars. The lower solid bar represents value points associated with themes for which all developer stories have passed system integration testing, the preferred definition of “delivered.” The team’s developers can use these bars alone to demonstrate to the product owner that they are steadily providing value. They can even remind him which end-user features were delivered in each iteration by reviewing archived versions of the project backlog for those prior sprints. The outlined tip of each bar in Figure 9.10 depicts value points for the additional themes for which developer stories are underway. These “value in progress” bars quantify the additional value that is already in the pipeline for the product owner so that he can gauge the importance of the features coming versus those that have already arrived.
With the burn-up chart in hand, the team can demonstrate to the product owner and his management that the team is delivering upon the business requests that were given to them. For teams that have prioritized their project backlog according to guidelines offered during an earlier chapter with Table 7.4, stories with the greatest value will be located toward the top of the list. With that ordering in effect, the delivered value shown on the burn-up chart should climb steeply during early iterations because the team is delivering the most important features first for the most part. With time, however, the slope of both value delivered and value in progress stacks should soften, making burn-up charts good vehicles for discussing whether coding should continue on a given project. If the business has other warehousing needs waiting, perhaps the organization would be better off at this point filling this team’s backlog with stories from those projects, as they will probably result in faster burn-ups bars for the next several iterations.
Cross-method comparison projects
As suggested in the agile data warehousing definition diagram, faster starts and speedier component deliveries are primary objectives of the agile DWBI approach. Yet this notion begs an important question: faster than what? A good answer for a DWBI department would be “faster than the previous method that had frustrated our business partners to the point where we in IT had to start searching for a new method.” To prove that “faster” has been achieved, then, the agile team will need a reference point to compare against. Somehow, it must find or derive the delivery speed of a waterfall project that it can use as a reasonable reference.
Especially while IT is still considering whether to switch to agile methods, it may well be possible to identify two warehousing projects of similar scope and source data so that one can be pursued with an agile approach and the other using the department’s standard development method. If a pair of comparable project cannot be found in the development queue, then perhaps a single large project can be split into two, with each half pursued by a contrasting method. At worse, a set of baseline statistics can be derived from the records of a previous waterfall project. If at all possible, the two projects should start with definitions provided by the same architect, data architect, and systems analyst so that the only difference is the method, not specification quality.
The easiest and most informative metrics to match between two comparable projects are programmer hours per target data object. Total project costs per target object should be derived as well. If the two projects involve vastly different sets of business rules, a first set of metrics should be calculated for delivering just the base target objects—that is, bringing over only the replicated columns, with work on derived column ignored. The team should then prepare a second set of calculations for programming the complex business rules. The former measure can then be measured between the two projects directly, whereas the latter may require some interpretation.
Well-executed agile projects should perform considerably better in terms of programmer productivity for both base target objects and complex business rules. There may be other productivity metrics conceivable for a project, but it is best to keep the number of metrics to a minimum. Because there are more developers on a team than any other role, programmer productivity has a large multiplier associated with it, making it the most important productivity component of team velocity. Agile practitioners often suggest at least a 40% productivity advantage over waterfall for a first project, although 70% can be achieved if the team’s leadership subteam has significant experience with agile warehousing methods. For project costs, the advantage is typically less dramatic because agile projects utilize far more resident resource time and invest more hours into quality assurance, given their emphasis on test-led development and continuous integration testing.
Cycle times and story point distribution
Last but not least are the metrics for lead time and story point distribution metrics. They point the way to the pull-based agile methods such as Scrumban and Kanban that many agile warehousing teams will contemplate after a year or two of iterative delivery practice. Cycle time is defined as the number of days that elapse from the moment the team pulls a developer story into the pipeline and the day it passes integration testing after being added to the nightly build. As the team matures, this cycle time should diminish steadily, adjusting for each work package’s story points until it reaches a base level that reflects how long it takes a truly high-velocity team to transform a sizable feature request into working software.
The story point distribution chart shows the number of stories in the project backlog for each level of story points estimated. It is an important indicator of how consistently a team is defining its developer stories. By steadily improving the definition of developer stories, the team can narrow greatly the story point range of the items in their project backlog, which will allow them to focus on perfecting their coding habits for a particular size of work units. Backlogs with stories ranging from 2 to 20 points require the team to maintain a wide variety of work patterns, making it hard to know where to optimize. A team performing sprint after sprint on stories mostly in the 3- and 5-point range, however, will be able to finely tune its internal definitions, handoffs, and coding patterns for maximum speed. Figure 9.11 demonstrates a story point distribution chart, and readers will find a cycle time analysis later in Figure 9.14.
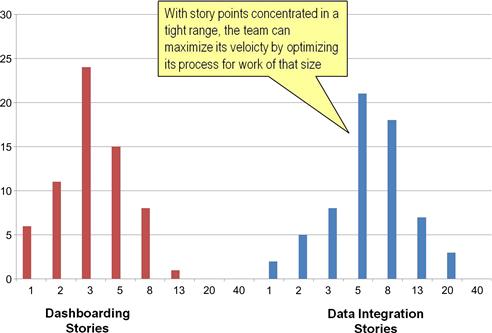
Figure 9.11 Single team’s story point distribution chart by work type.
Moving to pull-driven systems
With cycle times defined, we can now return to the last two steps of the agile warehousing maturity path listed at the bottom of Table 9.1. Recent years have seen a growing consideration of Kanban workflow management techniques, which represent another class of agile methods called “pull-based systems.” The pull-based approach offers agile data warehousing programs ways to move their teams beyond the need for time-boxed iterations. Without time boxing, teams pursue simply a steady flow of software development, which allows them to continue programming during the 2 days they used to lose to the top-of-cycle stages of Scrum, such as the story conference and sprint retrospective.
Given its potential for greater team productivity, this chapter closes with a glimpse at a pull-based, continuous flow approach and the advantages it might offer. It shows how a pull-based system might be adapted for a DWBI project and then discusses some of the key considerations that will determine if, when, and how far a given agile warehousing program may want to go in that direction.
A glimpse at a pull-based approach
Kanban is a work management approach that emphasizes continuous flow rather than delivery through iterations. Developers that are ready for it can drop it on top of their current process, without needing to alter the pattern of interactions occurring between teammates as they build their application. If their starting approach was Scrum, then this adaptation yields a hybrid method called “Scrumban.”
The most visible aspect of introducing Kanban into a Scrum project is the changes it will make to the task board. Many of the other aspects of Scrum, such as user stories and self-organized teams, remain in place. Features of the updated task board will impact mostly work planning in ways that may eventually obviate many of Scrum’s ceremonial aspects. The extent to which developers drop the features of Scrum will be determined largely by how much the team depends on the repeating deadlines that the time box provides to stay effective. Some teams just make a few Kanban-style changes to their task boards and then continue using iterations. Others begin managing their work using Kanban’s new metrics and eventually drop the notion of sprints altogether.
The new features Kanban adds to the task board are usually (a) more columns that model the software development process in slightly greater detail and (b) work-in-progress (WIP) limits. Figure 9.12 depicts one way a team might use these concepts to update the generic Scrum task board first introduced in an earlier chapter using Figure 3.1. There is still a reference column for stories along the left edge, only now it holds several developer stories, grouped into swim lanes for the user story they pertain to. Columns for the task cards to race through as they are worked have remained the same with waiting, underway, and ready for validation still on the board. For clarity, this diagram has omitted the test written column.
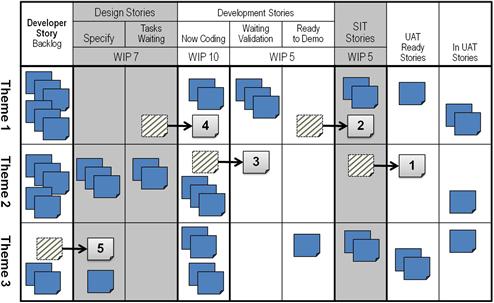
Figure 9.12 Scrum data warehousing task board adapted for Kanban concepts.
The task board now has cards for developer stories rather than tasks. The swim lanes have been reset to align with user stories. Moreover, the upstream and downstream work specialties of the pipeline defined in the last chapter now have columns for tracking their work. The new task board has added a set of design columns for the data architect and systems analysts to manage on the left and a column dedicated to system integration testing on the right. These roles no longer have to manage their own work “off the board,” but instead now participate fully with orchestrating the flow of work through the new board. The updated task board also gives the designers ownership of the tasks waiting column so that these team leads can use it as their “done” buffer, leaving modules to rest there until coders are ready pull a story into the columns they manage and begin programming it.
As a further change, this updated task board also now contains several work-in-progress limits. These WIP limits place a cap upon how many stories each station can have under its management at any one time. The board in Figure 9.12 belongs to a team with five coders, so the WIP limit for their work was set at 10, based on the notion that each developer needs one work unit they can be engaged in actively plus another one on hold due to a dependency. The limit for waiting validation was set at one item per developer, thinking that if each developer had a module waiting to be reviewed, programming should stop and the programmers should focus instead on checking each other’s work.
The WIP limit for the upstream design work was set at seven thinking that at any one time there should be one item ready to code per programmer plus a couple more in case coding proceeds faster than expected. SIT’s limit of five was set based on the system tester’s (rather loud) assertion that he wanted to have only one module to discuss with each programmer at any given moment. Tuning a Kanban system for optimal flow is largely a matter of picking the right value for these WIP limits as work cards pile up or become absent in different parts of the task board.
Figure 9.12 also shows how a team would move tasks through this board while honoring the new WIP limits. In the first step, SIT finishes validating a module and moves its task card into UAT ready. For the second step, the vacancy just created in his column allows the tester to pull a module from the coders’ ready to demo column without exceeding his WIP limit. In the third step, the spot just opened by the tester allows coders to advance one of their modules from now coding into waiting validation. Fourth, the space created by the last action allows one of the programmers to pull a newly designed module from tasks waiting into the now coding column. Finally, the designers see that their work set has fallen below the WIP limit, so they chose a new story from the backlog and pulled it into their specification activities.
Note that the modules advanced at each step do not have to all lie within the same swim lane, meaning they do not have to all pertain to the same user story. Pull-based systems still rely on self-organized teams. Each time there is an opportunity to pull work forward in the process, the team needs to discuss which module is most important to make new progress upon.
The newly added WIP limits serve as a means of balancing work within the iteration. Without them, all tasks could be started at once, leaving the coders ineffectively multitasking and the tester with too little to do until late in the iteration. By setting some WIP limits, the team forces itself to focus on advancing tasks to the latter columns of the board as soon as possible. Tuning these WIP limits over time ensures that tasks will flow steadily through all stages of the development value chain modeled on the board. When tasks pile up in one column, it indicates a bottleneck. In the short term, the self-organized team can swarm to a particular step in the development process and concentrate their efforts until the log jam has been cleared. Later, during the sprint retrospective, the team can select new values for the WIP limits and even add some new buffer columns in order to avoid such a pile up in the future.
In addition to changing the task board, Kanban principles provide the team with a new artifact for monitoring their development activities—the cumulative flow diagram (CFD). Figure 9.13 provides an example of this diagram and shows some of the performance metrics a team can derive from it. The CFD graphs the cumulative number of stories that have entered each stage across time and, in Scrumban, across all iterations. The units of measure can be number of developer stories or the story points of items added to each work stage.
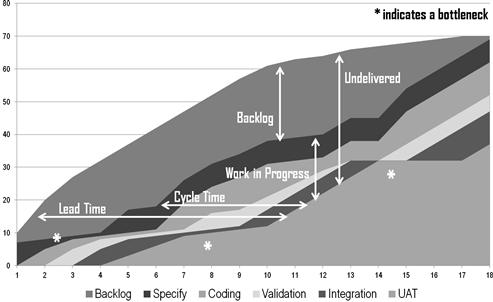
Figure 9.13 Cumulative flow diagram and some of the metrics it provides.
The vertical height of each band depicts work in progress within that stage at a particular time point. Sudden increases in overall work in progress in any one stage are associated with plateaus along one or more components of the downstream system. These indicate a process bottleneck, such as the ones indicated by asterisks in the diagram. Take the bottleneck farthest to the right, for example. Here the number of modules added to UAT started to lag behind the number of items SIT had finished testing. This plateau alerted the team to the fact that the product owner had gotten distracted by a business emergency back in his department and had to be reminded to continue working the warehouse development project, too.
The horizontal span between units entering specify and landing in UAT ready is the system’s “cycle time.” This measure serves as a good indicator for how long the team takes to translate a request into a working module once they start working on it. The other horizontal stretch between backlog and UAT ready is of great interest to the product owner, for it represents the project’s “lead time,” that is, the number of days he must wait after giving the project architect a good description of a new feature before he can evaluate the new capabilities in a system test using large-volume data.
Kanban allows one further artifact crucial for considering agile warehousing beyond time boxes—the cycle time distribution analysis, an example of which is shown in Figure 9.14. The middle grid of this analysis shows the lag between specify and UAT ready for individual work units across the iterations of the project. The “count” column on the right tallies the number of units across all iterations that have taken the given number of days to move through this major portion of the task board. In this example, a good 95% of the work units went from design to UAT in less than the 13 coding days that make up this team’s 3-week time box. One can also learn that roughly two-thirds of the time modules are delivered within 8 days or less.
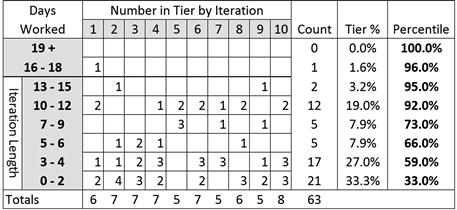
Figure 9.14 Cycle time distribution analysis.
Kanban advocates claim that these cycle time brackets are key to designing truly efficient software development systems. With some thought, a team developer’s could base its service level agreement (SLA) with customers upon its cycle time distribution plot. An SLA is a promise to a customer to satisfy a request within a certain amount of time. In this case, the team could segment that promise a bit by stating: From the moment we pull a feature request into our work process, we will deliver it within 8 days 60% of the time and within 13 days 95% of the time. As will be seen in a moment, that level of insight is key to moving toward agile warehousing without time-boxed iterations.
Kanban advantages
Kanban offers some very tempting simplifications and expanded capabilities to agile development teams. The value proposition it offers has many layers to it and runs much along the following outline.
1. Building the development process into the task board allows greater visibility as to where work is occurring within the system.
2. WIP limits prevent the team from taking on too much in any one area, thereby leading to higher effectiveness by minimizing multitasking.
3. When work piles up in one process stage, it reveals bottlenecks in the overall development process that can be improved.
4. WIP limits give the team the levers they need to balance their process so that most work units will flow through the system as quickly as possible.
5. With enough data points, the team can identify a service level it can offer dependably to its customer.
6. By switching to a service level agreement with its customers, there is no longer any need for a team to promise delivery of a defined set of features by a certain date—time boxing becomes unnecessary. Iterations can be dropped if the team chooses to do so. In that situation, the team simply pulls work into the development process as needed to keep the leading buffers filled to their WIP limit.
7. Teams that free themselves from formal iterations no longer need to estimate the work to ensure that it will fit into a time box. They only need to define their work consistently and let the SLA reassure the customers that the work will get done expeditiously.
8. Without the need for a time box or estimating, the story conference and task planning become superfluous. Kanban excels when employed upon a backlog of consistently sized work items that all require roughly the same delivery process. The team leadership roles need to focus on providing stories defined so they are congruent with the developers’ preferred size and development process. As long as stories entering the development process are congruent with developer expectations for work units, there is no need for the team to halt the production process and discuss a large batch of stories. Stories will be demoed as completed to the product owner.
9. By skipping Scrum’s top-of-cycle ceremonies, the team can reclaim 10 to 20% more time for product development.
10. Moreover, now free of these top-of-cycle steps of Scrum, there is no need to keep the team size so small, thus Kanban teams can scale to 50 developers or more.
11. Once free of the iterative structure, there is no longer any need to keep the work definition steps chained to the cadence of delivery steps. Story identification needs to take place whenever coders need more items to program. Deployments can happen whenever it suits the stakeholders to pull finished pieces into production. Retrospectives take place whenever there is an issue serious enough that it merits halting production to discuss or when a certain number of less important issues have been pinned to the team’s project board. There is no reason to throttle one portion of the process to meet the cadence of the other. Groups at both ends of the system can now work at their optimal speed and patterns.
A more cautious view
Waterfall adherents who thought Scrum’s iterative development was an outlandish proposition now have a doubly radical proposal to contend with:
All a team needs to do to achieve truly remarkable efficiencies is set up the right kind of task board with some work-in-progress limits and track how long it takes a self-organized team to deliver each module of code. No detailed planning or estimating is needed. Eventually, the observed delivery rates will allow program managers to identify the distribution of cycle times, thus enabling them to statistically predict how much projects will cost and how long they will take.
As attractive as a pull-based approach may be, before a team abandons its familiar iterative method in favor of a completely pull-based system, it should ask a few questions about how well data warehousing projects can meet Kanban’s prerequisites.
1 How will a pull-based system respond when stories range too widely in size?
Data warehouses entail multiple categories of work: dashboarding versus data integration, dimensions versus fact tables, replicated columns versus columns derived through complex business rules. These work units can range in story points from 1 to 80. If a team does not estimate work on the front end, what assures us that three 40-point stories do not enter a system designed for 5-point work items, collide in the coding stage, and clog up the entire process?
Because Kanban is only a development-coordination system that drapes over an existing process, it does not preclude us from keeping what works. Teams can still utilize the epic–theme–user/developer story approach developed for Scrum-based warehousing to prevent such blockage from happening. Consequently, the question for the program is something more tractable as “Are my teams’ developer stories granular and consistent enough to allow a pull-based system to work?” If not, perhaps the team needs to work on its story-definition techniques to make the work units consistently small before moving to a pull-based work management system.
2 Can we really define workable units without keeping our estimating skills sharp?
Doing away with the overhead of estimating sounds appealing, but if a team must keep its story defined so they are small, it will need to maintain its developer’s estimating abilities. Without keeping those skills sharp, one or more overly large stories might slip onto the board and jam the process. The best way to stay good at estimating is to practice it regularly. Because iterations regularly require developers to estimate, perhaps teams should continue with the sprints and their story planning component, even if it starts tracking cycle types and using cumulative flow diagrams.
3 Should we categorize our work and adapt the task board in great detail?
Kanban enthusiasts realize that widely varying work units threaten the smooth operations of a pull-based system. They frequently advocate that work that differs in cycle time, skills required, or technology employed be identified with different colored post-its or given their own swim lanes. [Anderson 2010] This segregation will allow WIP limits and service levels to be identified by work type, allowing some process tuning and metric gathering at a medium level of detail. Work types can be depicted on separate cumulative flow diagrams and cycle time distribution plots, allowing the challenges and services levels inherent in each category to be independently understandable. The question then becomes “how many swim lanes will my particular data warehousing program require?” If it runs past five or six, the resulting process may require more tracking effort than it saves on estimating time.
4 Is the underlying process stable enough to have only one optimal set of WIP limits?
Kanban posits that a team needs to set up its task board and then fiddle with the WIP limits until it gets the flow of work just right. That vision presupposes that there is a single stable set of WIP limits (per swim lane) to aim for. Data warehousing projects oscillate between many different kinds of work. A project can start with a large number of easy staging routines and then move into a long spell of very complicated extracts. Data integration modules can be horrendously complex and then give way to a fairly easy ETL transform for star schemas. Program planners should consider whether their teams will have enough time to identify an effective set of WIP limits before the nature of the work changes so much that they will need to start tuning their system all over again.
5 When will we have enough data points to identify a dependable SLA?
The cycle time distribution plot is very handy for identifying actual delivery brackets, assuming one has enough data to reveal the underlying pattern. However, what are those points on the plot? Developer stories? There may not be enough developer stories in a project to provide the high number of data points needed for a good statistical calculation of average cycle times. Especially for teams segmenting the work between several swim lanes, a data mart project may only have a dozen such points to place on each band of the cycle time grid. Can a team truly identify a dependable service level for its customers given this paucity of observations in each category?
6 Aren’t there other reasons for having iterations besides estimating?
Moving out of iterations into a pull-based system takes effort and time. If the only objective was to save the time formerly spent on iteration overhead, the proposition might seem compelling. But iterations often fill more purposes than just estimating the next chunk of work. The planning sessions gave the team a moment to think through the upcoming segment of the project from a higher view point, to collectively reintegrate the project in their minds, and to spot some mistaken assumptions. The end-of-cycle demo and retrospective provide a chance to reconnect with the business partner and reflect on the interpersonal dynamics within the team. These needs may not be met easily in an ad hoc fashion or by adjusting a few WIP limits. Perhaps the iterations perform an important social function, one that is necessary for keeping the team interconnected and fully collaborative.
Stages of scrumban
Questions such as those just given reveal that there is still a need for iterative agile methods for many project teams. However, because the WIP limits and cycle time metrics of pull-based systems provide tremendous insight into the dynamics of a project, many agile practitioners now speak in terms of combining Scrum and Kanban into a hybrid approach called “Scrumban.” [Ladas 2009]
Scrumban is more an evolutionary process that teams must pursue than a particular method that they can simply switch to. The steps a team would take in this evolution might be as follows.
1. A successful Scum team would update its task board. The developers would add a few columns to reflect their preferred development process and some WIP limits to go with each major work step.
2. Once the team believes it has modeled its work process correctly with the new columns on its task board, it would draft a cumulative flow diagram so that it can visualize and begin discussing issues concerning WIP limits and lead times. WIP limits on the task board can then be tuned to achieve a better overall process using the cumulative flow diagram to monitor whether each change makes the system perform any better.
3. After the lead times stabilize and enough data appear on the cycle time distribution plot to identify a dependable set of service brackets, the team can consider switching to service level agreements rather than time boxes.
4. Should the team prove able to dependably deliver within the time frames promised, they can then consider eliminating the iterations altogether, decoupling planning from delivery.
The Scrumban evolution process will not be quick, and there is no predicting how far along this path the team will go until they decide their method is good enough. Given all the cultural changes discussed throughout this book, it seems that Scrum is a necessary first step to move teams from the deeply wasteful antipatterns of waterfall methods to the high-performance world of close customer collaboration and self-organized teams. At some point though, some very experienced teams working on long-term projects will want to take the next step. At that point, pull-driven systems offer yet another leap in productivity that some agile data warehousing programs will be able to take. It will be exciting to discover just how fast each of these pioneering teams can then go.
Summary
Introducing a new team to agile data warehousing can follow a six-step process. Once one team is performing well, a DWBI department can begin scaling up the practice to a program involving 50 or more developers by instituting a scrum of scrums for the specialty roles at both ends of the development pipeline. Several metrics allow a DWBI department to track how well its agile teams are performing and how much value it is delivering to its business partners. Interproject milestones can be scheduled and monitored by comparing each team’s current estimate. When teams start to lag, a modified earned-value reporting graph can reveal which of them can be given additional work in order to let the lagging teams catch up. Cycle time and story point distribution metrics can prepare a team to incorporate some pull-based project management techniques defined by Kanban. These techniques require mostly that the task board be updated with the team’s preferred work process and a few work-in-progress limits. These modifications provide greater insights into the work process and keep development work flowing smoothly. Taken a step further, Kanban may allow Scrum DWBI teams to eliminate time-boxed iterations altogether and reinvest the time into generating more value for their customers. However, many data warehousing teams will find their work too erratic in size and temperament to adapt completely to Kanban. They may also want to keep Scrum’s iteration structure for important social reasons that contribute as much to team effectiveness as does a well-managed task board.