When building a visualization, it is common to map numerical values (e.g., the result of some metrics) or properties to visual attributes. This mapping allows you to compare properties of represented elements easily and visually. Normalizers and scales are essential components of Roassal and provide an API to map a metric or a property to a visual cue (e.g., size, color, and font size).
Normalizing the size of shapes refers to associating a particular value or property with the size of the shape. All the normalizers are accessible from the RSNormalizer class. Consider the following example (see Figure 10-1):
values := #(3 6 10 2).
canvas := RSCanvas new.
shapes := RSEllipse models: values.
canvas addAll: shapes.
shapes @ RSLabeled.
RSNormalizer size
shapes: shapes;
normalize.
RSHorizontalLineLayout new alignMiddle; on: shapes.
canvas zoomToFit.
canvas open
Figure 10-1
Normalizing the shape of some circles
The values variable contains four numbers. Each number is represented as a circle. You use a normalizer to make the size of the shape represent the number. The RSNormalizer size expression creates a normalizer to normalize the shape’s size. The shapes are provided to the normalizer using shapes: and the normalization is carried out by sending normalize.
Note that the RSNormalizer size shapes: shapes; normalize expression makes sense only because the model of each shape is a number. The RSEllipse models: values expression creates circles with a number as a model since the values variable is a collection of numbers.
The range of the normalization can be manually set using from: and to:. Consider this revision (see Figure 10-2):
values := #(3 6 10 2).
canvas := RSCanvas new.
shapes := RSEllipse models: values.
canvas addAll: shapes.
shapes @ RSLabeled.
RSNormalizer size
shapes: shapes;
from: 10;
to: 30;
normalize.
RSHorizontalLineLayout new alignMiddle; on: shapes.
canvas zoomToFit.
canvas open
Figure 10-2
Setting the range of the normalization
Values in the values variable are mapped to sizes ranging from 10 to 30 pixels. The smallest number (2) contained in the values variable is 10 pixels, while the greatest value (10) is 30 pixels.
When applying a normalization, a transformation could be performed. A transformation may have many relevant properties, including coping with disparate values and diminishing outliers. Consider the following code (see Figure 10-3):
RSHorizontalLineLayout new alignMiddle; on: shapes.
canvas zoomToFit.
canvas open
Figure 10-3
Applying a simple transformation
Values are raised to the power 3, which has the effect of highlighting any differences: large values appear much larger than smaller values. Conversely, differences between values may be reduced with a square root transformation ([ :aNumber | aNumber sqrt]) or a logarithmic transformation ([ :aNumber | aNumber ln ]).
The following sections describe the different normalizers offered by Roassal.
The RSNormalizer Class
The RSNormalizer class is the entry point to using normalizers. A normalizer is created by sending a message to the class indicating the visual attribute to normalize. Available normalizers can be obtained as follows:
RSNormalizer color to normalize the color of the shape
RSNormalizer fontSize to normalize the font size (note that the specified shapes must be labels)
RSNormalizer height to normalize the height
RSNormalizer position to normalize the position of the shapes
RSNormalizer size to normalize the size of shape, as illustrated previously
RSNormalizer width to normalize the width
Shapes to be normalized have to be provided using shapes:. The range of the normalization can be specified using to: and from:. These two methods accept a value that depends on the accepted values for the attribute to normalize; it accepts numbers, points, and color, depending on the usage.
In the previous example, the normalization is performed using normalize. This is a particular case in which the shapes to be normalized have a number as a model. You can use normalize: instead of providing a block that transforms a model object into the value to normalize, as illustrated next.
You can try the different normalizers by simply replacing RSNormalizer size in the previous with by one of the normalizers given here.
Combining Normalization
Several normalizers can be applied to the same shapes. Consider the following example, which gives a visual representation of five translations of “hello” (see Figure 10-4):
RSHorizontalLineLayout new gapSize: 10; alignMiddle; on: shapes.
canvas zoomToFit.
canvas open
Figure 10-4
Multiple normalizations
Each translation is represented as a box. The height, width, and color of each box is particular to the represented word. The height indicates the number of vowel characters, the width is the number of consonant characters, and the color indicates the number of characters in the translation.
Normalizing Shape Position
Points describing the position of some shapes can be normalized. Consider the following example (see Figure 10-5):
canvas add: (RSArrowedLine new from: 0 @ 0; to: 0 @ -500).
canvas add: (RSArrowedLine new from: 0 @ 0; to: 500 @ 0).
canvas zoomToFit.
canvas open
Figure 10-5
Normalizing the position of shapes
The script simulates a scatterplot by normalizing some shapes based on some metrics. Each circle is a class. The number of methods is mapped to the x-axis and the number of lines of code is mapped to the y-axis, the size of the circle, and the color. A class with many lines of code appears as a large brown circle. A class with relatively few lines of code is represented as a small yellow circle. The bloc provided to the RSNormalizer position normalizer returns a position and it is used to locate each class in the scatterplot.
Line Width
The width of the line can also be normalized by simply using RSNormalizer width and providing lines to the normalizer. Consider the following example (see Figure 10-6):
(association key selectors intersection: association value selectors) size ].
RSTreeLayout on: shapes.
canvas @ RSCanvasController.
canvas open
Figure 10-6
Normalizing line width
The example visualizes the collection class hierarchy. Each class is represented as a circle. The number of methods defined in the class is visually represented by both the size of the circle and its color, which ranges from translucent gray to translucent red. The translucence is set using the alpha: method, which expects a float number ranging from 0 to 1 to indicate the degree of opacity (values lower than 1 make the shape translucent).
Lines are defined using a line builder, and each line connects a superclass of a class to that class. The lines can be accessed using the canvas lines expression, which simply returns a group of lines.
The line width is normalized using RSNormalizer width on the lines. The normalization is performed using a one-argument bloc. The model of a line is an association having:
The model of the starting shape as the key
The model of the ending shape as the value
The line width indicates the number of similar method names between the superclass and its subclass. A thick line indicates that many methods of the superclass are directly redefined (i.e., overridden) in the subclass. This examples illustrates how to map an arbitrary metric to line thickness.
Scaling
A normalizer uses a scale object to map values from one scale to another. Many scales are available and the NSScale class is the root of a class hierarchy. As this section illustrates, it can be beneficial to directly employ scales.
Consider the following example:
s := NSScale linear.
s range: { 5 . 10 }.
s scale: 0. "=> 5"
s scale: 0.5. "=> 7.5"
s scale: 1. "=> 10"
The scale: method takes an object as an argument—a number in this example. The value provided to range: is an array of two or more values to which the domain is mapped. The domain used in this example is the default one, which is #(0 1). This can be verified by evaluating NSScale linear domain, which returns #(0 1).
Consider the following scale that simply maps the domain value [−10, −5] to the values ranging from 10 to 5:
s := NSScale linear.
s domain: { -10 . -5 }.
s range: { 10 . 5 }.
s scale: -5. "=> 5"
s scale: -7.5. "=> 7.5"
s scale: -10. "=> 10"
Numerical values can also be mapped to colors. Consider this example:
s := NSScale linear.
s range: { Color white . Color black }.
s scale: 0.5 "=> Color gray"
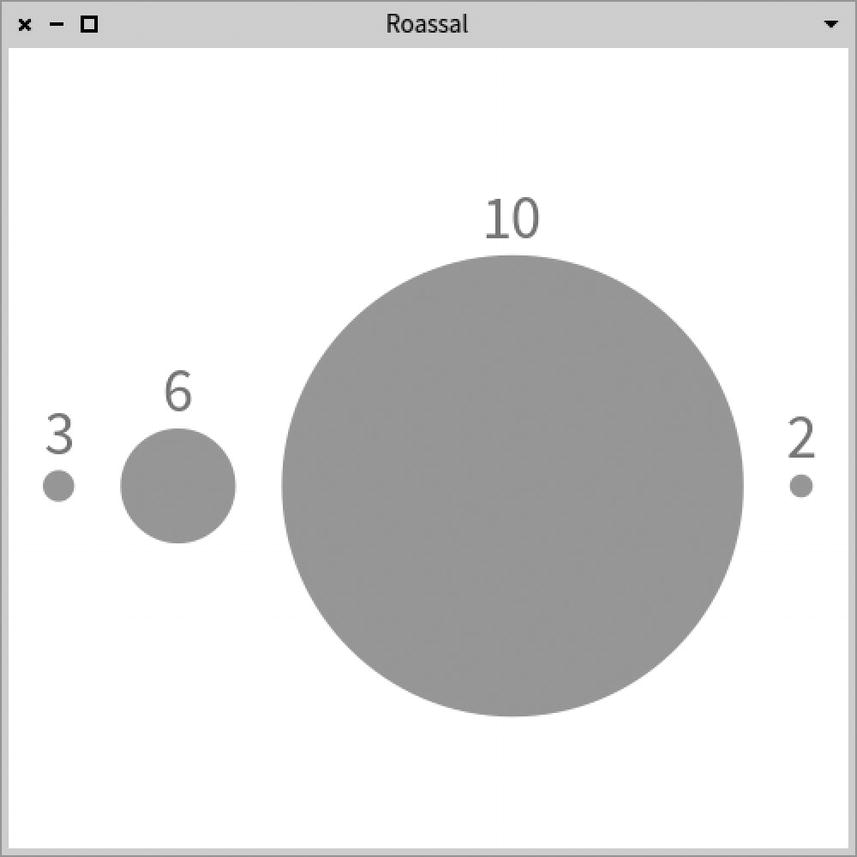
A larger example illustrates color mapping (see Figure 10-7):
values := 0 to: 1 by: 0.1.
scale := NSScale linear range: { Color blue . Color red }.
The color is obtained with the scale scale: number expression, which returns a color ranging from blue to red. As you can see, the example manually simulates a normalizer. One advantage that scales have over normalizers is when considering multiple values for the domain and range. For example, consider a variation of the previous example (see Figure 10-8):
The scaling can be carried out over multiple values
The example maps numerical values to a collection of three colors—blue, gray, and red. Since the domain is specified as { 0 . 0.5 . 1 }, blue represents 0, gray represents 0.5, and red represents 1. Note that the value of gray does not have to be 0.5 (the middle between 0 and 1, the two extremities of the domain).
Multiple scales can be used on the same shapes (see Figure 10-9):
sc := NSScale linear
range: { #white . #gray . #red };
domain: { 0 . 1 . 2}.
ss := NSScale linear
range: { 80 . 30 . 80 };
domain: { 0 . 1 . 2}.
c := RSCanvas new.
0 to: 2 by: 0.1 do: [ :i |
s := RSBox new width: 30; height: (ss scale: i); model: i; color: (sc scale: i).
c add: s ].
RSHorizontalLineLayout new alignMiddle; on: c shapes.
c zoomToFit.
c open
Figure 10-9
Colors and height are mapped through multiple range values
Roassal supports ordinal scaling, which is useful for assigning a color to a particular object (instead of a numerical value, as you have just seen). Consider the following example (see Figure 10-10):
g add: (RSBox new width: 100; height: 20; model: txt; color: (scale scale: txt)).
g add: (RSLabel new text: txt).
c add: g asShape ].
RSGridLayout new lineItemsCount: 3; on: c shapes.
c @ RSCanvasController.
c open
Figure 10-10
Ordinal scaling
The NSScale ordinalColored: 3 expression creates an ordinal scale with three different colors. The colors scale: txt expression returns one of the three colors assigned to the object txt. A color can be used for more than one object when there are more objects provided to scale: than the number of colors provided to ordinalColored:. The ordinalColored: method creates a random palette of a particular size.
Several color palettes are provided on the class side of NSScale. Consider the following example (see Figure 10-11):
canvas := RSCanvas new.
scale := NSScale category20c.
r := Random seed: 42.
81 timesRepeat: [
aNumber := r nextInt: 10.
circle := RSCircle new size: 30; color: (scale scale: aNumber).
label := RSLabel new color: Color black; text: aNumber.
composite := { circle . label } asGroup asShapeFor: aNumber.
canvas add: composite ].
RSGridLayout new lineItemsCount: 9; on: canvas nodes.
canvas @ RSCanvasController.
canvas open
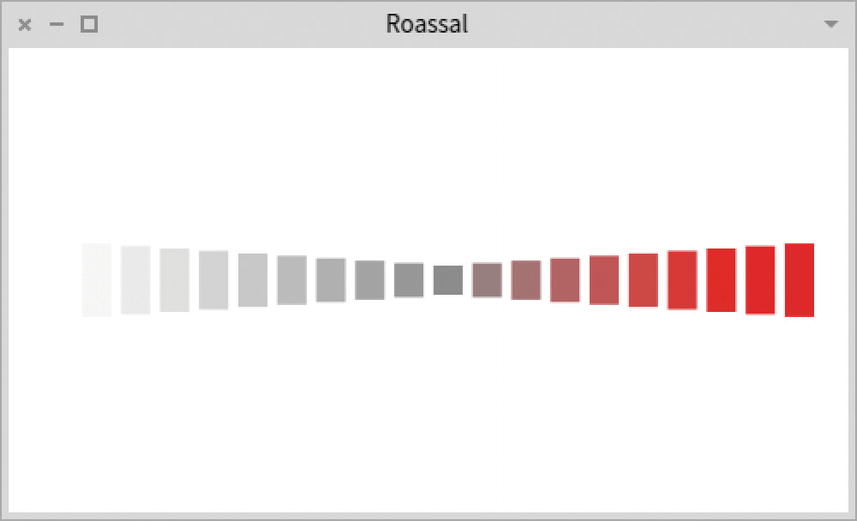
Figure 10-11
Using the category20c palette
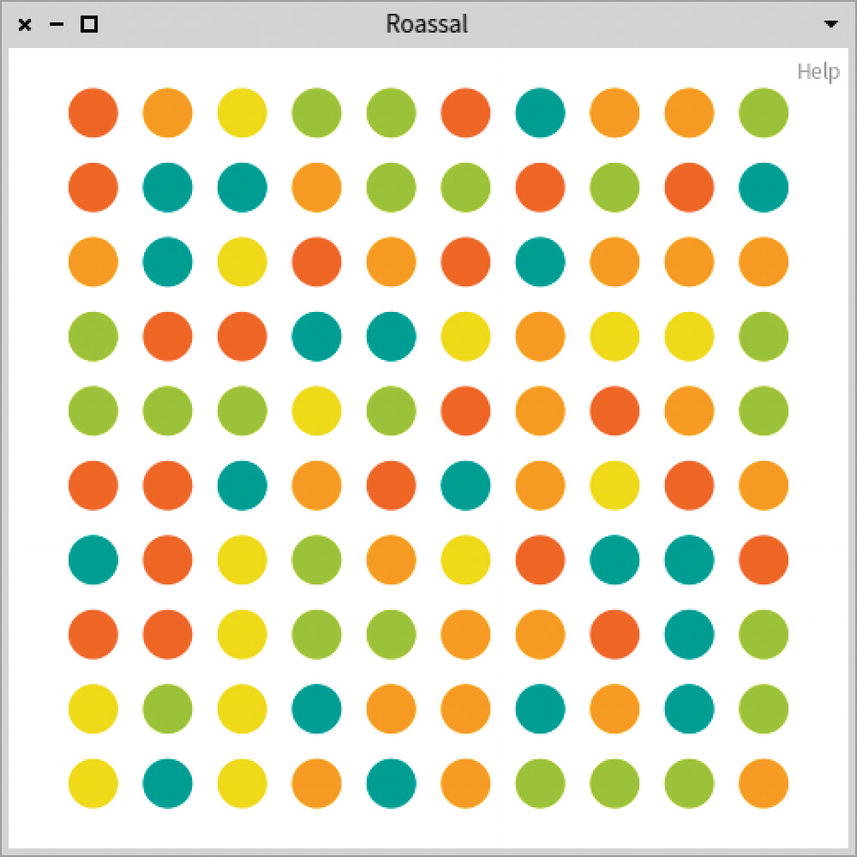
The script associates a number to a particular color. Two circles representing the same number have the same color. In addition to using the predefined palettes of Roassal, you can manually build a color palette and provide it directly using range:. Consider this example (see Figure 10-12):
collect: [ :hexString | Color fromHexString: hexString ].
scale := NSScale ordinal range: palette.
r := Random seed: 42.
100 timesRepeat: [
aNumber := r nextInt: 5.
circle := RSCircle new model: aNumber.
circle @ RSPopup.
circle color: (scale scale: aNumber).
canvas add: circle ].
RSFlowLayout on: canvas nodes.
canvas @ RSCanvasController.
canvas open
Figure 10-12
Using a manually defined palette
A hexadecimal color description is converted to a color using the Color fromHexString: hexString expression. The color palette used in the previous example is called “Summer Stripes Color Palette” and it was obtained from http://www.color-hex.com.
What Have You Learned in This Chapter?
This chapter covered the use of normalizers and scales, which are a necessary component to map numerical values to visual attributes. The chapters covered:
The normalization mechanism of visual attributes, in particular the size, line width, color, and position of shapes