Roassal offers a number of layouts to locate shapes in the two-dimensional space provided by the canvas. Layouts have been extensively used in the previous chapters without describing how they operate and how they are configured. This chapter lists the different layouts supported by Roassal and details the layout framework.
This chapter covers the following layouts: circle, grid, flow, rectangle pack, and line. It lists layouts that are edge-driven, i.e., lines connecting to shapes as a way to structure the layout. Edge-driven layouts are tree and forces. The bridge with Graphviz is also presented.
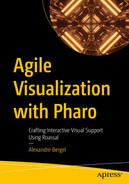
The example locates five shapes as a circle. The circle layout can be configured in many different ways. In particular:
The initial angle used by the layout can be set using initialAngleInDegree:.
The radius can be set using radius:, a method that takes a number of pixels as the circle radius.
The RSCircleLayout circle layout is adequate when all the shapes have roughly the same size. Overlap is likely to happen when there are significant disparities in the shapes’ sizes. Consider the following script (see Figure 12-2):
nodes := (1 to: 20) asArray shuffleBy: (Random seed: 42).
canvas := RSCanvas new.
shapes := RSCircle models: nodes.
canvas addAll: shapes.
RSNormalizer size
shapes: shapes;
normalize.
RSCircleLayout on: shapes.
canvas @ RSCanvasController.
canvas open
Figure 12-2
Overlapping shapes using a circle layout
The circle layout locates shapes based on their center along a circle. The angle between shapes from the circle center is constant, and because of this, overlap may happen. To avoid overlapping shapes, a variant of RSCircleLayout is proposed, called RSEquidistantCircleLayout.
The RSEquidistantCircleLayout class ensures there is a constant space between circles. Consider the following code (see Figure 12-3):
nodes := (1 to: 20) asArray shuffleBy: (Random seed: 42).
canvas := RSCanvas new.
shapes := RSCircle models: nodes.
canvas addAll: shapes.
RSNormalizer size
shapes: shapes;
normalize.
RSEquidistantCircleLayout on: shapes.
canvas @ RSCanvasController.
canvas open
Figure 12-3
Using the equidistant circle layout
The equidistant circle layout tries to avoid overlapping shapes.
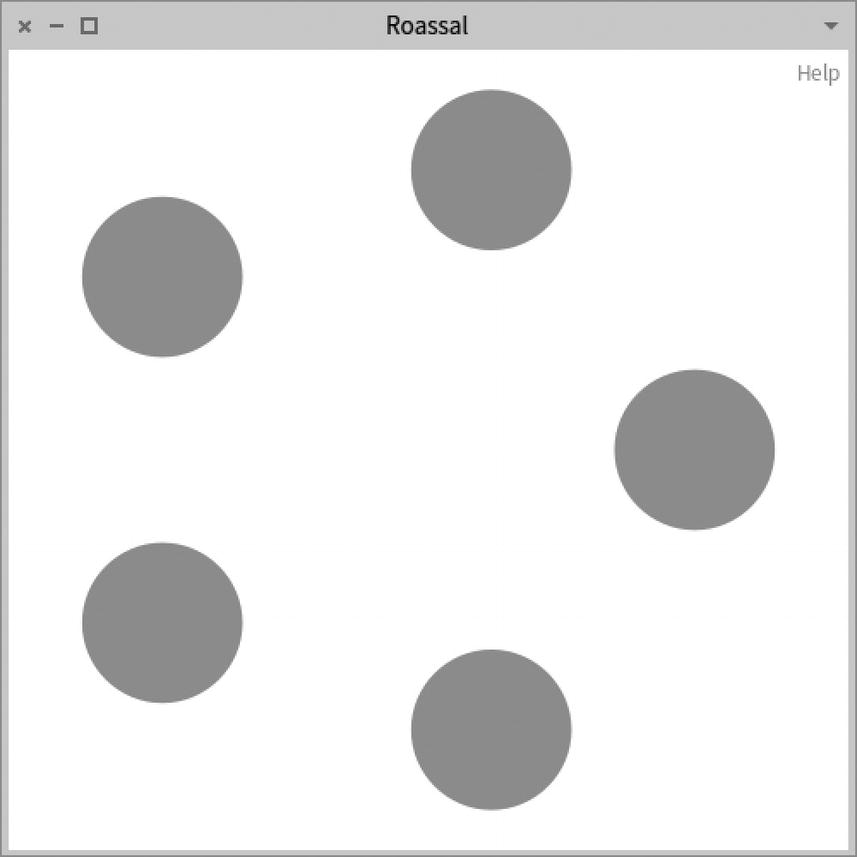
Grid Layout
Shapes can be located as a grid using RSGridLayout. Consider the following example (see Figure 12-4):
nodes := (1 to: 20) asArray shuffleBy: (Random seed: 42).
canvas := RSCanvas new.
shapes := RSCircle models: nodes.
canvas addAll: shapes.
RSNormalizer size
shapes: shapes;
normalize.
RSGridLayout on: shapes.
canvas @ RSCanvasController.
canvas open
Figure 12-4
Grid layout
Each row of shapes has the same number of shapes, which is determined to have an overall horizontal rectangular layout (i.e., the width is larger than the height). The overall layout is determined using the golden ratio. This golden ratio is said to provide “pleasing, harmonious proportions” (https://en.wikipedia.org/wiki/Golden_ratio).
You can override the number of shapes per line by using lineItemsCount:, as in:
nodes := (1 to: 20) asArray shuffleBy: (Random seed: 42).
canvas := RSCanvas new.
shapes := RSCircle models: nodes.
canvas addAll: shapes.
RSNormalizer size
shapes: shapes;
normalize.
RSGridLayout new lineItemsCount: 9; on: shapes.
canvas @ RSCanvasController.
canvas open
Specifying an arbitrary number of shapes overrides the golden ratio proportion. The previous example forces the layout to locate nine shapes per row.
Flow Layout
The flow layout, implemented with RSFlowLayout, tries to fill a provided space, without reordering the shapes. Consider the following example (see Figure 12-5):
nodes := (1 to: 20) asArray shuffleBy: (Random seed: 42).
canvas := RSCanvas new.
shapes := RSCircle models: nodes.
canvas addAll: shapes.
RSNormalizer size
shapes: shapes;
normalize.
RSFlowLayout on: shapes.
canvas zoomToFit.
canvas open
Figure 12-5
Using the flow layout
The RSFlowLayout class fills a given area with a constraint set on the width, using the sequence of the provided shape. A nice use of this layout is to set a callback on the canvas to automatically redo the positioning of the shapes. Consider this example:
nodes := (1 to: 20) asArray shuffleBy: (Random seed: 42).
canvas := RSCanvas new.
shapes := RSCircle models: nodes.
canvas addAll: shapes.
RSNormalizer size
shapes: shapes;
normalize.
canvas when: RSExtentChangedEvent do: [ :event |
RSFlowLayout new
maxWidth: event newExtent x;
on: shapes.
canvas zoomToFit.
].
canvas open
The layout is performed each time the window is resized. The width size used by the layout is set using maxWidth:. This feature can be handy when vertical scrolling is preferred over horizontal scrolling.
Rectangle Pack Layout
The rectangle pack layout, implemented with the RSRectanglePackLayout class, fills a space along its two dimensions, without preserving the initial order of the shape. Consider this example (see Figure 12-6):
nodes := (1 to: 20) asArray shuffleBy: (Random seed: 42).
canvas := RSCanvas new.
shapes := RSCircle models: nodes.
canvas addAll: shapes.
RSNormalizer size
shapes: shapes;
normalize.
RSRectanglePackLayout on: shapes.
canvas zoomToFit.
canvas open
Figure 12-6
Using the rectangle pack layout
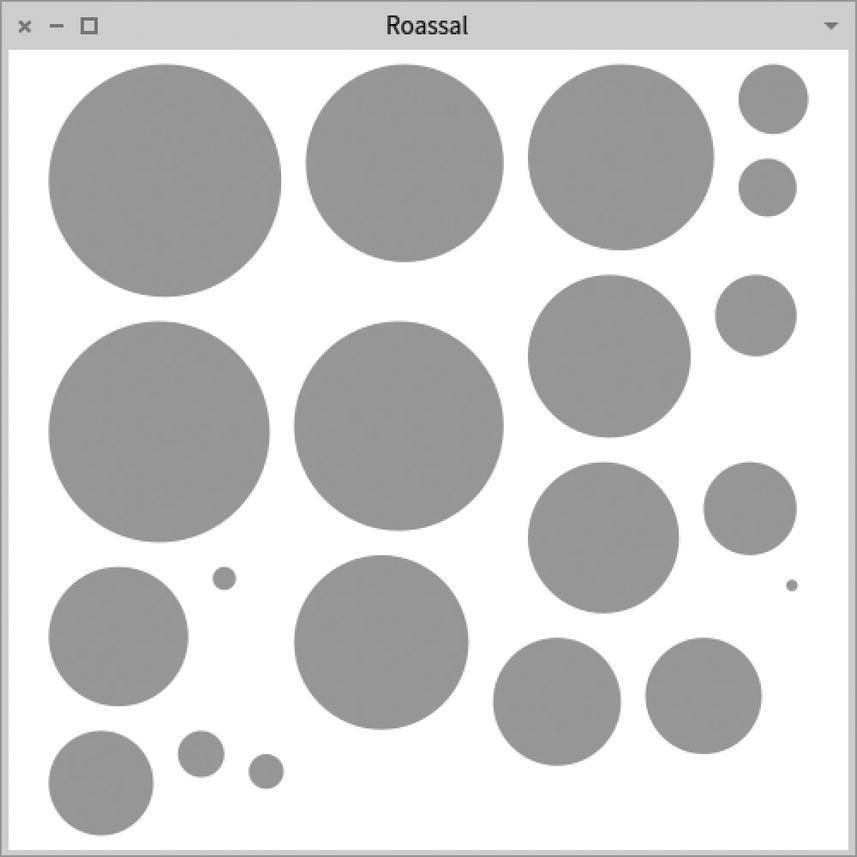
A larger example using the rectangle pack layout could be as follows (see Figure 12-7):
The algorithm used by the layout tries to maximize the occupation of a bounding box. Note that the rectangle pack layout does not preserve the order of the provided shapes.
Line Layout
The RSHorizontalLineLayout and RSVerticalLineLayout classes implement line layouts. Such a layout simply consists of lining up shapes, either horizontally or vertically. Consider this example (see Figure 12-8):
nodes := (1 to: 20) asArray shuffleBy: (Random seed: 42).
canvas := RSCanvas new.
shapes := RSCircle models: nodes.
canvas addAll: shapes.
RSNormalizer size
shapes: shapes;
normalize.
RSHorizontalLineLayout on: shapes.
canvas zoomToFit.
canvas open
Figure 12-8
Horizontal line layout
The line layout is particularly useful when composing shapes. Consider the following example (see Figure 12-9):
canvas := RSCanvas new.
1 to: 10 do: [ :nb |
group := RSGroup new.
group add: (RSLabel text: nb).
nb timesRepeat: [ group add: (RSCircle new) ].
RSHorizontalLineLayout new alignMiddle; on: group.
canvas add: group asShape.
].
RSVerticalLineLayout on: canvas nodes.
canvas zoomToFit.
canvas open
Figure 12-9
Line layout used with composite shapes
The example uses the two line layouts. RSHorizontalLineLayout is used to horizontally line up the labels with the little circles. RSVerticalLineLayout is used to vertically locate the composite shapes.
These two line layouts offer handy methods to control the alignment of the shapes:
RSHorizontalLineLayout provides alignBottom, alignMiddle, and alignTop. In addition, the alignment alignLabel is used to align labels along their baselines.
RSVerticalLineLayout provides alignCenter, alignLeft, and alignRight.
Consider a slight modification of the previous script (see Figure 12-10):
canvas := RSCanvas new.
1 to: 10 do: [ :nb |
group := RSGroup new.
group add: (RSLabel text: nb).
nb timesRepeat: [ group add: (RSCircle new) ].
RSHorizontalLineLayout new alignMiddle; on: group.
canvas add: group asShape.
].
RSVerticalLineLayout new alignRight; on: canvas nodes.
canvas zoomToFit.
canvas open
Figure 12-10
Use of alignment with line layouts
The alignRight class used with the vertical line layout locates all the composite shapes on the right side.
Tree Layout
The layouts presented previously locate shapes without considering connections with other shapes. A number of line-driven layouts take connections into account to locate shapes. Line-driven layouts are modeled with subclasses of RSLineDrivenLayout.
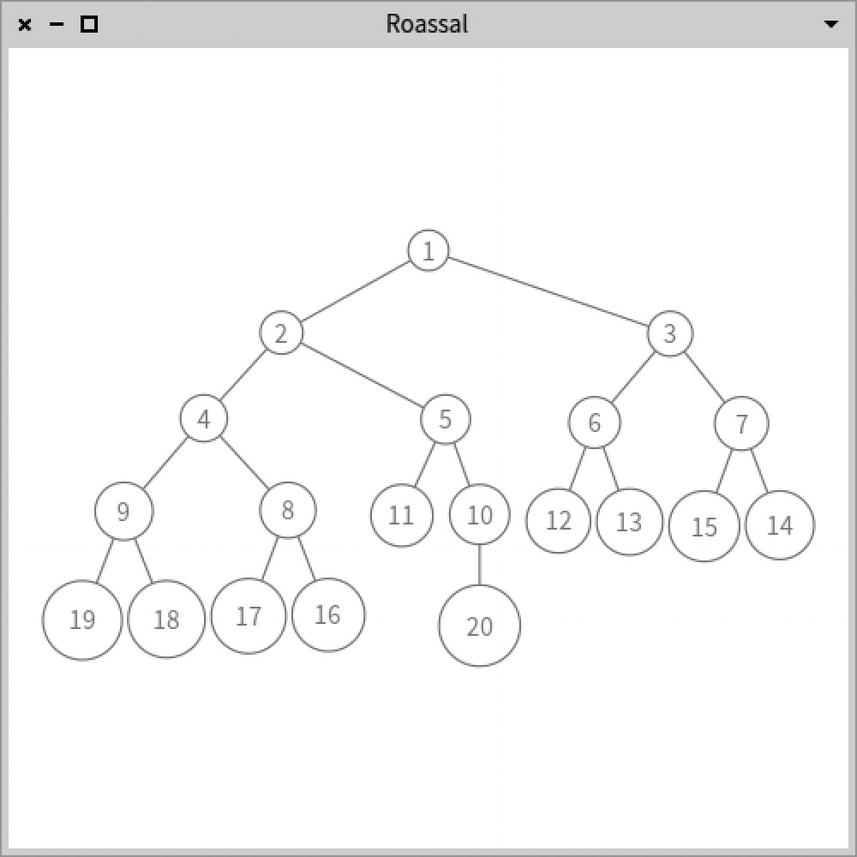
The tree layout is a classical layout that renders a structure of the shapes as a tree. Consider this example (see Figure 12-11):
nodes := (1 to: 20) asArray shuffleBy: (Random seed: 42).
canvas := RSCanvas new.
shapes := RSCircle models: nodes.
shapes withBorder.
shapes color: Color white.
shapes @ RSLabeled middle.
shapes @ RSDraggable.
canvas addAll: shapes.
RSNormalizer size
shapes: shapes;
from: 20; to: 40;
normalize.
RSLineBuilder line
withBorderAttachPoint;
shapes: shapes;
connectFrom: [ :nb | nb // 2 ].
RSTreeLayout on: shapes.
canvas zoomToFit.
canvas open
Figure 12-11
Tree layout
This code defines 20 circle shapes, each having a particular size and each connected to other shapes. Note that the tree layout assumes that there is no cycle between the shapes and the connections.
Another example with a less regular structure is a class hierarchy (see Figure 12-12):
classes := Collection withAllSubclasses.
canvas := RSCanvas new.
shapes := RSCircle models: classes.
canvas addAll: shapes.
RSLineBuilder line
shapes: shapes;
connectFrom: #superclass.
RSTreeLayout on: shapes.
canvas zoomToFit.
canvas open
Figure 12-12
Tree layout on a class hierarchy
Force-Based Layout
The force-based layout (also commonly called the spring layout) is an algorithm in which nodes represent repulsing magnets and edges attracting springs. The layout uses a physical engine that often produces visually appealing results.
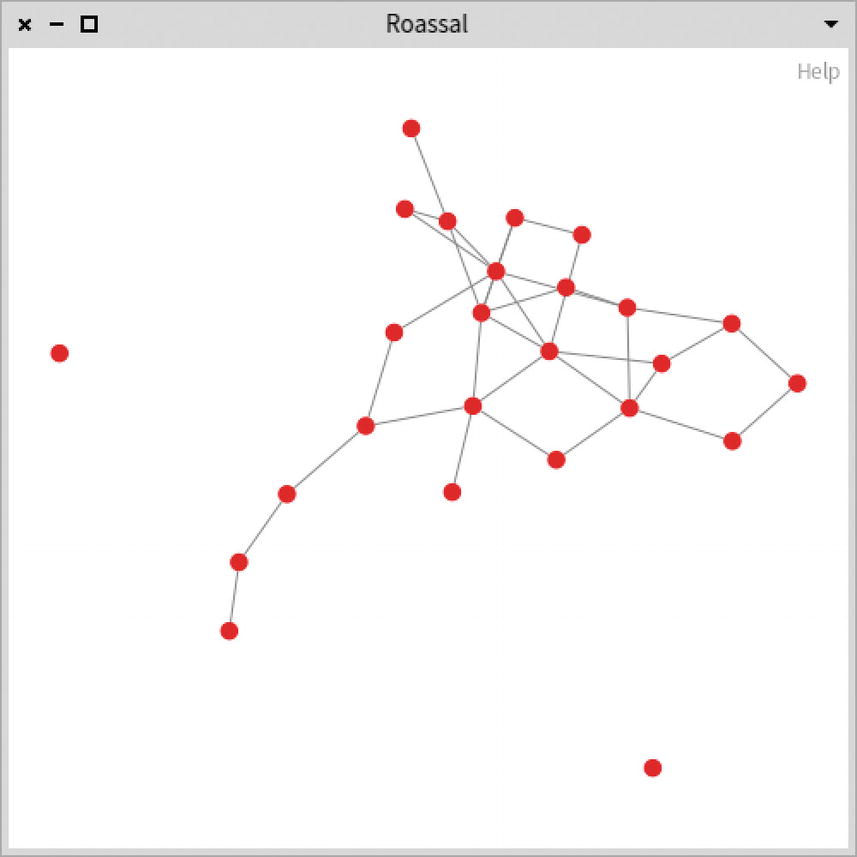
Consider the following example (see Figure 12-13):
The script builds and visualizes a graph made of 50 nodes and 20 edges. As Figure 12-14 illustrates, the graph is sparsely connected, as it contains many more nodes than edges. An easy way to order this visualization is to move all non-connected nodes to one side. Some conditions can be set on a structure to reflect particular decisions that ultimately aim at improving the effectiveness of the graph. Consider the following improvement (see Figure 12-15):
A grid layout is applied to unconnected nodes while connected nodes use a force-based layout
The RSConditionalLayout class is a conditional layout. The class defines a method called if: that accepts a one-argument block evaluated on each node. The layout provided to then: is applied to the nodes that meet the condition. The layout provided to else: is applied to the nodes that do not meet the condition. Utility methods are provided to ease the writing. In particular:
ifConnectedThen: aLayout applies aLayout to the nodes that are connected.
ifNotConnectedThen: aLayout applies aLayout to the nodes that are not connected.
The previous example applies a grid layout to the orphan nodes, while a force layout is applied to the connected ones. However, each cluster can be separately handled to reduce spaces between connected nodes. For example (see Figure 12-16):
forEachLayout: (RSForceBasedLayout new charge: -300));
on: nodes.
canvas @ RSCanvasController.
canvas open
Figure 12-16
Combining conditional and clustering layouts
The RSClusteringLayout class is a layout that identifies clusters of connected nodes and applies a layout to each group. In the previous example, the force layout is applied to each cluster and the flow layout is applied to all the clusters. Structuring a layout that way is convenient to reduce the amount of space taken by the graph.
Graphviz Layouts
Graphviz is an open source graph visualization library that is well supported by an international community. Roassal can use Graphviz in a transparent way to perform a graph layout. Graphviz is highly optimized and can perform a layout on a large graph (e.g., a couple thousands of nodes and edges).
Installing Graphviz
The first step to using Graphviz is to install it on your computer. Installing Graphviz is independent of Pharo. The official website of Graphviz is https://graphviz.org and the https://graphviz.org/download/ page provides instructions on how to install Graphviz on your favorite operating system. For Windows, the download page provides links to download the install packages.
On the Ubuntu distribution of Linux, the following instructions should install Graphviz when executed in a terminal:
sudo apt update
sudo apt install graphviz
On macOS, you can use brew from the command line:
brew install graphviz
If you do not have brew available on macOS, you can install it easily. The https://brew.sh website gives instructions on how to install brew.
At the time of writing this chapter, there is no distribution of Graphviz for an M1-based macOS machine (ARM). You can execute arch -x86_64 brew install graphviz, which should install the x86 version of Graphviz, if you have an M1 machine.
You can verify your installation of Graphviz by executing the following instruction in a terminal:
echo "digraph G {Hello->World}" | dot -Tpng > hello.png
This example should create a picture entitled hello.png that contains two connected nodes. If it does not, something went wrong with the installation. If the installation did not lead to an error, the usual suspect is making sure that the executable dot is accessible by setting the PATH shell variable. If the hello.png file cannot be created, the remaining of the chapter will not work.
Bridging Roassal and Graphviz
After installing Graphviz on your machine, you can install the Roassal/Graphviz bridge by executing the following instruction:
Graphviz offers numerous options to tune a layout. I recommend you explore these possibilities with the RSGraphVizExamples class.
What Have You Learned in This Chapter?
Applying a layout to a graph is an essential ability of Roassal. A number of layouts are provided to accommodate most of the common needs when visualizing data. In particular, the chapter detailed the following:
Discussed layouts that do not explore the graph structure (e.g., circle, grid, flow, rectangle pack, and line).
Discussed a number of line-driven layouts (e.g., tree and force).
Briefly outlined the ability of Roassal to use Graphviz as a layout.