
In this chapter, I would like to talk about some steps you can take to testing the security of your own app. In a larger organization or a more mature startup (if there is such a thing), the testing may usually be done by the information security team. But before we get started on the technical aspects of hacking an Android app, I want to take a moment to talk about the security testing process.
As is normal, in a startup, leadership roles rarely blend. They are distinct and have a purpose. Now while the goal of the startup may be to achieve tremendous growth in user base, or ultimately to IPO, it is the collective paths and efforts of all the employees toward that goal that will result in its successful attainment. Well, in theory at least; because for this to work smoothly, you have to assume that everyone has almost no ego, look out for the good of the company, and are more likely to pick the company goals as a higher priority. For this discussion, let’s assume that this is the case.
I bring up the leadership roles as being distinct and purposeful for a reason. Most times, because of the purposefulness of the role, it sometimes feels like other leaders are preventing you from doing your part as you strive toward the common goal. I will illustrate this with a very simple example.
The CTO has had his engineering team deliver a new set of features that affect the payment component of your app. Let’s assume that the feature allows you to now transfer money from your wallet to a friend’s wallet. We can all agree that many a startup has achieved greatness on that sole feature alone, so we know it’s a great feature. The CTO and his team are happy, and they talk about it with the CEO and he’s happy, and in general there is an air of pride, joy, and success. In the midst of this celebratory high fiving, the CISO walks into the room, pulls the CTO aside, and says, “I think we have a problem. My team found a flaw in the feature where many users can potentially lose a lot of money. We think that the solution for this would be to implement a few safety mechanisms prior to the user transferring the money. It is safer, and ultimately, we protect our users.”
What would your reaction be as the CTO? How would you characterize how the CISO felt? Taking a high-altitude look at this problem, and because I have set the tone of this example, it is easy to see that both the CTO and the CISO are keen to advance their team contributions toward furthering the company goal of becoming successful. The CTO just built out a stellar feature that would attract and retain many users onto the app platform. The CISO wants to ensure that the users trust and remain on the platform rather than realizing that the app is unsafe and could cause them or their friends to lose money.
How does this usually get resolved if neither the CTO nor the CISO is willing to compromise their position? Well usually, it gets escalated to the CEO, or better still it is put toward a vote among the leadership. This is where things get interesting. This is the point when you learn whether information security is a top-down mandate or whether growth at all costs is the mandate. In some cases, things may not be so binary, but decisions made at this moment in a startup’s life cycle are usually repeated unless a breach has occurred between such decisions. In cases like that, things become more interesting with either an overcorrection on information security or a slowdown in growth, but we won’t cover that situation here. Regardless of how this turns out, I wanted to point out the number of stakeholders involved in a situation like this. If you’re a CISO in this position, like how I was many times in the past, you would do well to consider the viewpoints of all other parties involved and work toward finding a solution. I think the one key thing a CISO has to learn even more than the technology part is the communications part. A CISO has to be masterful at communicating, persuading, educating, and harmonizing teams.
The situation I describe here assumes that no formal security testing process has been fixed nor communicated to all involved. This is usually the case because the status quo of a startup has most likely been to build and push forward and grow at all costs. It is worth diving into this part a little closely as it is an important discussion to have beyond just the technical parts of what a security team does.
For the rest of this chapter, let’s assume that we are part of that team that has to formally test apps before they go live. It’s your first day on the job, and you’re getting stuck into your testing environment. I will take you through some of the steps you may encounter in that role and discuss them in a little bit more detail. Going forward from here, let’s think that we have in our possession the app that we will be checking the security of. Let’s go on from there.
Feature Examination
The first thing you’re going to want to do is use the app and understand what its features are. Sometimes it might be difficult because it may be a closed system and require you to preregister or be part of the organization that releases the app, in which case you can move on to the next part of this section.
One of the things I do is to check how the app looks; after years of looking at apps, you develop a sense for whether an app is natively written on or one written in HTML5 or React Native. This is so that I can take a mental note of some of the things I want to check in the next stage. I then look for interesting areas within the app that I want to focus my efforts on. This could be a login or password entry screen, a shopping cart or purchase screen, or a screen that returns data to the user like a user profile screen. When we go deeper in other chapters, we will cover some of the differences between native and HTML5, but for now let’s leave that alone.
Getting the APK File
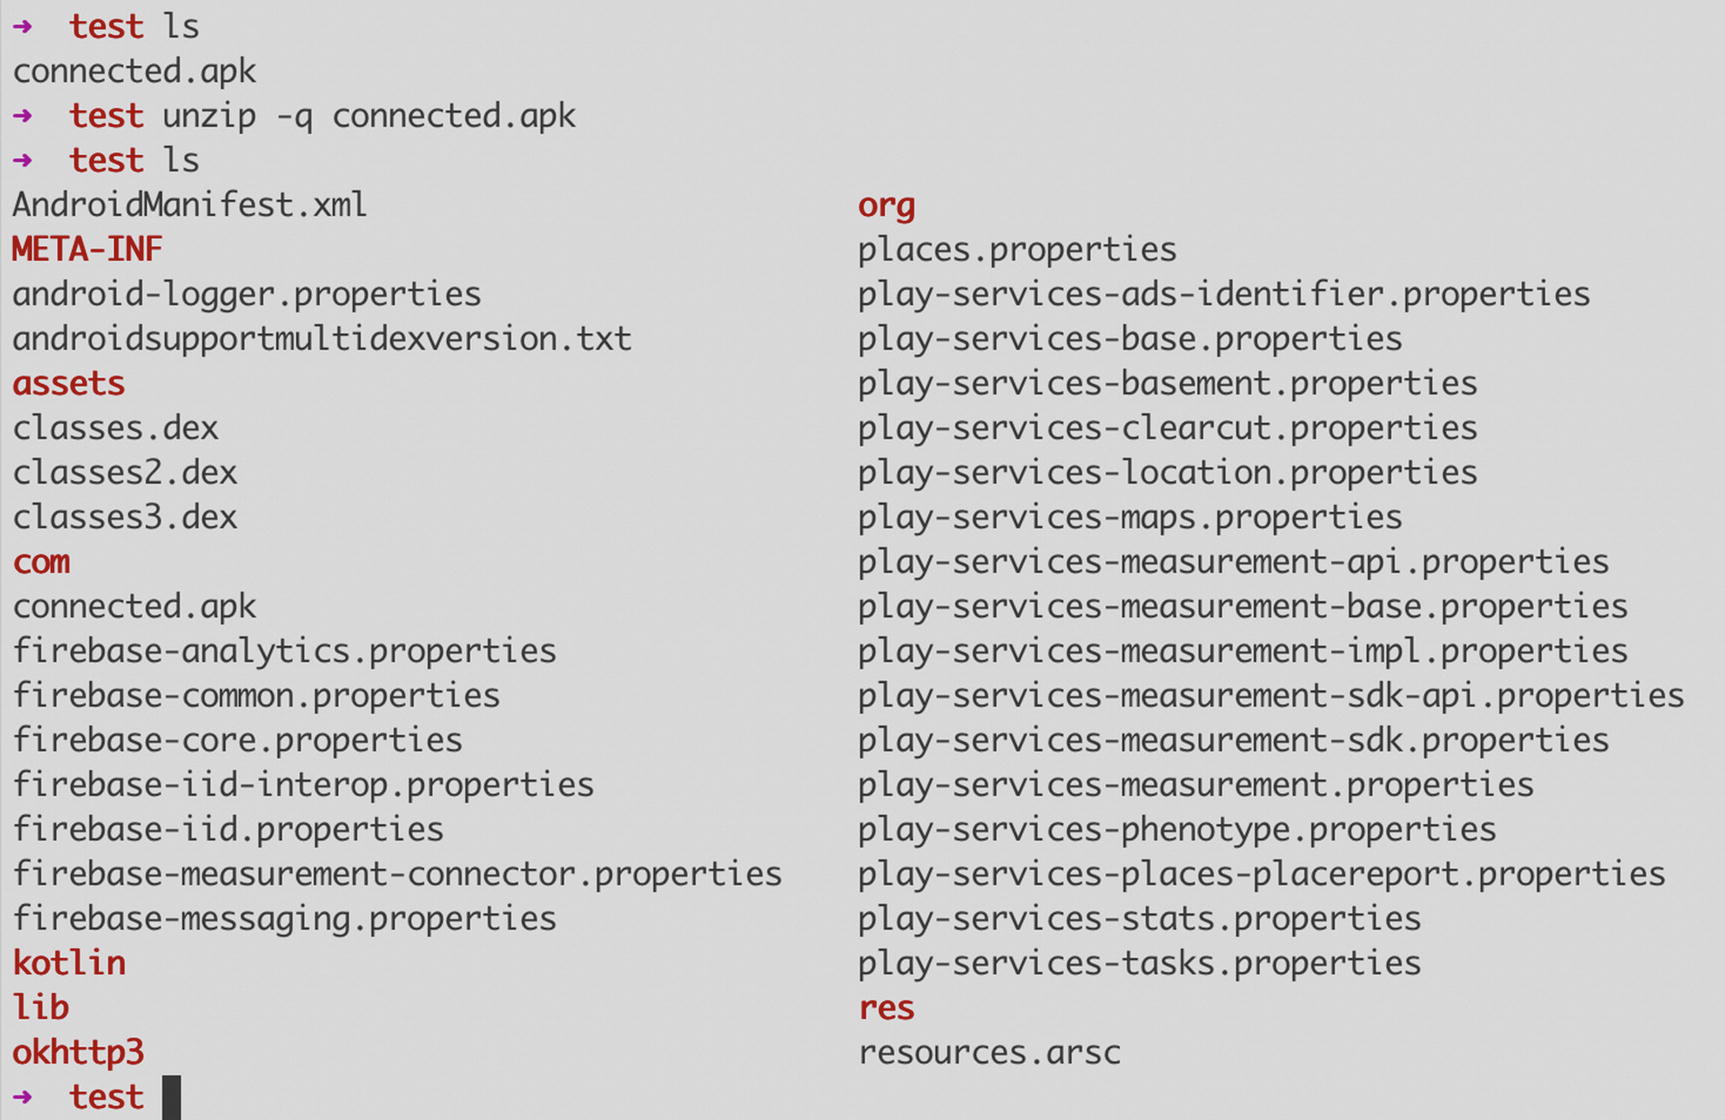
Running unzip on an APK file
Generally, if you want to poke around under the hood very superficially, you can use the unzip trick and see if there’s anything that catches your interest that you can further pursue. But we’re not here to mess about with random apps downloaded from the Play Store; we’re here to hack our own apps, remember? OK, let’s move on.
The Android Debug Bridge (adb)
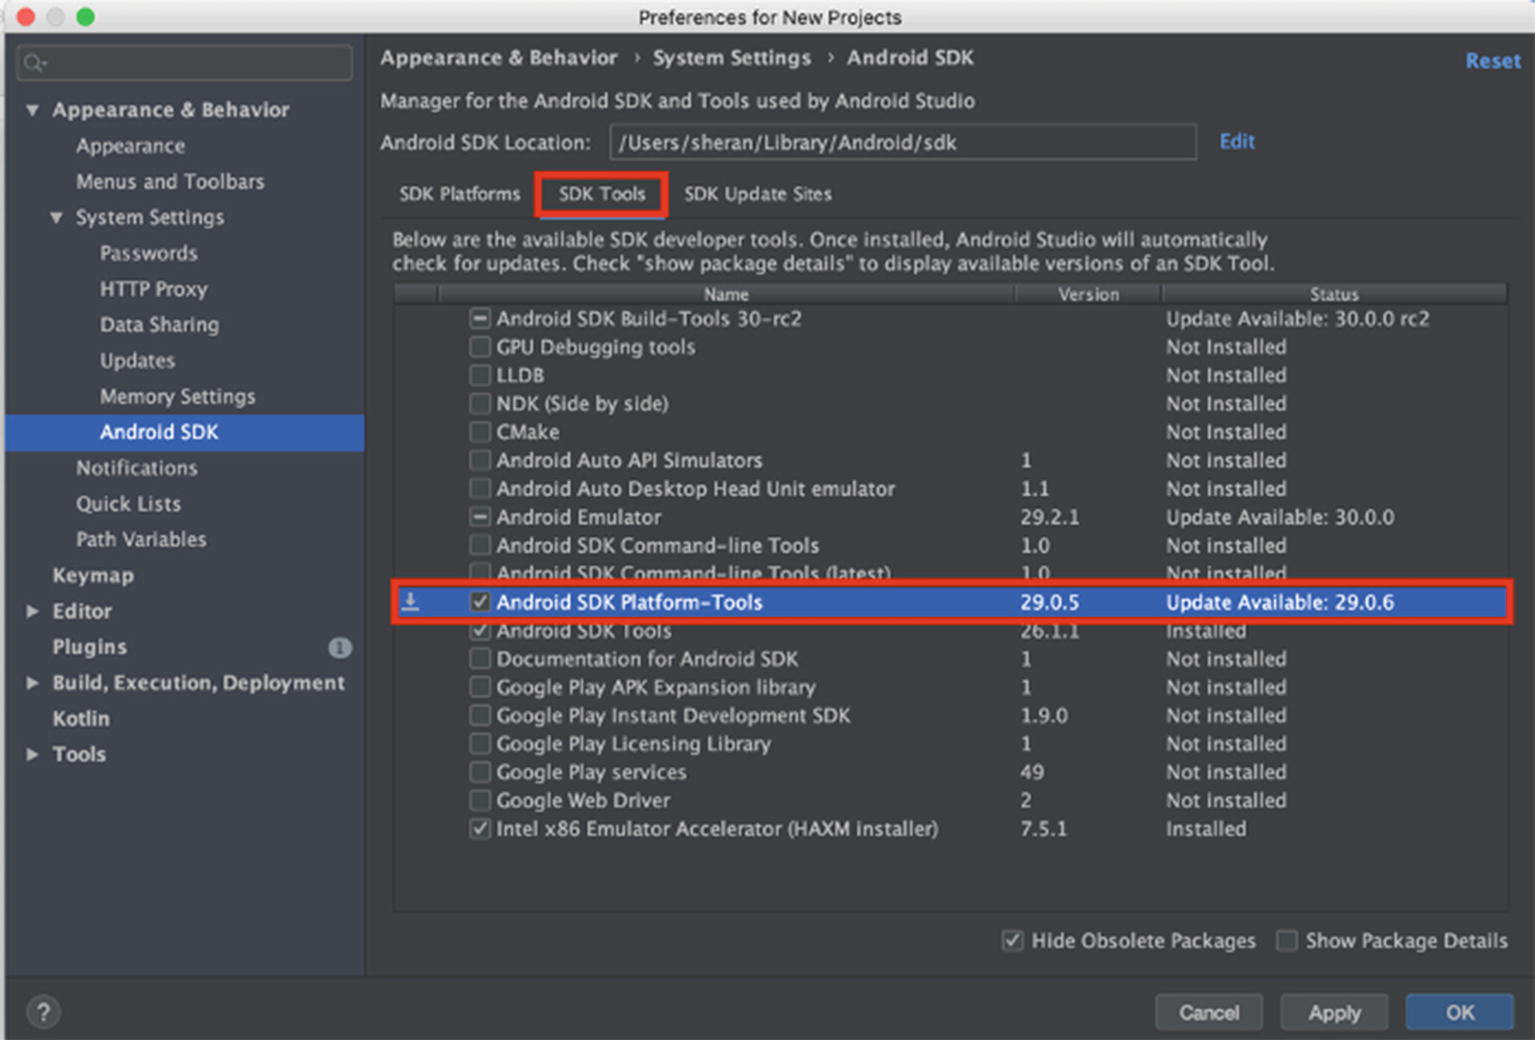
Installing Android SDK Platform-Tools on Android Studio
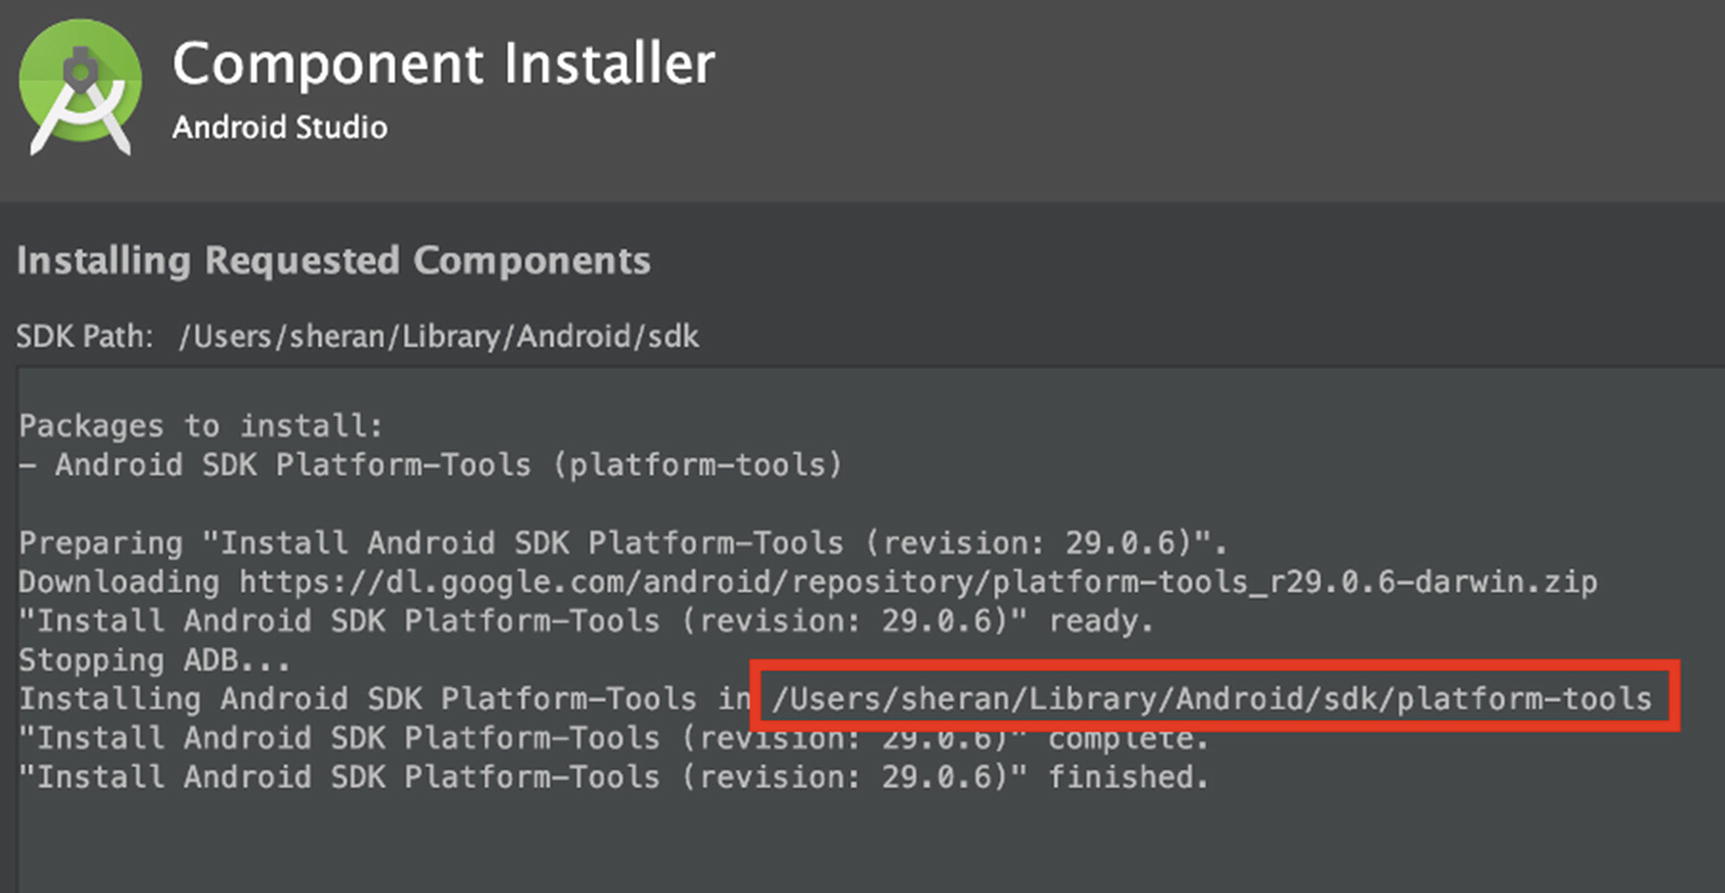
The platform tools installation progress and installation location
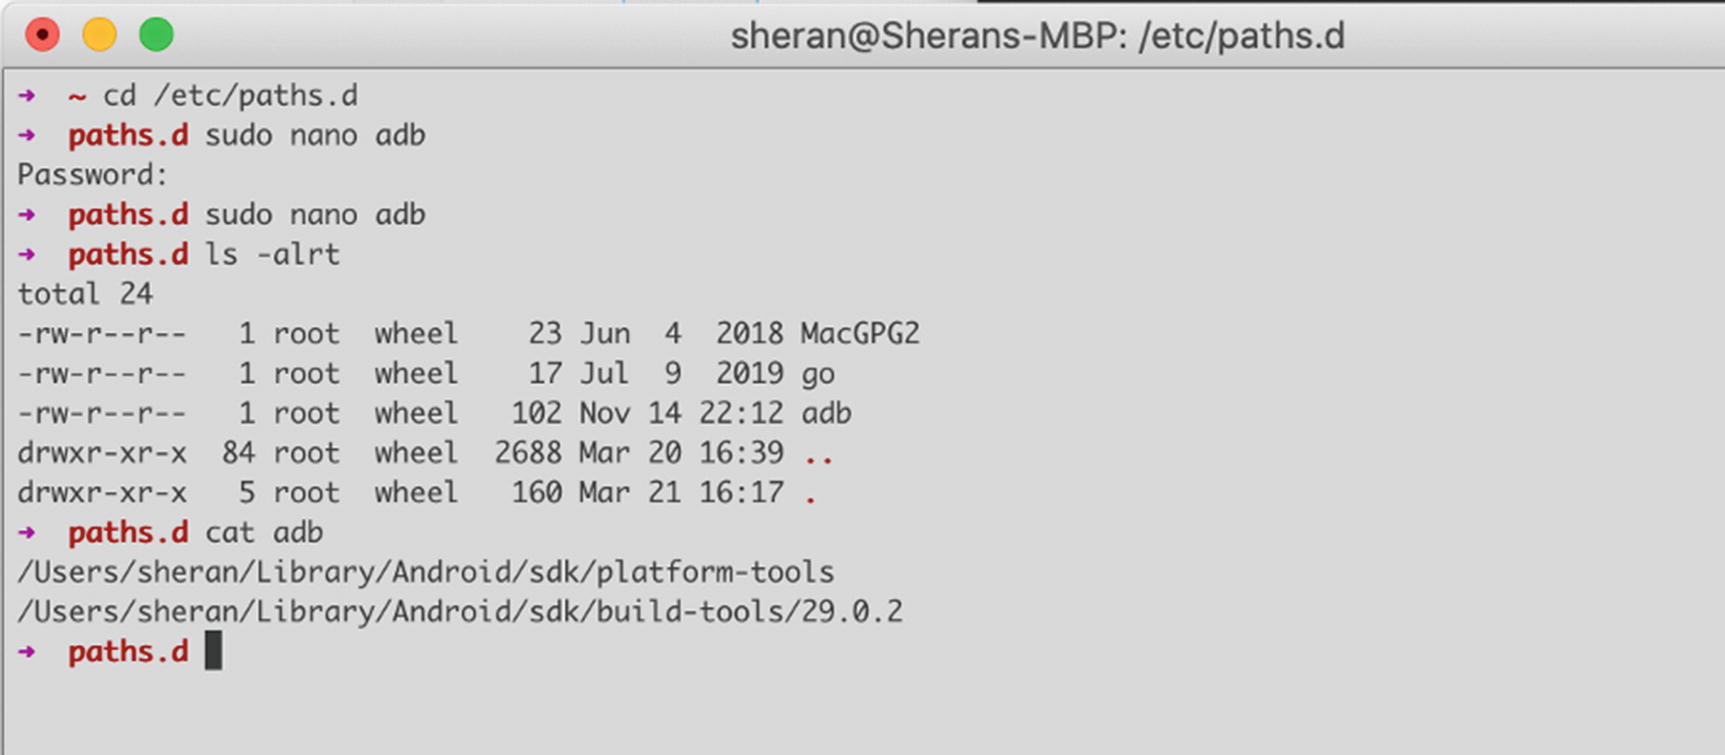
Creating the adb file to add the platform tools to the path
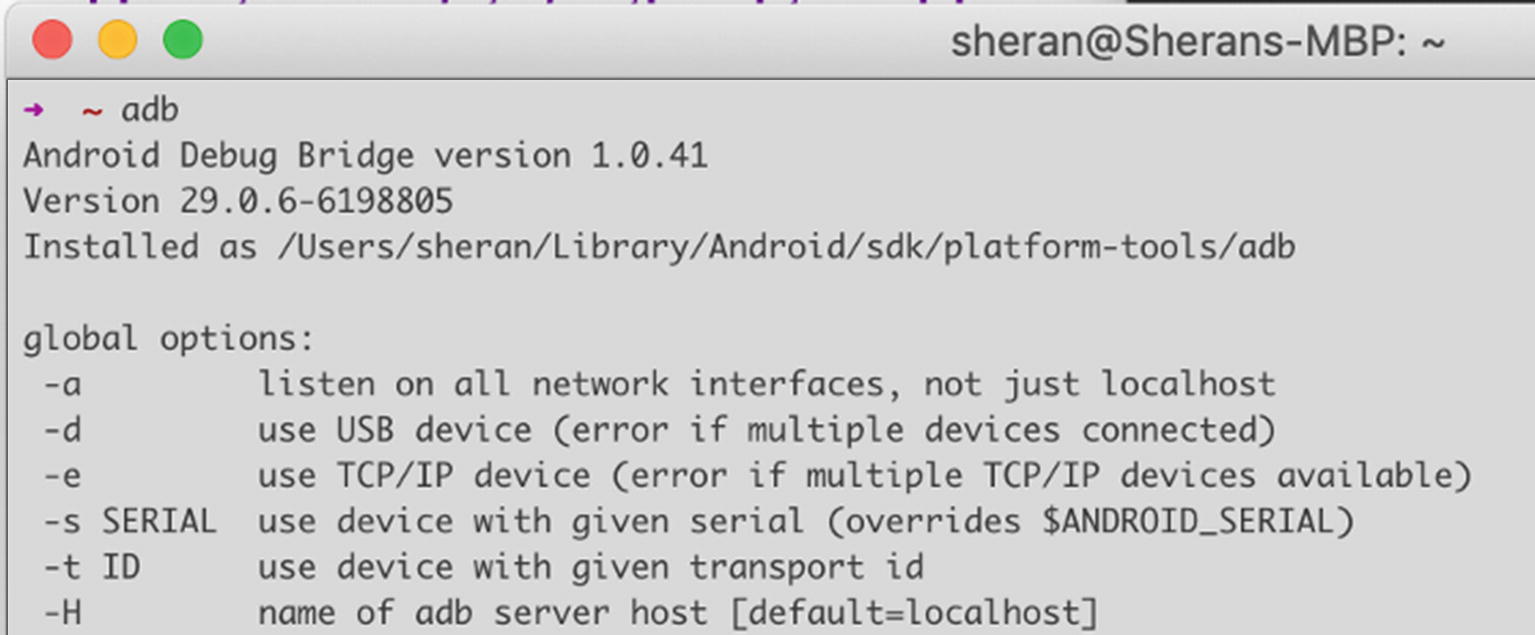
Output from adb when installed correctly
- 1.
The adb client: This is what you will always use when you want to install an app onto a device, copy an apk from a device to your workstation, or invoke a remote shell on a device. This runs on your workstation.
- 2.
The adb server: This part is always running on your workstation. In some cases, you may also have to start the server manually by entering adb start-server. The first time you invoke the adb command, you may see a message that says * daemon not running; starting now at tcp:5037. This is the adb server starting up on your workstation. Figure 5-6 shows the output of the lsof command showing a listening adb server.
- 3.
The adb daemon: This part runs on every Android device. Also running in the background, the adb device daemon is always running and ready to connect with a server and execute client commands as necessary.
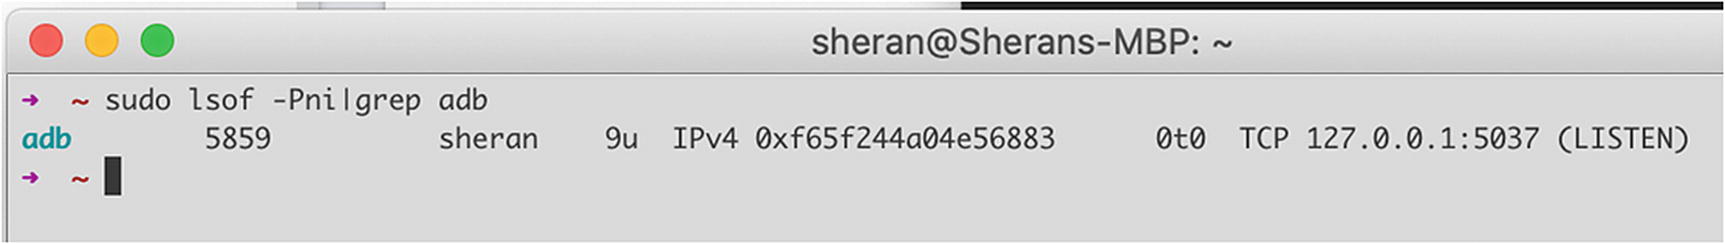
Output of the lsof command that shows a listening adb server

The three components of the adb framework
Developer Mode
You may be concerned that your Android device is always running around with a daemon or server listening for all manner of connections from either USB or the network, but it isn’t that simple. First, you have to put your phone into Developer Mode and then enable USB debugging. This is the stage when your phone will listen for commands coming from a remote adb server.
- 1.
Open your Android device’s Settings screen.
- 2.
Scroll down to About phone and click it.
- 3.
Locate the item that says Build number and keep tapping it until a little countdown tells you how many more taps of your finger are needed until you are a developer.
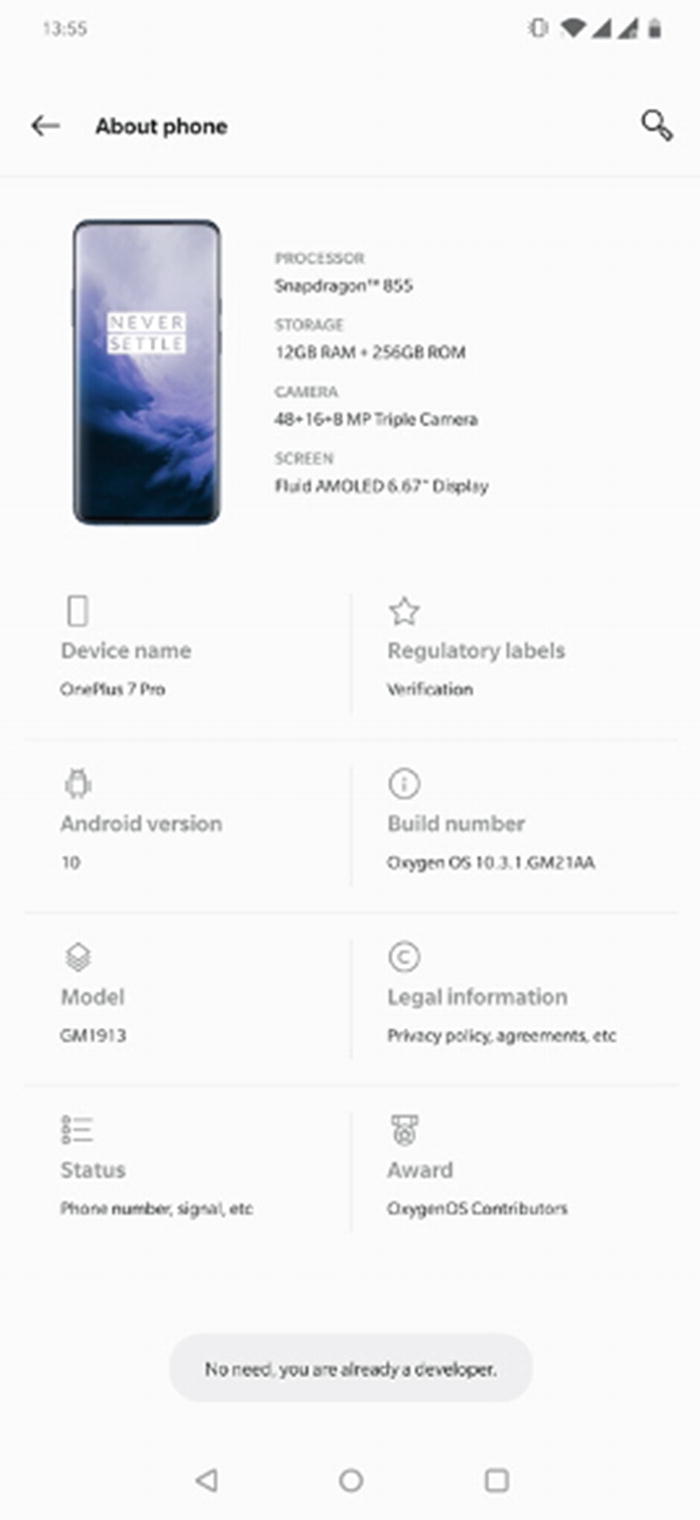
Becoming a developer on a OnePlus 7 Pro
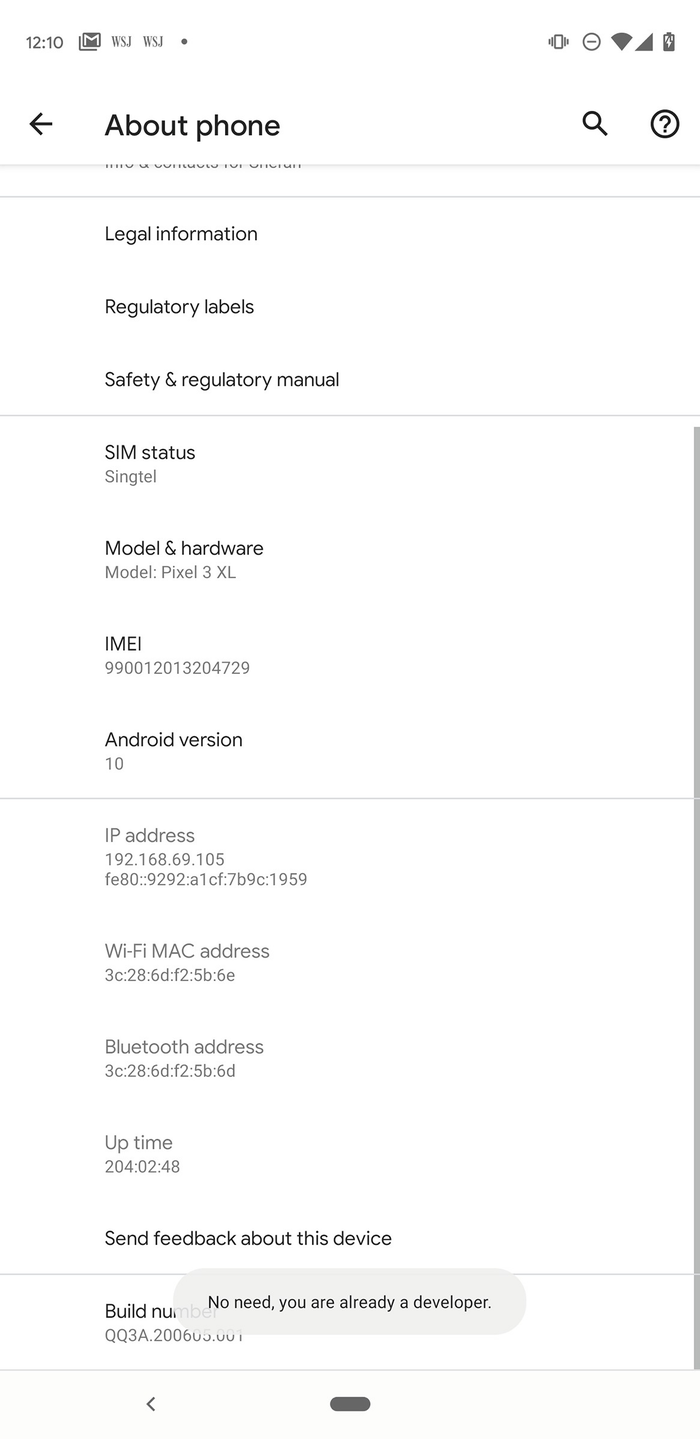
Becoming a developer on a Google Pixel 3 XL
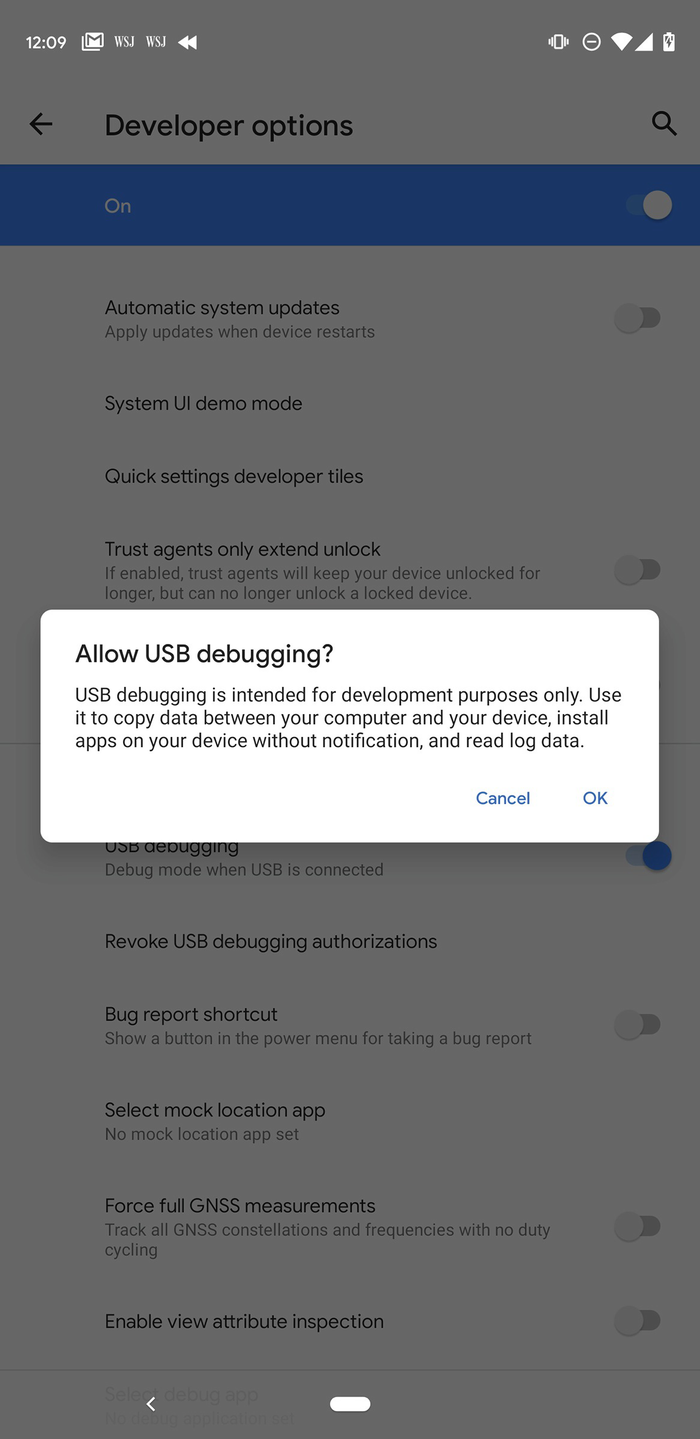
Screenshot of the message you get when you enable USB debugging on a Google Pixel
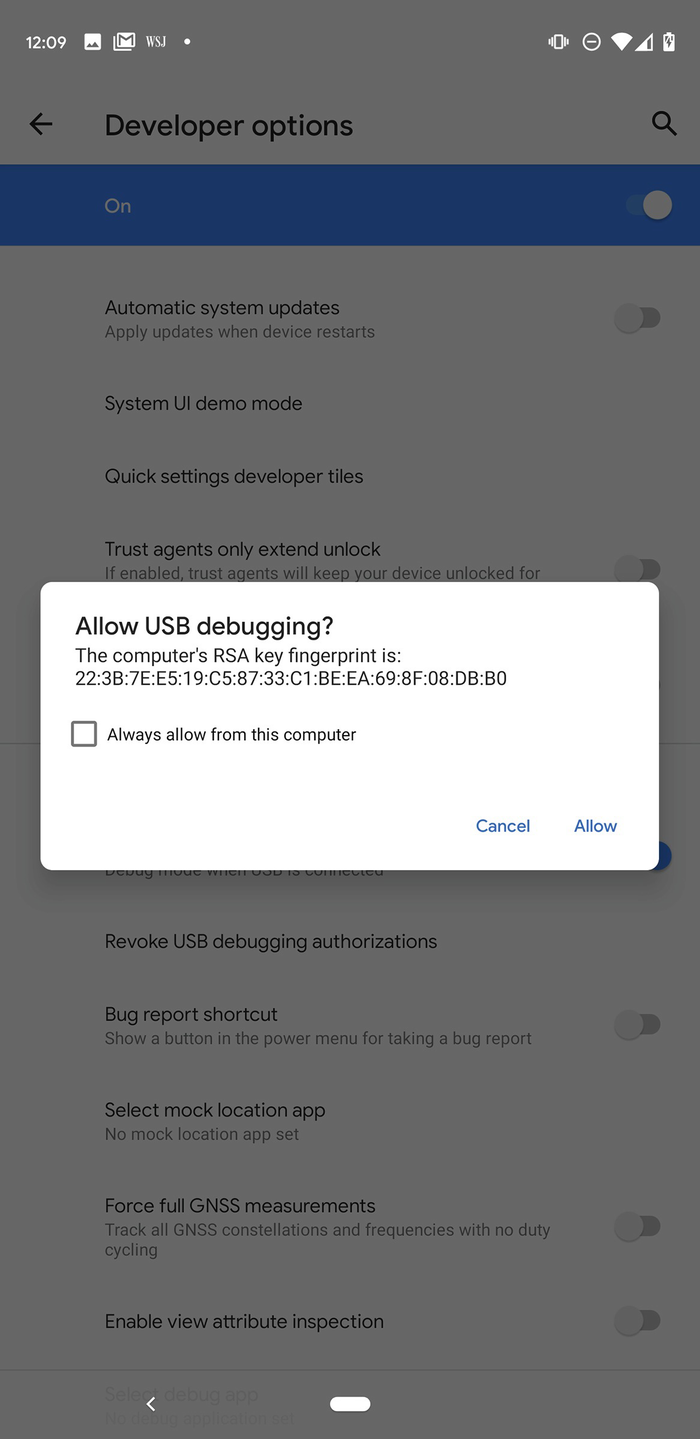
Prompt to trust the computer that you just connected
Super! Now let’s connect our phone to our workstation, shall we? Grab a hold of your USB cable that came with your phone and plug the phone into your workstation. In my case, I will plug it into my MacBook. One useful and secure feature of the newer Android builds is that whenever you plug the phone into a computer, you get prompted whether to trust the device or not. This makes things a lot safer from folks who think they could just rock up to you at a Starbucks when your back is turned, plug their computer into your phone and instantly root your device, hack it, and walk away. If you don’t keep your phone locked, they can still do this because they can just allow access themselves. But this will never happen because we all protect our phones with a password or biometric access, right? Good. For now, go ahead and trust your own computer by clicking Allow (Figure 5-11).

Listing of adb devices
The command itself is straightforward. We use adb pull to pull the apk from the device. We supply the adb pull command with our path. Then we leave a space and give it the name lylt.apk. In Android when apps are installed, they are named base.apk which gets a bit confusing when you have to work with many of them, so I rename it whenever I pull the apk to my computer – which is what we have done.
Our next step is to look inside the apk and figure out what is going on in there. There are a few different ways of doing this and also different tools that we can use. I will talk about how I analyze an apk and the tools that I use.
Static Analysis
Static analysis is one of the ways you can look at an app. The term static means that the app isn’t running. Some of the typical static analysis techniques are reverse engineering which fall into either decompiling or disassembling. Decompiling means you reverse a binary, compiled version of the app back into its source code, and disassembling means you convert the binary to a possibly less human-readable code more closely matching machine language. Typically, this is known as the assembly language, hence disassembly. With Android apps, we usually write them in Java or Kotlin. In some cases, we may use C or C++ to build parts of an app that require more compact and performant code than what either Java or Kotlin can provide. Imagine that if an Android app is written in Java or Kotlin, compiled, and then distributed on the app store, you already know how to install it on your phone and then copy it to your computer so you can do some static analysis on it. If we decompile it, we are hoping to get back Java or Kotlin code so we can better decipher how the app was built.
The go-to tool of mine is a commercial decompiler for Android apps called JEB. It is written and maintained by PNF Software which I’m sure for the most part was largely developed by its founder Nicolas Falliere. It is a very nice piece of software that is very self-contained and can even do dynamic analysis. You can extend it by writing your own scripts to deal with some repeating part of the analysis you want to do, or you can write a customized deobfuscator (more on that later). But I would be remiss in my duties as a knowledge sharer if I didn’t talk about a free solution as well. Thus, before we move on to JEB, let’s look at APKTool.
APKTool
APKTool is a command-line tool for reverse engineering Android apps. You can find APKTool at https://ibotpeaches.github.io/Apktool/. Getting APKTool is very easy, especially if you don’t want to build it from source. The instructions are quite simple, and I leave it to you as an exercise to follow from here: https://ibotpeaches.github.io/Apktool/install/.
If you’re a Mac user, you can easily install APKTool from Homebrew by executing
brew install apktool
The names “smali” and “baksmali” are the Icelandic equivalents of “assembler” and “disassembler” respectively. Why Icelandic you ask? Because dalvik was named for an Icelandic fishing village.
What you generally want to look for is in the AndroidManifest.xml and the other “smali_classes” directories. The Android Manifest of course contains essential information about the app. You will find a lot of information ranging from package name, what components exist in the app, compatibility, permissions, and where the start points of the apps themselves are. This would be the app entry point with which you can begin your tracing. The entry point is the one that gets executed when a user taps the app icon. To find this, you have to look for the Activity name that has the MAIN action type and the LAUNCHER category. If we look through Lylt’s Manifest, we can see that com.lylt.customer.feature.onboarding.OnBoardingActivity is the entry point.
I use the command find . -type f |grep OnBoardingActivity which prints out every file name in this directory and does so recursively through every subdirectory but then only shows me the ones that have OnBoardingActivity in the name while being case sensitive. The one we’re after is this one: ./smali_classes2/com/lylt/customer/feature/onboarding/OnBoardingActivity.smali.
Sublime Text with open smali file and smali syntax highlighting
It is easy enough to start analyzing an app with APKTool and some Unix magic together with Sublime Text. You can still get the job done in terms of tracing program flow, figuring out which component does what, and so on. I think this would take a little longer though, because of a lack of a unified project management interface. I did an experiment with a Unix one-liner to generate a tree out of the directories we had generated. Had I used it in this book, even formatted for it to read like code, it would take up 20 pages in this chapter that I don’t think it would be worth anyone’s while in including – no matter how fat this book got.
Therefore, I must reluctantly bid goodbye to APKTool and its friends when I analyze apps. I want to reiterate that like a mechanic working on a high-performance car, in the absence of time to make them, the best thing to do would be to buy some high-quality tools. This is why I will now move on to JEB.
JEB
Main window: This is where you see disassemblies, bytecode, and decompiled source code. It also shows you a graphical view of the various code components so you can easily visualize branching and jumps.
Explorer: This is the project explorer. You can see and open files such as the Android Manifest, certificates, and resources such as strings and image.
Hierarchy: This window shows the directory tree of the disassembled apk. The source files that were packaged into this apk will be visible for you to navigate. This includes third-party libraries and the app’s code.
Logger: This window shows you JEB’s execution and what it is doing in the background. Errors, warnings, and others will show up here. You also get access to a terminal that you can use while debugging.
Callgraph: From here, you can generate the callgraph for your apk. Essentially, a callgraph is a visual representation of all calls made by your app to other parts of your app, third-party libraries, or frameworks.

JEB and how I have my version setup
Hello Sheran – yes, not a problem. I was struggling to find a name at the time (early 2013), and since the original version was focused solely on reversing Android apps, I thought ‘okay, this complements IDA, in a way it’s IDA+1’, and thus, by shifting all 3 letters by one position, we end up on JEB. I liked it and it started to stick, so I kept it.
The actual process of conducting a static analysis varies greatly, but what is common is to understand what source code triggers a certain behavior in an app. One common use case of static analysis is to discover how data is encrypted within an application. If someone has rolled their own encryption or encoding mechanisms, we can easily uncover it in a session of static analysis. Another reason would be to see how or whether sensitive data was stored on a device – data such as an encryption key, a private key, or a shared secret that you can later use to decipher communications between the app and the server. Other things I look for when doing static analysis are source code that may generate or validate a specific code. For example, if the app requires you to enter a serial number or specific key code, then I take great joy in discovering how to defeat that check for a valid key entry. I will spend days if I have to tracking down the piece of code where the check is done to verify whether a specific code entered is correct. Usually, this is the gatekeeping function that will see if you have the correct code in order to unlock a specific feature. Two ways to go about defeating this would be (1) to learn how the algorithm works and write code using that algorithm to generate your own keys or codes – the older of you would know this as keygenning – and (2) to bypass the check altogether. Usually, the gatekeeper has at its core a very basic if-else function. If key is correct, allow access; if not, deny. So, one thing you can do is patch the apk or source code and rebuild the app so that your version allows access even if the code is incorrect.
If you don’t have JEB and are wondering what your options are, then there are a few. APKTool is one which will decompile your APKs into smali code, which is still easy enough to understand, but obviously not as great as having Java code. A really good tool combo to use is dex2jar and JD-GUI, which we covered briefly in the previous chapter. Essentially, it would involve converting your APK into a JAR file and then decompiling the JAR file through JD-GUI. You don’t get the cool debugger or the additional on-the-fly decryption of obfuscated strings and such, but it can still be pretty effective. In place of a debugger, you can consider using Frida which does runtime instrumentation. That means that you can locate and pause and alter bits of the app while it is running. Frida does require rooted devices for it to run well, however.
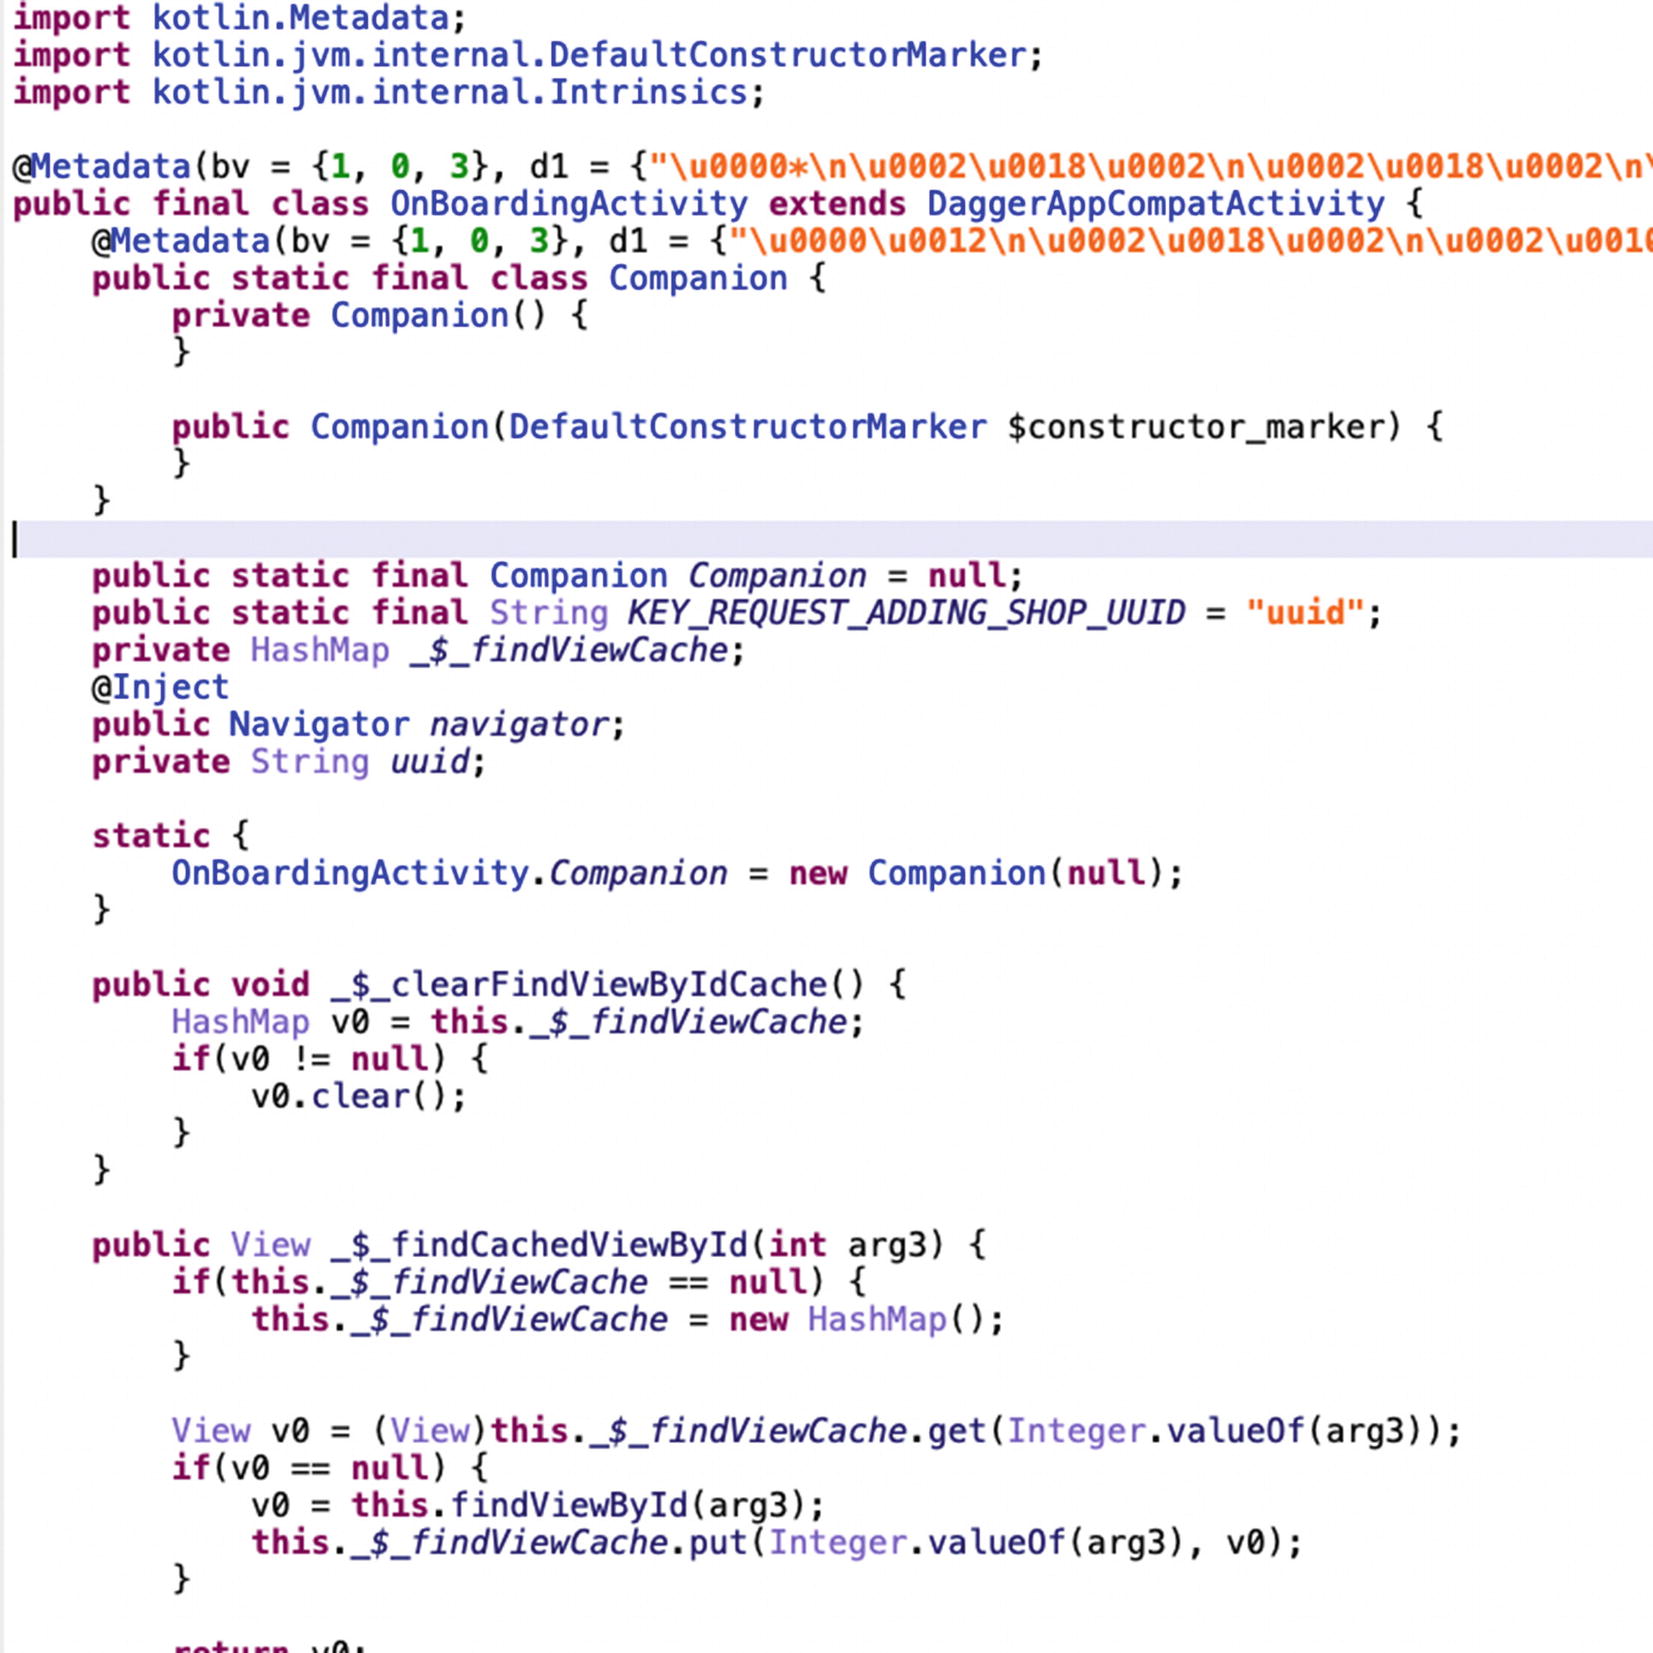
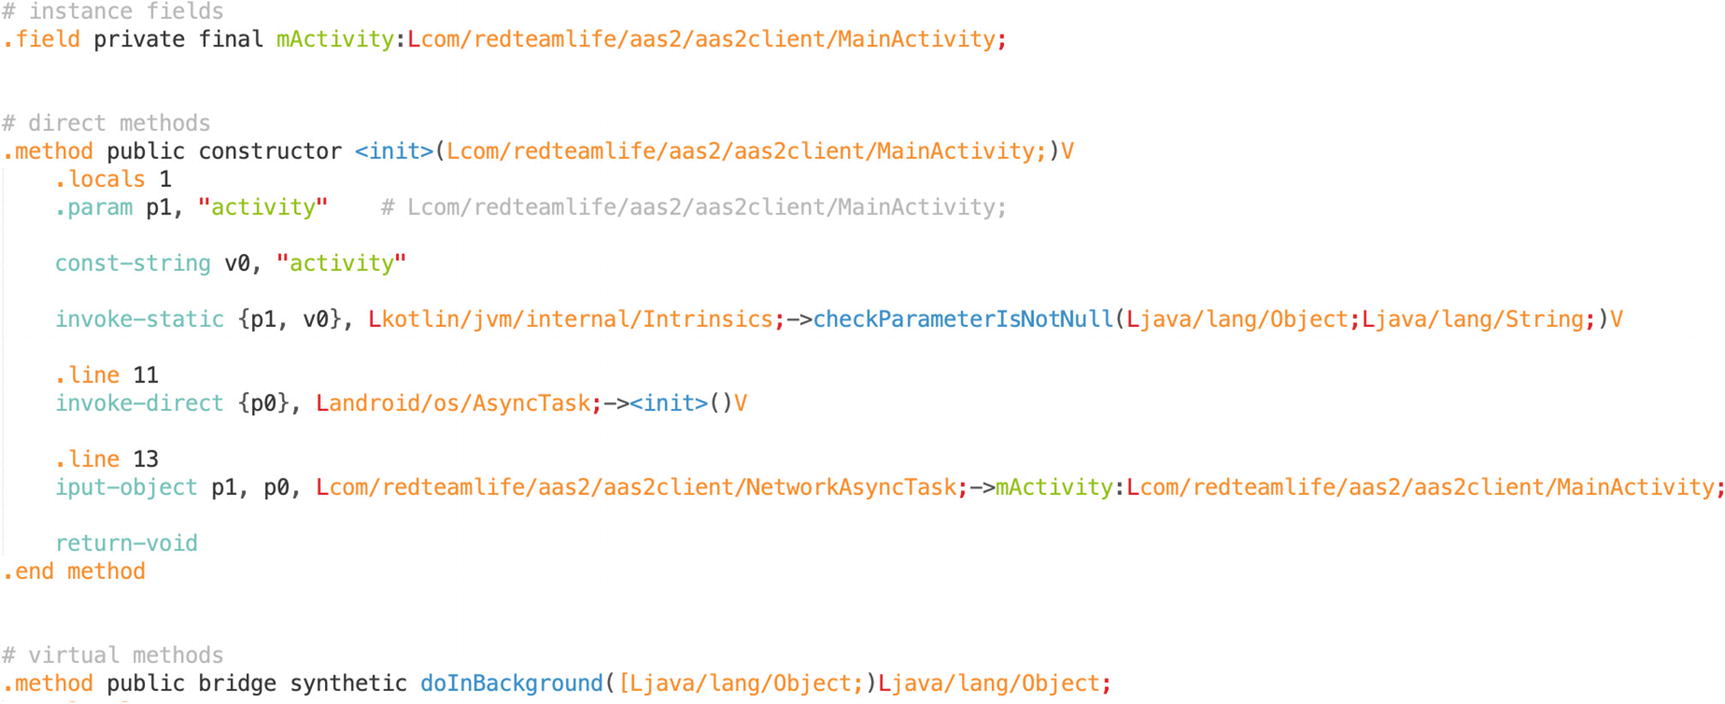
JEB’s decompilation of the Lylt MainActivity

JEB’s source code hierarchy

JEB’s visual program flow representation
As an attacker, and a helpful one at that, what your aim should be is to find instances where the engineering team or developer has made less secure decisions when writing their code. These instances can be used as tools to further their learning. I find that taking the time to learn and understand the context of the code and then presenting the actual code to the developer, sitting with him, and working through the reasons are more powerful than taking the approach of “Oi I’m security, do what I tell you to do.” Of course, you may have to invest some time and energy in learning to communicate with less receptive people. This is because from the beginning, the sitting down of developer and security engineer is viewed as adversarial. It never is. The adversary is out there – the hacker that is trying to wreak havoc on your systems, not the guy working in the same company trying to figure out together with you how to solve a particular security concern. In practice, this is rarely the case. The us vs. them mentality is prevalent throughout startups and organizations. I was personally responsible for propagating such a message to my team, not explicitly but by cheering them on and acknowledging how good they were. My praise of them began to take on a note of pride in competence. We were so good that we could take apart any developer’s code. Praise is important; hubris is unforgivable. Learn to work well with your engineering team. It will pay dividends in the long run.