
At this stage, we have a working Android development environment and we have built and deployed our first app. It is obvious, however, that code auto-generated by Android Studio is not going to make the next top-selling app on the Google Play Store. We need to explore this auto-generated code so that we can begin to understand Android and then learn how to build on this useful template. With this aim in mind, in this chapter, we will do the following:
First, let's see how to get feedback from our apps.
In the previous chapter, we mentioned that our app was running in debug mode on the emulator or real device so that we can monitor it and get feedback when things go wrong. So where is all this feedback then?
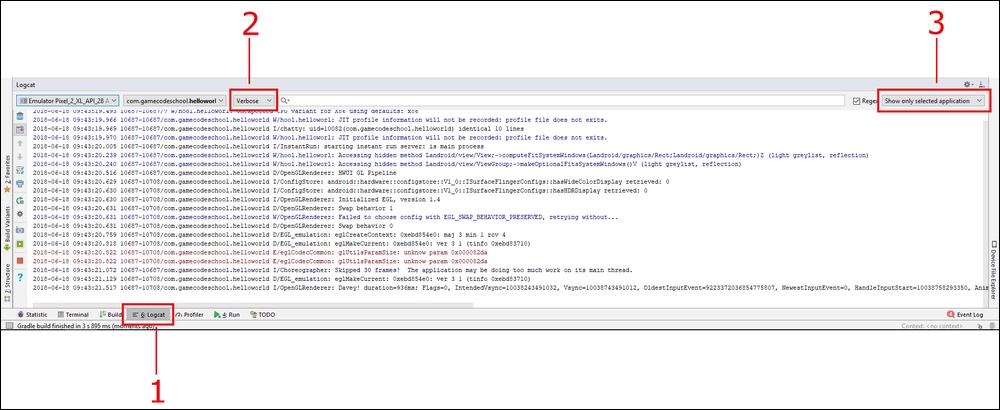
You might have noticed a whole load of scrolling text at the bottom of the Android Studio window. If not, click on the logcat tab, as shown by the highlighted area labelled as 1 in the following screenshot:
Tip
Note that the emulator must be running, or a real device must be attached in debugging mode, for you to see the following window. Furthermore, if you restarted Android Studio for some reason and have not yet executed the app, then the logcat window will be empty. Refer to the first chapter to get the app running on an emulator or a real device:
You can drag the window to make it taller, just like you can in most other Windows applications, if you want to see more.
This window is called the logcat, or sometimes it is referred to as the console. It is our app's way of telling us what is going on underneath what the user sees. If the app crashes or has errors, the reason or clues to the reason will appear here. If we need to output debugging information, we can do so here as well.
You might have noticed that most, if not all, of the content of logcat is almost unintelligible. That's OK. Now we are only interested in errors that will be highlighted red and the debugging information, about which we will learn next. So that we see less of the superfluous text in our logcat window, we can turn on a number of filters that will make things clearer.
In the previous screenshot, I highlighted two more areas as 2 and 3. Area 2 is the drop-down list that controls the first filter. Left-click it now and change it from Verbose to Info. We have cut down the text output significantly. We will see how this is useful when we have made some changes to our app and redeployed it. We will do this after we have explored the code and the assets that make up our project. Also, double check in the area that is labelled as 3 that it says Show only the selected application. If it doesn't, left-click on it and change it to Show only the selected application now.
Now we can look at what Android Studio automatically generated for us and then we can set about changing and adding to the code to personalize it beyond what we got from the project creation phase.