
Appendix A. Debugging tools of the trade
In this chapter
- The Android Debug Bridge
- Accessing system logs
- Strict mode
We covered many different topics in this book, hopefully in enough depth to not leave too many unanswered questions, but we wanted to talk about a few more things. The following appendixes contain useful bits and bobs about topics that we merely touched on briefly as part of a technique, or that didn’t quite fit elsewhere in this book.
We have a total of four appendixes, labeled A through D. We tried to keep every topic self-contained, so that the order in which you read through them doesn’t matter, although we believe the way we arranged them should be the most natural one when working through them in order.
That being said, we start in appendix A with some advanced debugging hints and tricks by revisiting the Android Debug Bridge (ADB), as well as a more recent addition to the SDK called StrictMode. In appendix B, we’ll look at Android from a completely new angle, showing you alternative approaches to development that leverage web views and JavaScript, and even entirely new languages like Scala. Appendix C will shed light on a useful optimization tool that often doesn’t get the attention it deserves: Pro-Guard. Finally, we’ll look at a second tool that’s similarly underappreciated: a scripted Android automation tool called Monkeyrunner. We’ll start in this appendix by revisiting the ADB.
A.1. The Android Debug Bridge
When developing and debugging Android applications, you’ll spend a lot of quality time with one particular tool: the Android Debug Bridge, or ADB. The ADB is a client/server application that enables you to interact with an Android device or emulator (we’ll say device hereafter) from your command line. More specifically, it allows you to detect and enumerate connected devices and run commands directly within a device’s shell. We’ll now run through some typical scenarios that involve working with the adb tool.
A.1.1. Interacting with devices
If you’re running an emulator or have devices connected to your development machine via USB, then you can use the ADB to discover and connect to them. For instance, if we have my Nexus One connected to my computer, and we’re also running an Android emulator instance, using the adb devices command to enumerate all visible Android devices will return the following:
$ adb devices
List of devices attached
emulator-5554 device
HT019P801932  device
USB Debugging
If your device is connected to your computer’s USB port and turned on, but still refuses to show up in the list of connected devices, most likely, USB debugging has been disabled on this device. You can turn it on by going to the device’s development settings via Settings > Applications > Development and checking the USB Debugging option.
When Devices Still Don’t Appear...
If a device still doesn’t appear after enabling USB debugging, then most likely ADB has crashed. This happens every now and then, but it’s nothing to worry about. In these cases, first run adb kill-server. A subsequent call to adb devices should then restart the server, and hopefully list the missing device.
The ADB identifies devices based on their serial number, which in the case of the phone used here is HT019P801932. When starting emulators, they’re automatically assigned serial numbers that correspond to the port number on which they can receive commands, prefixed with emulator-. The ADB server claims ports in consecutive pairs: even port numbers designate command ports (we’ll see in the next section how that works), and odd port numbers designate the ADB connection. A second emulator would therefore be assigned the serial number emulator-5556.
If you want to interact with a specific device via ADB, you can tell it which one you’re targeting by specifying its serial number with the -s option:
$adb -s HT019P801932 [more options here]
In case you have only one physical device and one emulator connected, as in this example, you can simplify device targeting by using the -d and -e switches to target the single connected physical device or emulator, respectively. If only one device is present, regardless whether it’s an emulator or an actual device, you don’t have to use any device targeting at all; ADB will connect to the device it finds.
Once ADB knows which device it’s targeting, you can trigger various commands to interact with it, such as copying files from and to it, installing and removing application packages, rebooting the device, or opening a command shell on it. To see a full list of available commands and their options, run adb without any arguments. It’s worth noting that most commands you can directly pass to ADB are shortcuts to commands that you’d otherwise run on the device’s command shell. For instance, the adb install command is a shortcut to the device’s package manager command pm, and hence is equivalent to running adb shell pm install. For that reason, we’ll now take a closer look at how to use the device shell directly.
A.1.2. Using the device shell
One of the ADB’s most powerful features is that it lets you access an Android device’s command shell. Recall from chapter 1, that Android runs on a modified Linux kernel, and it goes without saying that every honest Linux comes with a command shell. Unfortunately, Android doesn’t bring the ubiquitous and powerful Bourne-Again Shell, better known as bash, which can be found on practically every modern Linux and MacOS X computer. Instead, a minimalistic shell is provided, with only a small subset of the OS applications that a typical GNU/Linux environment offers (for instance, cd, ls, and mv are available, but other often used commands such as cp, more, less, and file are absent).
You access a device’s shell using the adb shell command, and you can do so in two ways: first by doing a one-line command, and second by launching into interactive mode, where you can send multiple commands one after another. If, for instance, you want to list all files in the current directory, you can do that as a one-line command like so (we assume a single connected device for now):
$adb shell ls
config
cache
sdcard
...
This command means: “using ADB, open a shell on the current device, execute its ls command, and print its output here.” You can also launch into the shell by not passing a remote command:
$adb shell
# ls
config
cache
sdcard
...
# exit
You can exit out of the device shell by pressing CTRL+D. The # symbol indicates that this is the device’s root account shell, which has “superuser” or “admin” access. On an emulator you’ll always launch into the root account, giving you full access to files and folders. That’s typically not true for phones and tablets, which you need to “root” first in order to get access to the root account. Unless you do that, you can’t even peek into most folders.
Let’s install the DealDroid (introduced in chapter 2) on a running emulator so we have something to toy around with (run this command from within the DealDroid directory):
$adb -e install -r bin/DealDroid.apk
663 KB/s (28308 bytes in 0.041s)
   pkg: /data/local/tmp/DealDroid.apk
Success
The -r switch will force a reinstallation in case the package already exists. Good, we’ve pushed an application to the emulator. Let’s see what we can do now using the device shell.
A.1.3. Controlling Android’s execution environment
Once our application is on the device, we can launch it in entirely new ways via the shell. Typically, you’d go to the application launcher and select its launcher icon. This will start the application in a standard way, which is fine in standard situations. But what if you want to see how a single Activity behaves with changing system configurations or when started using different Intent parameters? To some degree, you can test these programmatically using unit tests (see chapter 13), but this requires you to write code, and sometimes you just want to check whether something works or play around with a feature. Recall that we coded the DealDetails screen so that if no item was picked from the DealList first, we show a toast with an error message (see figure A.1).
Figure A.1. This error message is practically impossible to reproduce by running the application under normal conditions. In these cases, Android’s activity manager can help to launch single screens with any Intent data you desire.

Under normal circumstances this is difficult to test manually, since usually there will be a valid item being passed to this screen. It would be useful to be able to launch an individual screen of an application using a specified set of Intent parameters, or launch it without going through another screen beforehand so that we can test and reproduce failure scenarios. This is where Android’s Activity Manager kicks in.
Starting Components with Activity Manager
You can use the am tool, Android’s Activity Manager, to start applications or even single screens in a controlled way. Coming back to our example with the DealDetails, let’s start it without going through DealList first, so that no item is set:
$adb shell am start -n com.manning.aip.dealdroid/.DealDetails
The am start command will start an Activity using the Intent data you specify. Here we identified the component we want to start directly using the -n switch. This corresponds to starting an Activity from code using its class name, which is an explicit Intent. You can also fire an implicit Intent using am start, via its various other options (get a list of them by launching the command without any arguments). Not only can the Activity Manager tool start activities, it lets you start services, fire broadcast Intents, and more.
One particular command that deserves mentioning is am instrument. This is the way you start instrumentations such as an InstrumentationTestCase when not using Eclipse, and build systems such as Ant and Maven (see chapter 14) use that under the hood. It gives you a lot more flexibility regarding what will be tested, something that the ADT doesn’t offer. More precisely, it allows you to only run tests that have a specific Java Annotation, that are in a specific package, or even single test methods. For instance, if we only want to run the testPreConditions test method of our DealDetailsTest from chapter 13, we can do so as follows:
$adb shell am instrument -w -e classcom.manning.aip.dealdroid.test.DealDetailsTest#testPreConditions
Where is this Documented?
Unfortunately, the am instrument command itself doesn’t print a list of all parameters it supports, but there’s a good summary of the available options in the JavaDoc comments of the InstrumentationTestRunner class: http://mng.bz/s5r7.
For this reason, Android build systems, such as the Android plug-ins for Maven and Gradle, leverage am instrument for more powerful test invocation.
Manipulating System Properties
Gaining full control over how activities or services are started is great, but application behavior doesn’t only change with the arguments you pass in an Intent. For instance, many applications are translated to different languages, so it’s desirable to test them with the device set to a foreign language. Unfortunately, the emulator only allows us to set a handful of languages, and Portuguese, for instance, isn’t available. There’s a way around this, though. Android controls many different things, including system language, through a list of global system properties. These properties are available to you via Java’s System.getProperty function. Java properties are key/value pairs, and Android’s system properties can be directly read and modified through the getprop and setprop tools. If, for instance, we want to change the system locale to Portuguese (pt_PT), then we can do it like so:
$adb shell setprop persist.sys.language pt
$adb shell setprop persist.sys.country PT
Note that system properties are only read once when Android’s root VM Zygote (see chapter 1) is launched. In order for this to take effect, we must restart the emulator (either manually, or using the start and stop commands).
Setting Custom Locales with the Devtools
There’s another way to set the system locale to any value you desire, and that’s the Dev Tools application that’s preinstalled on every Android emulator. This tool isn’t available on phones, so you’d have to adb pull its APK from an emulator and install it on a phone first.
You can print out a list of active system properties by running getprop without arguments. You can also control the Dalvik VM via system properties. One particularly useful property is dalvik.vm.enableassertions. This is the equivalent of Java’s -ea switch, which enables the use of the assert keyword in Java code:
$adb shell setprop dalvik.vm.enableassertions all
If, for instance, we thought that whenever a null item is passed to the DealDetails screen, this was a programming error rather than an expected situation we can recover from, then it would be better to place an assertion in the DealDetails as long as the application is still in development and being tested (based on listing 2.11 from chapter 2):
Item item = app.getCurrentItem();
assert( item != null );
With assertions enabled, launching this screen without selecting an item first will now make the runtime throw an AssertionError and terminate the application. We can then see from the logs which line of code raised the AssertionError and fix our application accordingly.
If Properties Don’t Stick...
Again, Android can be flaky sometimes with respect to the setprop and start/stop commands. If you find that Android forgets properties you set that way, try putting them in a file called /data/local.prop on the device instead. Put each property on a separate line as <key> = <value>; for example dalvik.vm.enableassertions = all.
We mentioned that AssertionError, like all uncaught exceptions, will get logged to the system log file. We’ll come back to this in a minute, but before we look at logging in more detail, there’s one last recipe to share in this section: how to manipulate an Android device’s geolocation.
Manipulating Location
We said in the beginning that ADB is a client/server application and that it operates on two ports: the command port and the ADB connection port. The former is of particular interest for developers, since we can connect to it via telnet and send commands directly to the device:
$telnet localhost 5554
Trying 127.0.0.1...
Connected to localhost.
Escape character is '^]'.
Android Console: type 'help' for a list of commands
OK
If only an emulator is running, then this will connect to the command port of that emulator. Using Telnet, type the text you want to send and terminate it via a carriage return (by hitting Enter). If you type help or help <command>, you’ll see a list of supported commands or a single command’s options, respectively. The most useful command for this is the geo command, since it allows you to send your device to virtually anywhere in the world by mocking a GPS fix. If, for instance, you want to reposition yourself to Mount Everest, then you’d type this into the telnet window:
geo fix 86.922 27.986 <ENTER>
OK
Go to the Google Maps application and see how it works! Note that the order of arguments is longitude first, then latitude. If you find yourself in open water in Google Maps, then you probably got them wrong. You can exit into the telnet prompt by pressing CTRL+]. Use the quit command to exit entirely.
A.1.4. Accessing the system logs
Without question, one of the most useful things for debugging is a system and application log file that you can inspect to see what’s going on. This is also where uncaught exception stack traces go, so always keep an eye on it when debugging.
You can follow the system log in the DDMS perspective in Eclipse, but if you’re a keyboard and console geek like us, you’ll want to use Android’s logcat command instead. Using logcat for debugging is documented in some detail at http://mng.bz/Tf31, but we’d like to highlight its key features and usage idioms.
As with all previous commands we’ve seen in this appendix, the logcat command is an application that sits on the device itself, but can be accessed via adb. If you run it without any arguments, it’ll jump to the end of the system’s main log file (there are two other log files, radio and events, which we’re not going to cover here) and keep monitoring it, much like GNU’s tail -f does:
$adb logcat
I/DEBUG   (   31): debuggerd: Jun 30 2010 14:39:19
D/qemud   (   38): entering main loop
I/Vold    (   29): Vold 2.1 (the revenge) firing up
I/Netd    (   30): Netd 1.0 starting
...
Android logs virtually everything, application output, garbage collector cycles, and calls to System.out.println, to this file. Note that this is a shared log file; all applications that use Android’s Log class log here. Every line in the log file consists of three parts: the log level, the log tag that identifies the component that wrote the line, and the log message. For example, the call Log.i("MyActivity", "This is a log message") will appear in the system log as:
I/MyActivity ( 1824): This is a log message
Here I (info) is the log level and MyActivity is the log tag, followed by the application’s process ID (1824) and the message. The logcat tool takes various options, one of the most useful being -v, which controls the log format. For instance, calling logcat -v time will enable timestamps in the log:
$adb logcat -v time
04-10 19:40:15.214 I/MyActivity ( 1824): This is a log message
...
Make yourself familiar with all options: it’ll make your life a lot easier. Log levels and log tags are used to keep the log file organized, and allow for easy filtering of its contents. In fact, logcat supports filter expressions that allow you to see only those things you’re interested in. Filter expressions follow the pattern tag:level, which tells logcat to only show log messages for the given log tag that have log levels with equal or higher priority as level. This approach leverages the fact that all log levels are assigned a priority. For instance, debug log output has a lower priority than error output (see table A.1 for a summary of all log levels).
Table A.1. Log levels in Android in ascending priority
|
Identifier |
Name |
Priority |
|---|---|---|
| V | Verbose (show everything) | 1 (lowest) |
| D | Debug | 2 |
| I | Info | 3 |
| W | Warn | 4 |
| E | Error | 5 |
| F | Fatal | 6 |
| S | Silent (show nothing) | 7 (highest) |
If, for example, you only want to see errors or fatal errors, you’d call logcat like so:
$adb logcat *:E
This translates to: for all components (for all log tags), only show log messages of type E or F. (Note that the S level takes a slightly special role, since it’s used to enforce that nothing is being logged, so it doesn’t make sense to speak of log entries of level S.)
Filter expressions can be combined. If you want to see only error messages from other components, but still want to see your own application’s debug output, you could use the following filter expression:
$adb logcat MyApp:D *:E
This will only affect log entries that have been written from your application using the log tag MyApp. One special case is standard out. If you have calls to System. out.println in your code (something we don’t recommend; that’s what the Log class is for), then these will appear in the log file with the log tag System.out, but unfortunately, you can’t filter by that tag. Here, you’ll have to fall back to solutions such as piping logcat into the grep tool, which you should be familiar with if you’re on a UNIX-based computer.
This wraps up our excursion into ADB and related commands. We’ve seen how to connect to devices from the command line, how to use a device’s command shell to get more control of how we run applications, and how to come to grips with Android’s system log. This is great to manipulate, monitor, and control an application from the execution environment, but what if you want to debug the more intrinsic behavior of your application, particularly its performance—or the absence thereof? Put it in StrictMode!
A.2. StrictMode
Building an Android application is one thing, but making it fast and responsive can be challenging. With this in mind, the Android SDK added a new tool in Android 2.3: StrictMode. This tool will detect many of the things that can cause applications to be sluggish, such as network access on the main thread. It’s enabled programmatically; the following listing shows it being enabled in the DealDroid application.
Listing A.1. Enabling StrictMode in DealDroid
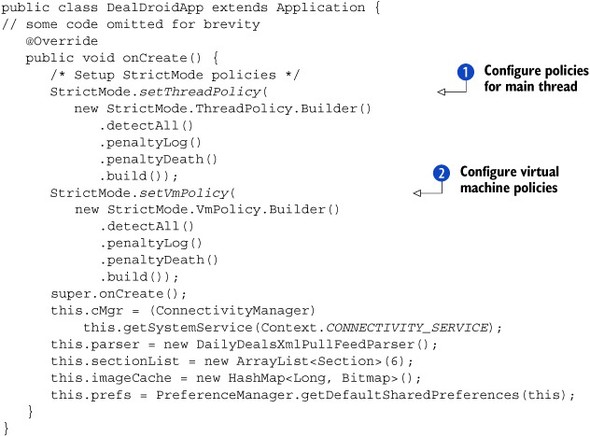
To use StrictMode, you need to programmatically enable it. In this example, we’ve done this in our app’s Application object, but you could also enable it in an individual Activity instead. If you configure like this, in the Application object, then it’ll be enabled for all of your activities. We can configure two types of policies for StrictMode. The first is the policy to be used for the current thread ![]() , which will be the main UI thread in this case. We’ve done a detectAll. This will include disk reads, disk writes, and network access. Next, we configure our virtual machine policy
, which will be the main UI thread in this case. We’ve done a detectAll. This will include disk reads, disk writes, and network access. Next, we configure our virtual machine policy ![]() , and again we use detectAll. This will detect several common mistakes that can cause your application to crash, such as leaking an Activity (and potentially large amounts of memory), failing to close databases/cursors, or other expensive resources.
, and again we use detectAll. This will detect several common mistakes that can cause your application to crash, such as leaking an Activity (and potentially large amounts of memory), failing to close databases/cursors, or other expensive resources.
Once we’ve added this code to our app, we can start it up. It’ll immediately crash. In LogCat we’ll see
StrictMode policy violation; ~duration=2689 ms:
     android.os.StrictMode$StrictModeDiskReadViolation: policy=87 violation=2
     ...
    at DealDroidApp.onCreate(DealDroidApp.java:93)
The StrictMode messages can be daunting at first, but you’ll quickly get used to them. This says that we had a disk read violation in our application, and going further down the stack trace, we see that it happens at line 93 in our DealDroidApp class. That is the last line of the onCreate method in listing A.1. It loads the default SharedPreferences for the app. SharedPreferences are persisted to the device’s internal flash memory, hence the disk read violation. You might not think this is a big deal. In this case, StrictMode says that it took 2689 ms; that’s almost 3 seconds! This was run in the emulator, which makes it slow. If you decide that you want to live with this disk read, you can configure StrictMode to ignore disk reads. Or you could refactor the code. In this case, the SharedPreferences are only used by our Service, so we can easily move the reading of them out of the DealDroidApp’s onCreate method and make our app start up more quickly. Finally, we should note that you should remove all StrictMode code before shipping your app. It should only be used during development.
A.3. Summary
In this first appendix, we’ve shown you a few debugging tricks that go beyond using your standard Eclipse debugger. We’ve shown how to get more control over your Android device and its execution environment using the ADB, and how you can profile your application’s performance using StrictMode to discover no-nos such as running expensive operations on the UI thread.
The next appendix may be interesting for the adventurers among us. It enters the realm of Web development and alternative programming languages on Android.