
7. Android Development with Cordova
The Cordova CLI takes care of the process of creating and managing Cordova Android application projects for you. For testing, it can launch a Cordova application on a physical device or on an emulator. Google provides a suite of tools you can use to help you build, test, and debug your Cordova applications for Android. This chapter shows you how to use those tools with your Cordova applications.
When you need to debug your application, you can use weinre (described in Chapter 5, “The Mechanics of Cordova Development”) or the Chrome debugger (described later in this chapter) to debug your Cordova web application as it runs on a device or in a device emulator. There are times, however, when you will want to use an IDE to manage your development efforts. Google provides such an environment in the ADT. You would use ADT when you want to customize the Cordova application project or when you are writing, testing, and debugging native plugins.
If you’re not developing for Android or you plan on using only the CLI and/or PhoneGap Build to build and test your applications, you can likely skip over this chapter. However, there are some cool tools included with ADT, so what you learn in this chapter should simplify your Android application testing and debugging efforts.
Using the Android Developer Tools
In Chapter 3, “Configuring a Cordova Development Environment,” I briefly showed how to install the Android Developer Tools on your Cordova development system. I really didn’t cover the topic too deeply or show you how to use the tools to work with your Cordova applications. In this section, I’ll show you how to use the ADT IDE as well as the command-line tools Google provides.
Managing the Android SDK
Before we start digging into the tools, we have to talk a bit about the details of the SDK installation. As the Android SDK and tools are updated on a regular basis, Google provides a tool you can use to configure the SDK and to check for and install SDK updates. The tool is the SDK Manager, and you can launch it by opening a terminal window and executing the following command:
android
On Windows, you can also navigate to the SDK installation folder (I showed how to put the files in C:adtsdk in Chapter 3; your location may be different) and execute the application executable (it’s called SDK Manager.exe on Windows).
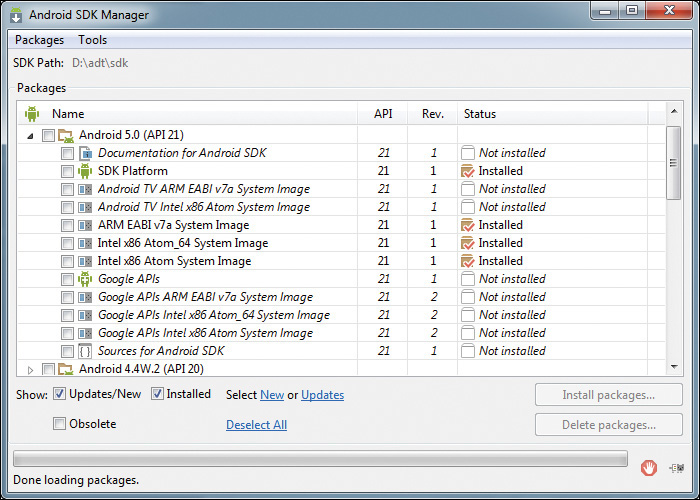
When the application launches, you will see the Android SDK Manager (ASM) screen like the one shown in Figure 7.1.

In this window, you can check or uncheck components of the Android SDK to install or uninstall them on your development system. When you select one or more items in this window, you can then install them by clicking the Install packages button or delete them by clicking the Delete packages button. Be careful, though, since there is no option for installing some and deleting others at the same time; you have to do all of your installing and deleting separately.
What you see in the figure are the options for managing the SDK Tools, Platform tools, and Build tools (the Build tools are used by the Cordova CLI). As you can see, there have been a lot of Build tool releases over the years. You can also use the ASM to install the SDK components for specific versions of the Android operating system as shown in Figure 7.2.
What I typically do is install the SDK platform and emulator images for each of the target OSs I will be working with. Notice in the figure that there is an SDK option as well as one for Google APIs; the Google APIs option is the same as the SDK platform but also includes Google applications such as Google Maps and other Google-specific libraries.
As you can see, there are also different types of system devices (emulators) offered; I’ll explain them in the next section. I don’t install the source code (sources) as I don’t ever spend time poking around within the Android source code.
What you should do here is select the appropriate components for each target OS you will be supporting for your application so that you have what you need to build and debug for each target OS version as you develop your application. In the next section, I’ll show you how to manage emulator configurations so you have the right set of emulators to test your application against.
Using the Android Virtual Device Manager
For most mobile platforms, the vendor’s SDK includes a stock set of device simulators with little variety. Because Android devices are available from a wider variety of vendors and each supports different screen resolutions, hardware, and so on, applications have to be able to run on all of them. Google refers to the Android emulators as Android Virtual Devices (AVDs). To make it easier for you to test your Android applications on different configurations, Google provides an Android Virtual Device Manager application you can use to define the complete set of emulator configurations you need to test your applications.
Android devices are offered on two different processor families: ARM and Intel. In order to allow you to test your applications on both, Google provides emulator system images for each. It’s important to note that the Android emulators are very slow; they take a long time to start up, and even on modern hardware you’ll find the emulators to be not as responsive as physical devices. That’s why it’s usually much easier to test your Android applications on a physical device.
Between the two options, the Intel device emulators perform better than the ARM-based emulators. Since both Microsoft Windows and Macintosh OS run on Intel hardware, there must be some internal benefit from emulating the Intel emulators on an Intel processor. Because of this, I usually try to use the Intel-based emulators when testing my applications. There are, however, some additional steps you must follow in order to be able to use the Intel-based emulators; I’m going to cover these steps here, but they are also described on Intel’s web site at http://goo.gl/gzMbYY.
In order to be able to use the Intel-based Android emulators, you have to install the Intel Hardware Accelerated Execution Manager (HAXM). If you scrolled down in the Android SDK Manager window, described in the previous section, you would have seen an entry for the HAXM installer at the very bottom as shown in Figure 7.3.
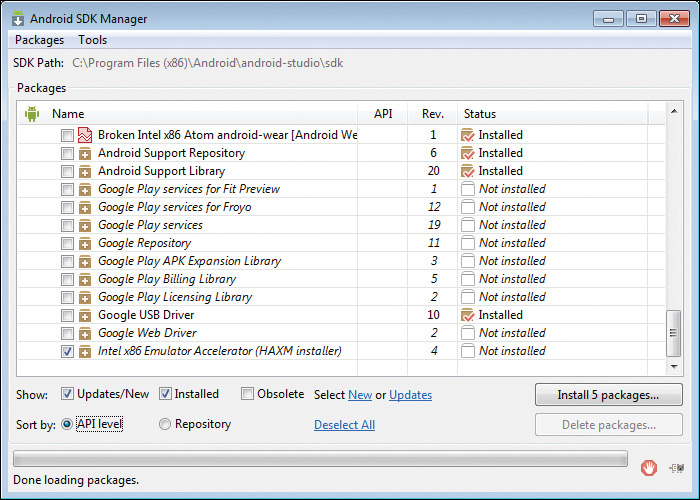
When you select this option as shown and install it, it will place a copy of the HAXM installer into the SDK’s extras/intel/Hardware_Accelerated_Execution_Manager folder (this would be in D:adtsdkextrasintelHardware_Accelerated_Execution_Manager on my system). Once the file is there, you can launch the installer application in that folder and install the HAXM components required to run the Intel-based emulators.
Now it’s time to start defining some emulator configurations. Make sure that you have at least one of the Android platforms installed on your system (shown in Figure 7.2). From the SDK Manager, open the Tools menu, then select Manage AVDs. The SDK Manager will open the window shown in Figure 7.4.
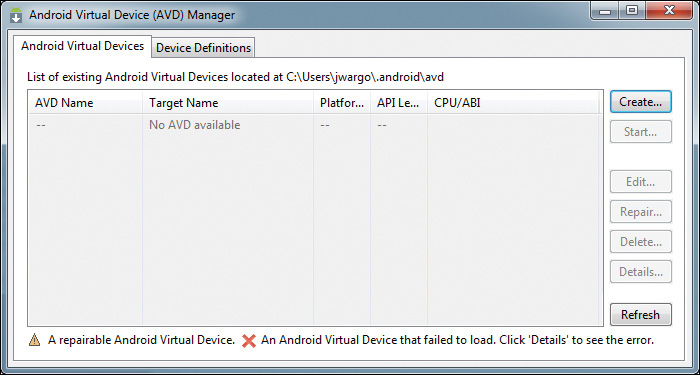
This is where the Android SDK manages the AVDs for this system. To create a new AVD, click the Create button shown in the upper-right corner of Figure 7.4. The AVD Manager will open the dialog shown in Figure 7.5. Here you will set the settings specific to the device emulator you want to create.

You’ll have to give the AVD a name (without any spaces) and select the device form factor, target OS, and more. Google doesn’t provide any indicators to tell you which fields are required; most of them are, so simply populate the dialog as you see fit and click the OK button when you’re done.
After you have saved your changes, the AVD will appear in the list shown in Figure 7.4. Now you’ll be able to start the AVD, edit it, delete it, and more. To run the AVD, click the Start button and the AVD Manager will display the dialog shown in Figure 7.6. In this dialog, you can adjust some of the settings for the AVD before launching it.

When you’re testing an application’s initial load operation or when you’ve made dramatic changes to the application’s configuration options, you may want to wipe any existing user data on the AVD before starting it. To do this, check the Wipe user data checkbox before clicking the Launch button. I’ll do this if I have an application or emulator that’s misbehaving or after I’ve been working with a particular AVD for a while. This gives me a clean slate to work with and sometimes fixes weird problems I’ve encountered. You’ll also want to do this if your application installs one or more datasets or changes the device configuration somehow and you want to test that part of the code against a clean image.
When you click the Launch button, a new window will appear showing progress of the AVD launch. After a while, quite a long while usually, the window will close and the emulator will open. Eventually you will see the emulator running in its own window as shown in Figure 7.7.

You can also run an AVD directly from the command line. Before you can do this, you’ll need to obtain the name of the AVD you want to launch. To do this, open a terminal window and issue the following command:
android list avd
The SDK Manager application will churn for a little while, then display the list of AVDs defined on the system:
Available Android Virtual Devices:
Name: Android_4.4.2
Device: Nexus 5 (Google)
Path: C:Usersjwargo.androidavdAndroid_4.4.2.avd
Target: Android 4.4.2 (API level 19)
Tag/ABI: default/armeabi-v7a
Skin: WVGA800
---------
Name: Android_5.0
Device: Nexus 5 (Google)
Path: C:Usersjwargo.androidavdAndroid_5.0.avd
Target: Android 5.0 (API level 21)
Tag/ABI: default/armeabi-v7a
Skin: WVGA800
Once you know the name of the AVD, you can launch it from the terminal window using the following command:
emulator @avd_name
Or you can also use
emulator –avd avd_name
So, for my environment, to launch my Android 4.4.2 AVD, I would use the following:
emulator @android_4.4.2
Or I could also use
emulator –avd android_4.4.2
You won’t see any progress window appear with this approach; simply wait a few minutes and the AVD will launch.
Using the ADT IDE
By default, ADT ships with a preconfigured version of the open-source Eclipse IDE. You can use this IDE to edit, compile, run, and debug Android Java applications; you can learn more about and download ADT at the Android Developer web site at http://goo.gl/f0DTPu.
If you’re already using Eclipse for other development work, you can add ADT to an existing Eclipse installation using instructions found at http://goo.gl/wIIbtT. The process is pretty easy and doesn’t take a lot of time. Be sure to check the system requirements to make sure the version of Eclipse you are using is compatible before attempting to add ADT. Google is really good about keeping up with Eclipse and supports a wide range of Eclipse versions.
To start the ADT IDE, navigate to the folder where you extracted the Android SDK and launch the Eclipse application located in the eclipse folder. The application will be called eclipse on Macintosh OS and eclipse.exe on Microsoft Windows. When you first start ADT, you will see the standard Eclipse UI shown in Figure 7.8.

Editing Cordova Application Content Files
Android applications are built using Java, but developers can also code portions of their applications in C or C++. Since Android supports only these limited options for application development, ADT does not include tools specifically designed to help with debugging web applications like those that run within the Cordova container. So, you won’t be able to step through an application’s JavaScript code, set breakpoints, configure watch expressions, and so on within the ADT IDE. To debug Android applications, you can use the debugging approaches highlighted in Chapter 5 or the Chrome debugger described later in this chapter.
Although the CLI is designed for managing a Cordova application’s web application source code in the www folder rather than within one of a Cordova project’s platform folders, you will likely use an external web content editor such as Adobe Dreamweaver, Adobe Brackets, or some other tool. A Cordova project for Android has some special features that make it easy for you to edit your web application content in Eclipse. But, since ADT is configured for editing Java and C applications, it doesn’t include editors that help with editing the HTML, CSS, and JavaScript files your Cordova application will use. Because of this limitation, if you want to use Eclipse to edit your Cordova application content, you will need to install web content editing capabilities into ADT. The default tools for web content editing in Eclipse are from the Eclipse Web Developer Tools Project, and you can install them in ADT in a few minutes.
Within ADT, open the Help menu and select Install New Software; ADT will display the Install wizard shown in Figure 7.9. In the Work with drop-down field shown in the figure, select the Juno option. Juno is the version of Eclipse that ADT is currently using. After you make the selection, Eclipse will connect to the update site and pull down a list of available options. Scroll through the list and select Eclipse Web Developer Tools as enabled in the figure, then step through the wizard to complete the installation.

With the Eclipse Web Developer Tools in place, you will now be able to edit your Cordova application’s web application content in Eclipse.
Importing the Cordova Project
Assuming you followed the instructions in Chapter 4, “Using the Cordova Command-Line Interfaces,” to create an Android project, you should have a Cordova application project ready to be opened in the ADT IDE. If you haven’t already done so, copy the project’s web content from its www folder to the Android project’s folder by opening a terminal window, navigating to the Cordova project folder, then issuing the following command:
cordova prepare android
With the project files in place, you must import the project into ADT before you can work with it. To start the import process, in the ADT IDE open the File menu, then select Import. The ADT IDE will display the Import wizard shown in Figure 7.10. Expand the General option and select Existing Projects into Workspace as shown in the figure, then click the Next button.

ADT will display the next page in the wizard. In this dialog, you need to populate the Root Directory field with the location where the Cordova project’s Android project files are located. Click the Browse button and navigate to the android folder highlighted in Figure 7.11, then click the OK button.

The wizard should automatically add the HelloCordova project to the list of available projects as shown in Figure 7.12.

When you click the Finish button, ADT should complete the import process and open the imported project in the IDE as shown in Figure 7.13. Since the Cordova project consists of both a native Java Android application and the web content that will execute within the application, you will see a blending of a default Android project structure plus the Cordova www folder discussed in previous chapters.
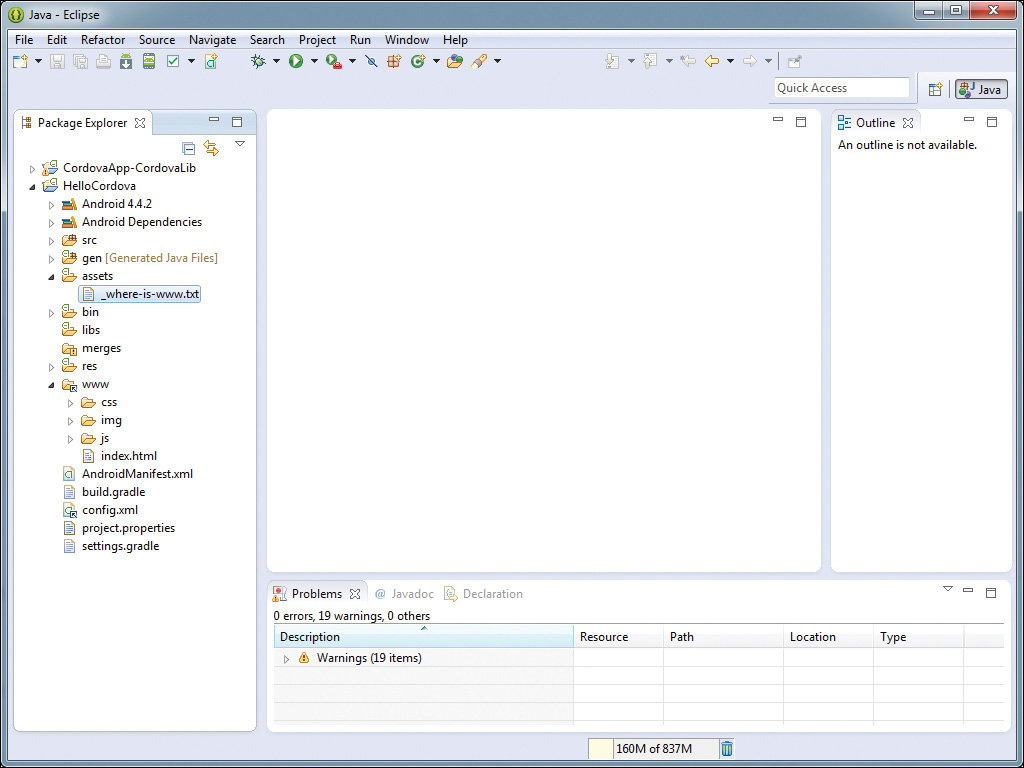
Notice in the figure how I’ve highlighted the _where-is-www.txt file in the Package Explorer’s assets folder. Remember from Chapter 5 that I explained that an Android Cordova project stores the project’s web application content in the assets/www folder. If you edit the web application content in that folder, those changes will not be reflected back into the Cordova project’s www folder.
To protect you from this, the Cordova team hid the assets/www folder, then created a symbolic link in the Android project structure that points to the Cordova project’s www folder (it’s the www folder shown expanded further down in the Package Explorer pane). This way, you’ll be able to edit the web application content in the right place, then use the cordova prepare command to copy the files into the Android project before testing it within the IDE.
You likely don’t need to see these files, but if you want to, the highlighted file in the figure contains instructions for unhiding the assets/www folder:
To show 'assets/www' or 'res/xml/config.xml', go to:
Project -> Properties -> Resource -> Resource Filters
And delete the exclusion filter.
If you follow the instructions, you will see the dialog shown in Figure 7.14. Select the line highlighted in the figure, then click the Remove button highlighted in the figure to remove the filter.

With that completed, you will be able to see the contents of the project’s assets/www folder as shown in Figure 7.15.

Running Your Cordova Application
Now that the Cordova project has been imported, you probably want to run it to see how it works. Before doing that, it helps me to have a few extra panes open in the ADT IDE. Open the Window menu and select Show View. In the menu that appears, select Progress; Eclipse will open the new panel at the bottom of the window shown in Figure 7.16. This window will show you what’s happening in the IDE when it’s building the application and deploying it to a device or device emulator.

There is also a Console panel that will show you the status of the Android SDK tools as they run. To open the panel, open the Window menu, select Show View, then select Console. You can see an example of the Console’s output in Figure 7.17. If the ADT IDE has trouble building, packaging, or deploying your application, it will let you know in the Console window. If you think you have launched the app in the emulator but nothing seems to be happening, take a look at the Console.

To run your Cordova application, right-click on the project in the Package Explorer, then select Run As. Another menu will appear as shown in Figure 7.18; select Android Application.

ADT will launch the selected Android emulator (this will take a very long time; be patient—the Android emulators are not known for being fast), then compile, package, and deploy the Cordova application to the emulator. The first time you launch an application, you will be prompted to enable automatic loading of the LogCat panel as shown in Figure 7.19.

LogCat is part of the Android SDK and collects log information from different applications running on an Android device. For some reason, Google refers to it as LogCat in some places and Logcat in others. It exists as a stand-alone application, part of the SDK, but its output is also exposed through the ADT IDE using the LogCat panel. When you enable this option, ADT will open the panel shown in Figure 7.20. For Java applications and other types of applications, the IDE offers real-time debugging and the ability to step through your code; this is not available for Cordova applications. You will want this option enabled as it’s the only way for you to be able to see what is happening with your Cordova application running within the IDE.

If the panel gets closed for any reason, you can open it by opening the Window menu, selecting Show View, then selecting Other. In the dialog that appears, select LogCat, then click the OK button to open the view.
The LogCat window will show a multitude of messages as the emulator completes its startup process and as you interact with any part of the Android OS. Look to LogCat for any error messages when you’re having trouble with an emulator or device or a running Android application. Remember from Chapter 5 that I mentioned you could have your Cordova applications write information to the console object as your application runs; on Android, those console object messages are displayed within the LogCat panel.
In the LogCat window, you can filter messages based upon their type. Notice the verbose button shown in the upper-right corner of Figure 7.21; when you click the button, a drop-down appears, allowing you to select which level of message (verbose, debug, info, warning, or error) is displayed in the view.

By default, the ADT IDE automatically creates a filter for the currently running application as shown in Figure 7.21. In this example, the application’s ID is com.ac4p.debug, so the IDE creates a filter that filters all message generated by that application. This way, you can view all messages generated by the device using the All messages option, or application-specific messages using the Session Filter shown in the figure.
You can also define your own filters. Click the plus sign shown in the Saved Filters window in Figure 7.21; the IDE will open the dialog shown in Figure 7.22. In this dialog, enter the values that define the filter that suits your particular requirements, then click the OK button to save the changes. The Saved Filters list will update to show your new filter, and you can switch between the different available filters as you work with your application.

When you launched the application, the IDE used its default configuration for running Android applications. As I described earlier in the chapter, you can have multiple emulator configurations, and you have multiple application execution configurations as well; these configurations are called Run Configurations.
To create your own Run Configurations, in the menu shown in Figure 7.18, select the Run Configurations option at the bottom of the second menu. In the dialog that appears, select Android Applications, then click the New button described in Figure 7.23.

Define the settings for the Run Configuration, assign an application to it, and determine parameters around how it launches one or more Android device emulators when it runs. In the new Run Configuration’s Android tab shown in Figure 7.24, you define settings around the application that’s executed by this Run Configuration.

In the Target tab shown in Figure 7.25, you can select which AVD is loaded or configure it so the IDE will prompt you to select the AVD at runtime. You can also configure emulator network speed simulation, wipe the emulator, and more. Click the Manager button to open the AVD Manager to create and manage the system’s emulator definitions.

With one or more Run Configurations defined, you can click the Run button shown at the bottom of the figure to launch the emulator and run your application. You can also close this dialog, then run the application on the selected Android emulator by making the appropriate selection from the Run menu or by right-clicking on the application project in the Package Explorer (shown on the left side of Figure 7.13), selecting Run As, then selecting Android Application.
Monitoring Application Activity Outside of the ADT IDE
If you don’t want to use the ADT IDE, you can run the ADT debugging tools outside of the IDE. The stand-alone version of LogCat and associated tools can be found in the Android Device Monitor (ADM) utility, which is started by opening a terminal window and executing the monitor command.
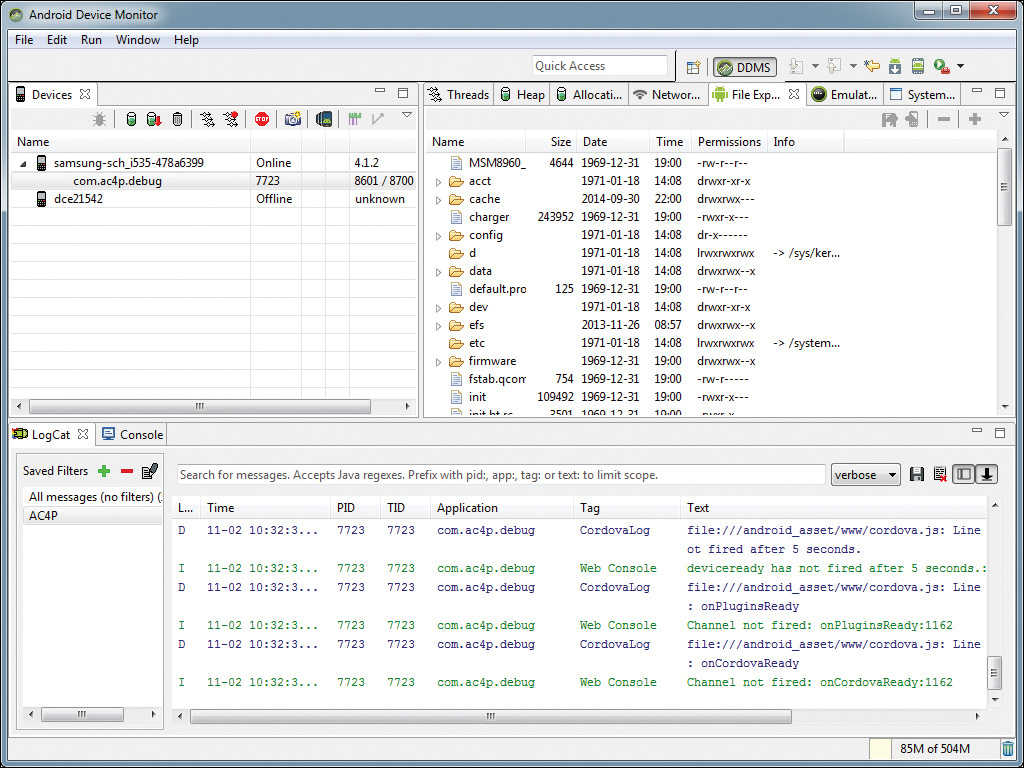
When the ADM launches, it will display a window similar to the one shown in Figure 7.26. I’m not going to cover all of the options available here, but you can see that there’s a lot of information available. The lower half of the application’s window displays the same LogCat window from the ADT IDE. In the figure, you can see that I’ve connected the ADM to an Android device emulator; I’ll show you how to connect to a physical device a little later.

Notice that the session filter shown in Figure 7.21 isn’t created automatically when using ADM.
You should spend some time poking around within the ADM; there’s a lot of power in what it provides developers.
Grabbing a Screen Shot
While not critical for developers, it’s sometimes useful to be able to pull a screen shot off of an emulator or physical device. If you look at Figure 7.26, within the Devices area in the upper-left corner of the ADM, you will see a little camera icon. With a device connected, you can click that button and grab a screen capture from the connected device. When you click the button, the ADM will display a screen similar to the one shown in Figure 7.27 (I’ve cropped the image to reduce the amount of space used for the figure).

You can use the buttons along the top of the screen to refresh, rotate, save, and copy the image. Using this feature is a quick and simple way to grab a screen image for documentation or support purposes, and it frees you from having to perform the screen capture on the device and transfer it to your PC.
Testing on a Physical Device
The ADM can also interact with a physical device just as it can with a device emulator. Initial testing of an application can be done on an emulator, but before any application is released, it should be tested on a representative sample of the physical devices the application is expected to run on.
To use a physical device with ADM, you must connect the device to the computer system running ADM using a USB cable. Before you can do that, you must first enable USB debugging on the device. The way you enable this setting will vary depending on which type of Android device you are using. On some devices, enabling developer options is accomplished by simply opening the on-device Android Settings application and making some selections. On other devices, it’s a little harder. You’re just going to have to figure this one out on your own. Sorry.
Warning
In order to be able to test on a live device, your computer system must be able to recognize an Android device when it’s connected to the system via a USB cable. If you connect a device and it’s not recognized by the system, you must resolve any connectivity issues before continuing.
In my testing on Windows, I had to manually install the Google USB driver from the SDK Manager, then in Windows Device Manager force the installation of the right driver. You can read about the steps at http://goo.gl/MYcGxD.
For a Samsung device you may need to download and install the USB drivers separately before the device will get picked up correctly by Windows. See http://goo.gl/2bBVkB for additional information.
For a Google Nexus 7 tablet, for example, you have to do some special steps before you can even access the developer settings. To enable developer mode on the Nexus 7, you have to open the Settings application and select About Tablet (it will be the very last item on the list of options on the Settings page). On the About Tablet page, scroll down until you see the Build Number item in the list. Tap on the Build Number item seven times to enable the developer options on the device. As you tap, Android will pop up a little window indicating how many more times you need to tap to enable developer mode.
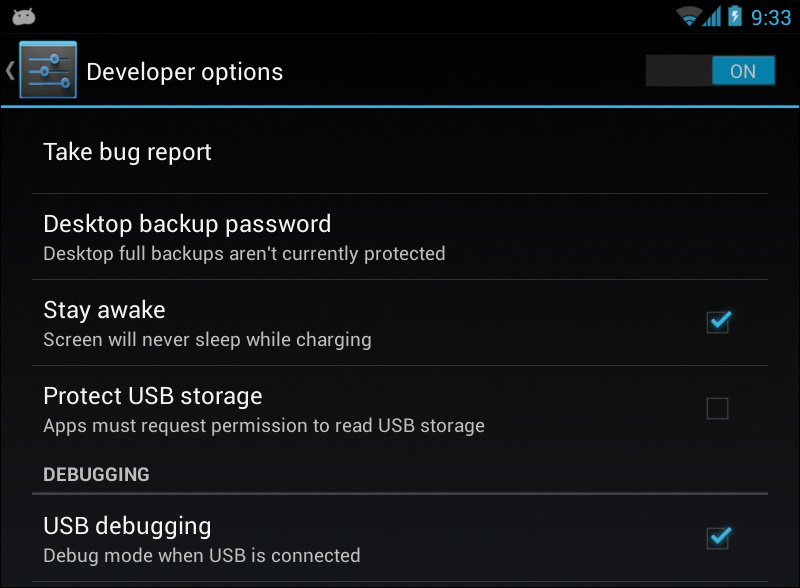
With that process completed, when you open the Settings application, you should be able to scroll down to the bottom of the list of options and see a Developer options option available as shown in Figure 7.28.

Click on Developer options and you will see a screen similar to the one shown in Figure 7.29; from here you can enable USB debugging as shown at the bottom of the figure.
With USB debugging enabled, launch the ADM, then connect the Android device to the computer system using a USB cable. After the necessary device drivers initialize (see the previous warning for information about how to deal with driver issues), ADM should connect to your device and show the connected device in its list of connected devices as shown in Figure 7.30. In this example, I’ve connected Samsung Galaxy SIII and Samsung Galaxy S4 devices.
In ADM, you have access to many of the same capabilities with a physical device as you do with a device emulator, but there are differences. Refer to the Android documentation for more information about the capabilities of ADM with a physical device. ADM is a good way to pull files from or push files to a device for testing purposes. However, much of the file structure is protected, so you won’t be able to access all file locations.
Using the Chrome Debugging Tools
Although the ADT IDE doesn’t support debugging Cordova applications, Google does provide tools that do. The Google Chrome browser includes the Chrome DevTools, which is a feature-rich web application debugger that supports debugging web applications running in a browser tab or in a WebView. Since a Cordova application runs in a WebView, Cordova applications running on Android 4.4 and higher can easily be debugged using Google Chrome. You can read more about these tools and how to use them for debugging Android web or WebView applications at http://goo.gl/hj95OR. In this section, I will show you how to debug your Cordova applications using the Chrome DevTools.
Before you can begin, you have to enable remote debugging on an Android device through Developer options in the Settings application. On Android 4.2 and later, the developer options are hidden by default, so you’ll have to unhide the option before starting. To do this, open the Settings application on the device and select About Phone. In the screen that appears, scroll down to Build Number and tap on the Build Number item seven times. When that’s done, you should have a new Developer options option in the Settings app.
Next, you will need to enable USB debugging. Open the new Developer options option and you will see an option for enabling USB debugging as shown at the bottom of Figure 7.31. Enable this option as shown in the figure and you’re ready to go.

Next, you need to open the latest version of the Chrome browser; you can download the browser from www.google.com/chrome. After you have installed the browser, you should open the Tools menu and select the Inspect devices option shown in Figure 7.32.

When you do this, Chrome will open a new browser window and display the page shown in Figure 7.33. Enable the Discover USB devices option shown in the figure and Chrome will try to connect to your device. When Chrome is able to connect to your device, it will display the device information on the page as shown in the figure.

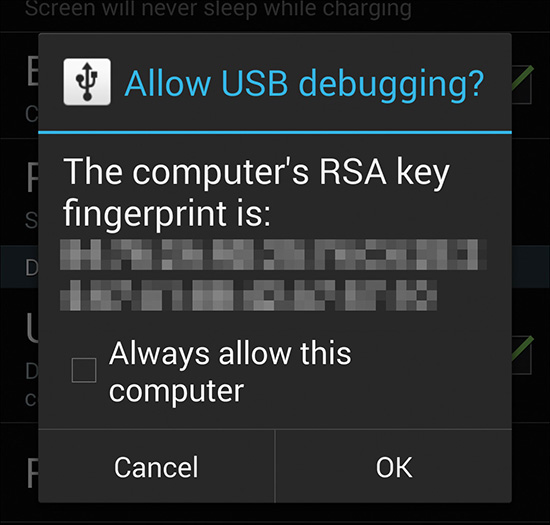
When Chrome connects to the device, the device will prompt you to accept the connection as shown in Figure 7.34. You will need to accept the connection in order to be able to remotely debug Cordova applications running on the device.
In Figure 7.33, there are no web applications running on the device. If you launch a Cordova application on the device, the browser page will update to show the running application as shown in Figure 7.35. In this example, the device is running the debug application I’ve shown in other chapters in the book.

If you click on the inspect link shown beneath the application listing in Figure 7.35, a new browser window will open and display the remote debugger shown in Figure 7.36. The inspector consists of several tabs displayed across the top of the window. Initially, the inspector launches the Console page where you can view any output from the browser console object described in Chapter 5.

The Elements tab, shown in Figure 7.37, allows you to view, edit, and interact with the HTML content of the WebView. In the figure, you can see that I’ve highlighted one of the buttons within the application I’m running on the device. You can click into the Elements window, edit the HTML content, and see it render in real time on the device.

When you highlight portions of HTML content in the Elements pane, the corresponding HTML content will be highlighted on the device as shown in Figure 7.38. This gives you an easy way to see what parts of the application are affected by the application’s markup and quickly change it to see how the application is affected.

The Sources tab allows you to interact with the web application’s JavaScript code. When you first select the tab, a blank window is displayed with instructions to press Ctrl-O to open a file. When you press the Ctrl-O keyboard combination, a list of the application’s source code files will open as displayed in Figure 7.39. Select one of the files to open it in the inspector.

At this point, the browser will open the source code file and you’ll be in a standard JavaScript debugger. You can set breakpoints as I’ve done in Figure 7.40 by clicking in the margin next to the line number. With these in place, the inspector will stop execution of the application when it reaches any of those lines.
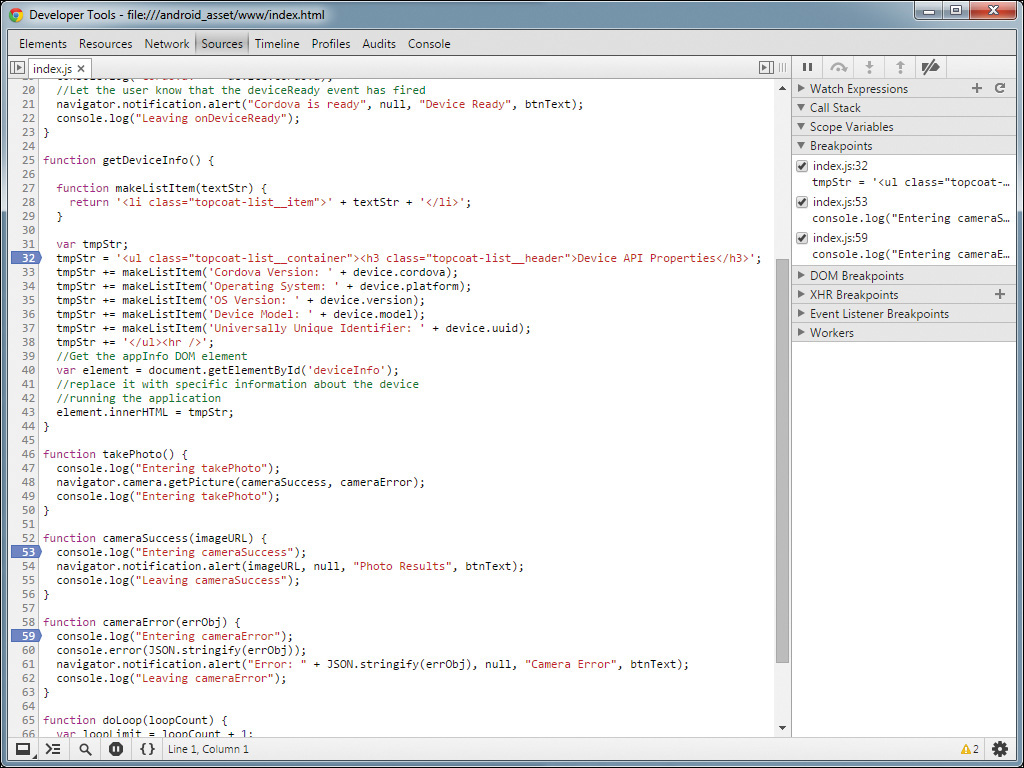
On the right side of the browser window are expandable areas you can use to interact with the web application running on the device. You can toggle the breakpoints using the expanded area shown in the figure, view variable contents, define watches, and more. Google provides a very capable debugger that can really save you some time when you’re trying to locate and fix bugs in a Cordova application.
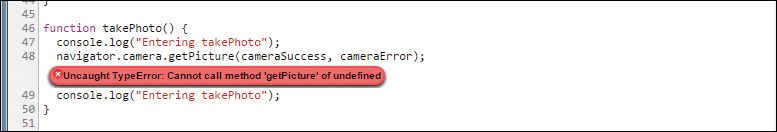
I experienced this myself as I was making the screen shots for this chapter. My debug application uses the camera, and when I tried to execute the application, it failed and the inspector showed the error highlighted in Figure 7.41. Even though I knew the application required the Camera plugin, apparently I forgot to add it to my application before trying to run it. Even though Cordova applications fail silently, as I’ve described elsewhere within this book, the inspector quickly caught the error and told me what was going on. I added the plugin to the application and was quickly back in business.
When an application is paused by the debugger, the on-device application displays a message and buttons the user can use to continue or step around the current function as shown in Figure 7.42. This is a very helpful feature that I’ve not seen in other debuggers; it’s a client-side capability that makes the debugging process simpler.

In all, Google has provided a very capable debugger for Android Cordova applications. I’ve only touched the surface of everything the Chrome DevTools can do for a developer working with web applications. Refer to the first link in this section for a more detailed explanation of the capabilities of this tool.
Wrap-Up
In this chapter, I showed you how to use the free tools available from Google that help simplify Android development for Cordova. Using these tools, you can more easily determine what’s going on within your Cordova applications and fix them.