
8. Firefox OS Development with Cordova
Of the modern, Cordova-supported mobile device platforms, Firefox OS is one of the easiest ones to use. Firefox OS applications are web applications, so there’s really no SDK to install or any special tools you need. Everything you need to package Cordova applications for deployment is handled by the Cordova CLI. Everything you need to test and debug Firefox OS applications in a simulator or on a physical device is handled by the Firefox browser.
In this chapter, I show you how to use the Firefox browser tools for working with Firefox OS applications.
Note
When working with physical devices, the Firefox App Manager works only with devices running Firefox OS 1.3 or higher. If you are using Firefox OS devices running older OSs, you will need to use the Firefox OS Simulator (http://goo.gl/NIQxqa), which is not covered in this chapter. However, it works pretty much the same way and runs in the browser like the tools I show here.
Firefox OS Developer Tools
For Cordova developers working on the Firefox OS platform, there is no SDK from Mozilla (the producer of Firefox OS); Firefox OS apps are simply web applications. Instead, most testing and debugging tasks are performed using the Firefox browser and a special tool, called the App Manager, which comes pre-installed in more recent versions of the Firefox browser. In this section, I’ll show you how to access the App Manager and install some additional tools you’ll need to work with Firefox OS applications in App Manager.
Beginning with Firefox 34, the App Manager highlighted in this chapter will be replaced by a new tool called Web IDE. The Web IDE should have similar testing and debugging capabilities to those described here; Firefox is simply adding editing capabilities that will allow a developer to create new projects and edit existing ones with this update.
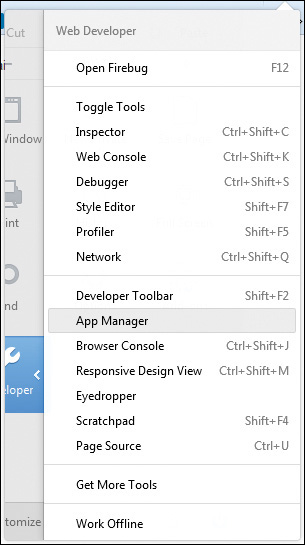
To start, you’ll need to install a copy of the Firefox desktop browser Version 26 or higher. You can download the latest version at http://goo.gl/WfY4v3. Once you have the browser installed, launch it and go through any of the initial setup steps the browser wants you to perform. When you’re all installed and looking at a browser window, click the Menu button in the upper-right corner of the browser window; the button has three horizontal lines on it as highlighted in Figure 8.1. In the window that opens, select the Developer option in the lower-left corner of the menu. On some older versions of the browser, this will be a standard text-based menu rather than the graphical one shown in the figure.

From the menu that appears, select App Manager as shown in Figure 8.2.
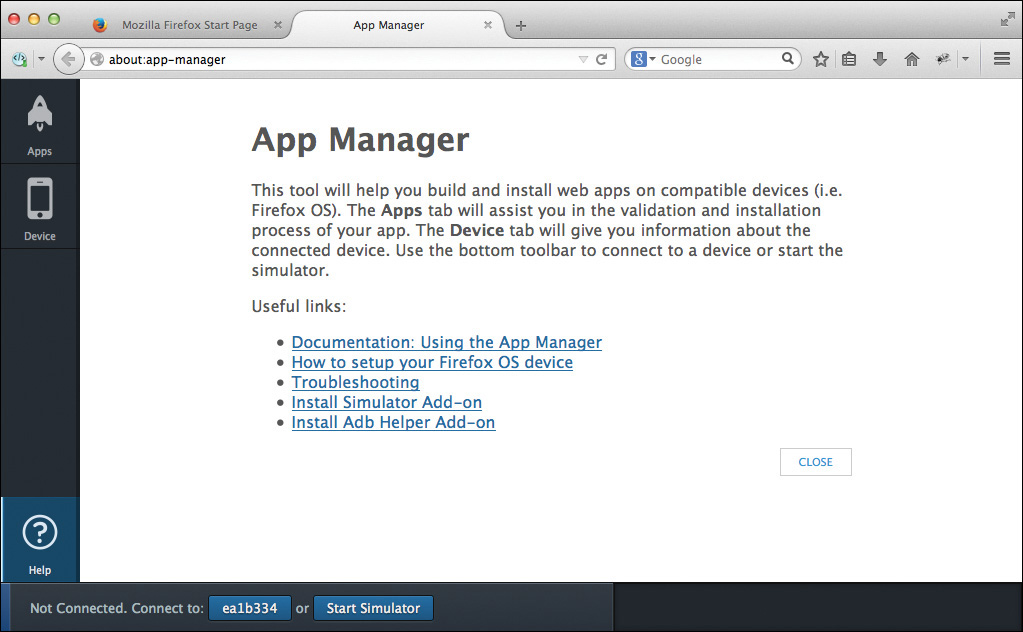
Firefox will open the App Manager window shown in Figure 8.3. This is where you will manage deploying, testing, and debugging Firefox OS applications on Firefox OS simulators or physical devices.
Another way to open the App Manager is to type about:app-manager in the Firefox address bar and press Enter. The App Manager is just a target application as far as Firefox is concerned, reachable by a URL. You can also save the App Manager as a bookmark so you can easily reach it again without having to go through the menus.
Warning
The Firefox App Manager uses part of the Android SDK to allow it to communicate with physical devices. So, you will need to have completed the Android SDK installation described in Chapter 4, “Using the Cordova Command-Line Interfaces,” to work with physical Firefox OS devices.
At this point, you have two more steps to complete: install one or more Firefox OS simulators and install the ADB Helper add-on.
To install the Firefox OS simulators, click the Install Simulator Add-on link on the help page. You will be taken to a page with information on how to install the simulators. Fortunately, the simulators are just Firefox browser add-ons, so it’s pretty easy to install them—just click on the link for the simulator you want to install and follow the prompts to add the add-on to the browser.
Another browser add-on you will need is the ADB Helper. ADB stands for Android Debug Bridge and is part of the Android SDK that allows the App Manager’s debug tools to talk to a mobile device. Click the Install ADB Helper Add-on link shown in Figure 8.3. (For some reason Mozilla isn’t treating ADB like the acronym it is and has it listed as Adb on the page shown in the figure.) You will be taken to a page with information about how to install the add-on. Remember, it’s a browser add-on, so it will install just like the simulator add-ons you’ve already installed.
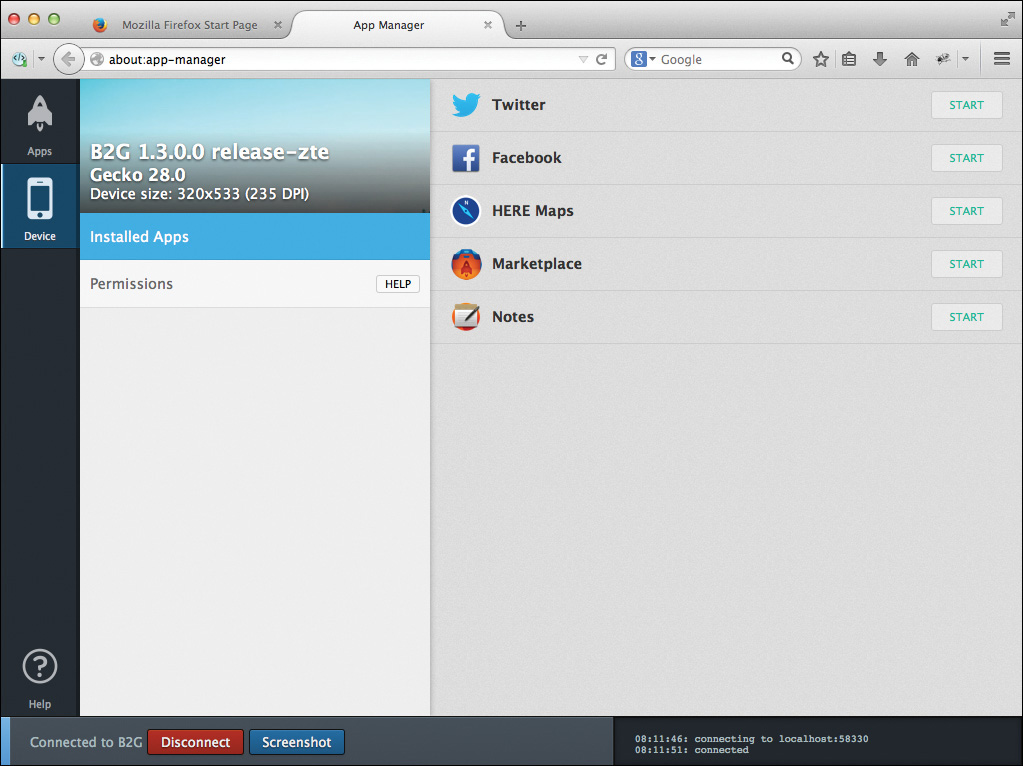
When you’ve completed the installation, click the Close button to close the App Manager help page. The browser will display the App Manager screen shown in Figure 8.4. You can open the help page again by clicking the Help button shown in the lower-left corner of Figure 8.3.
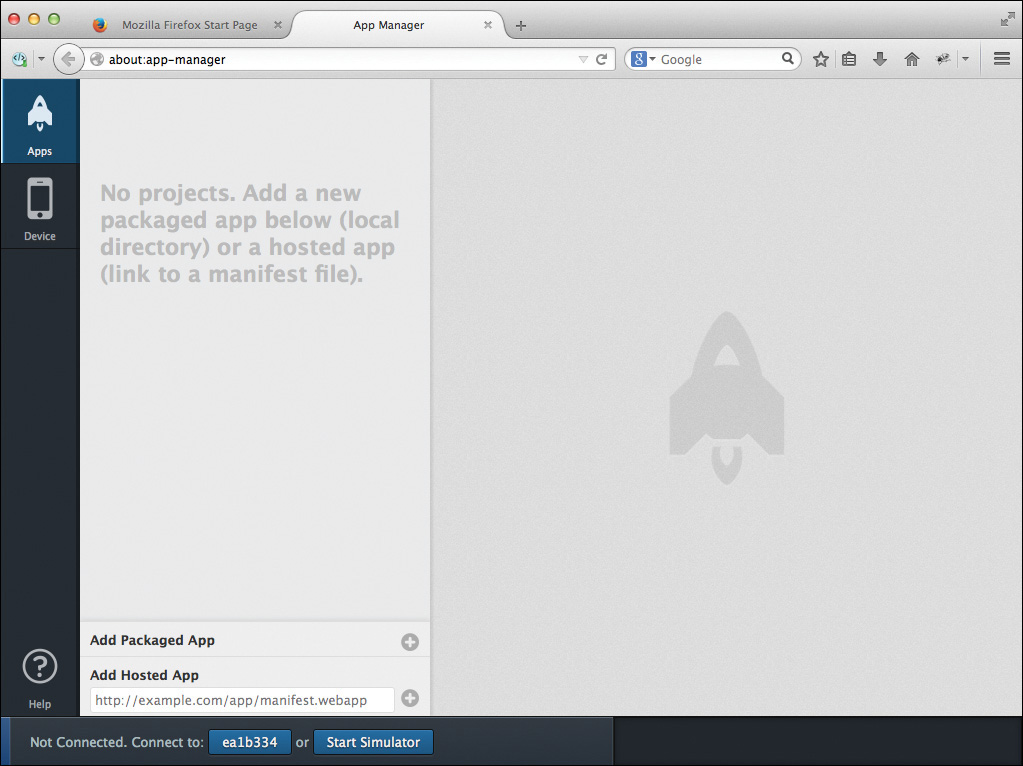
Notice the buttons at the bottom of the App Manager window: the first button, labeled ea1b334, will connect App Manager with a physical device connected to the system via a USB cable. The device has a physical ID of ea1b334; in this example, it’s a ZTE Open device I have connected to the system. The Start Simulator button will launch the Firefox OS simulator in a separate window.
In the next section, I’ll show you how to use App Manager to interact with the simulator.
Debugging with the Firefox OS Simulator
The Mozilla team has worked really hard to make testing Firefox OS applications in a simulator a very easy process. In this section, I’ll show you how to launch the simulator and leverage the Firefox App Manager debugging tools to interact with your application as it runs in the simulator. In the section that follows, I’ll show how to do this with a physical device; the debugging process is the same, so the skills you learn here will apply there as well.
Note
In Chapter 4 I showed you how to use the Cordova CLI run or emulate command to execute Cordova applications on a device or a device simulator. Unfortunately, the emulate command won’t work for Firefox OS applications; you have to keep a Firefox browser window open and run your applications through it.
After you’ve created a new Cordova application for Firefox OS and edited the application content, you’re ready to test the application. Before you begin, be sure to open a terminal window, navigate to the Cordova application folder, and issue the cordova prepare command which will copy the web application content to the necessary mobile device platform folders as described in Chapter 5, “The Mechanics of Cordova Development.” With the web application content copied into the project’s platforms/firefoxos folder, you’re ready to begin testing.
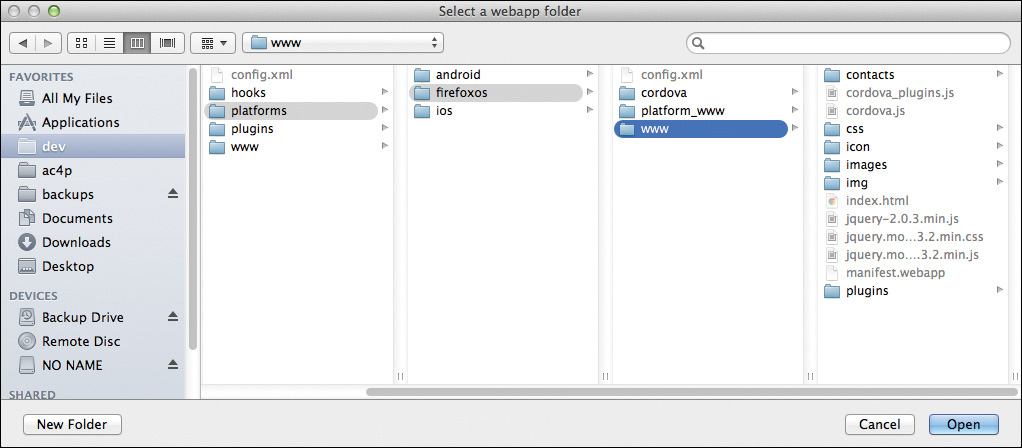
In the Firefox App Manager, click the Add Packaged App item shown in the lower-left corner of Figure 8.4. The system’s standard folder browser window will appear; navigate to the project’s platforms/firefoxos/www folder and click the Open button as shown in Figure 8.5.
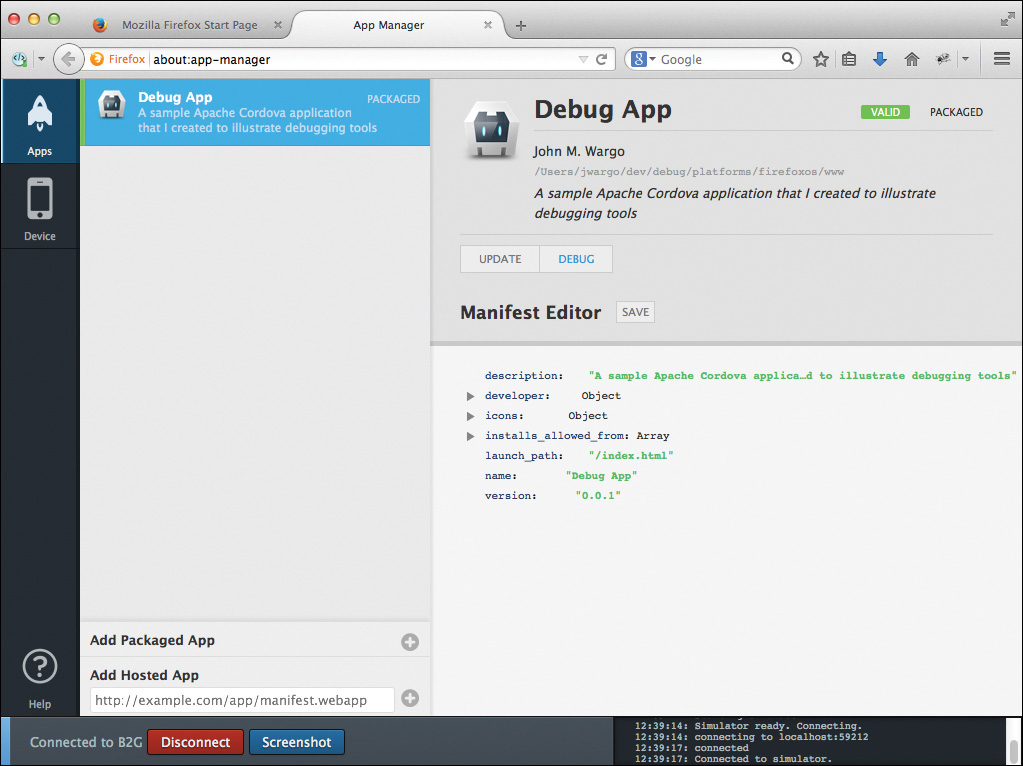
The App Manager window will update and show you information about the Cordova application you selected as shown in Figure 8.6. On the far left is a navigator that allows you to switch between apps and devices. In the remainder of the window’s space is a list of applications that have been loaded, in this case one, and on the far right is information about the selected application.

The Manifest Editor (bottom portion of the application screen) allows you to configure properties for the application. The manifest file is created for you automatically during the Cordova CLI’s prepare step; information from the Cordova project’s config.xml file is copied into the Firefox OS project’s manifest.webapp file and displayed here.
You shouldn’t make changes to the file here since those changes will be overwritten the next time you execute prepare. Instead, make the changes in the Cordova project’s config.xml and let the properties propagate to the different platforms’ projects through prepare.
On Windows you may notice that App Manager displays a warning indicating that the icons are missing from the manifest. This error appeared on Windows but not OS X; it’s a bug that should be fixed by the time you read this.
Right now there’s not a lot you can do with this application since App Manager hasn’t connected to a simulator or physical device. So, since this section of the chapter is about the simulator, let’s start one. At the bottom of Figure 8.6 are two buttons; click the one that says Start Simulator. Some options will appear as shown in Figure 8.7. Essentially what this shows is a list of the different Firefox OS simulator add-ons you installed earlier.
Warning
I had issues with Norton Antivirus on Windows blocking some of the simulator files. You may find that you will need to disable your antivirus software when debugging using the simulator.
It doesn’t really matter which one you pick; for my system I clicked the Firefox OS 1.4 button. The Firefox App Manager will open the browser window shown in Figure 8.8.

With the App Manager connected to a device or a simulator, you can click on the Device icon in the navigator in the left side of the App Manager window. The pane that opens will show the list of applications installed on the device as shown in Figure 8.9. You can also start the application from here by clicking the Start button next to the application.
When you click the Permissions button, App Manager will open a pane that lists all of the application permission settings as shown in Figure 8.10. You can edit permissions here; if you need to make any permission changes, you’ll have to make them in the application’s manifest. You can learn more about Firefox OS App Permissions at http://goo.gl/yVMwBV.

If you click the Update button shown in Figure 8.6, the selected application will deploy to the simulator and you will be able to view the application’s icon on the home screen as shown in Figure 8.11.

Now that there’s a device connected (it’s only a simulated one now, but that’s enough), the UI for the App Manager will update as shown in Figure 8.12. The Debug button is used to initiate a debug session with the device running the application.
When you click the Debug button, the App Manager will open a new icon in the navigation area on the left for the application that is running on the simulator as shown in Figure 8.13. The main portion of the browser window will open a set of tabs you will use to interact with the application. In the Console tab shown in the figure, you can see the console output written by the application and the simulator as it does its work. In this example, you can see that the simulator has installed proxies for three of the plugins I’ve added to my application. You can also see the output from the index.js shown in the window—that is the content outputted by my application code to help me understand what the application is doing as it runs.

The buttons above the Console window can be used to filter the content displayed in the window. If you click the drop-down indicator next to the JS button, you will be able to select whether to display error and/or warning messages.
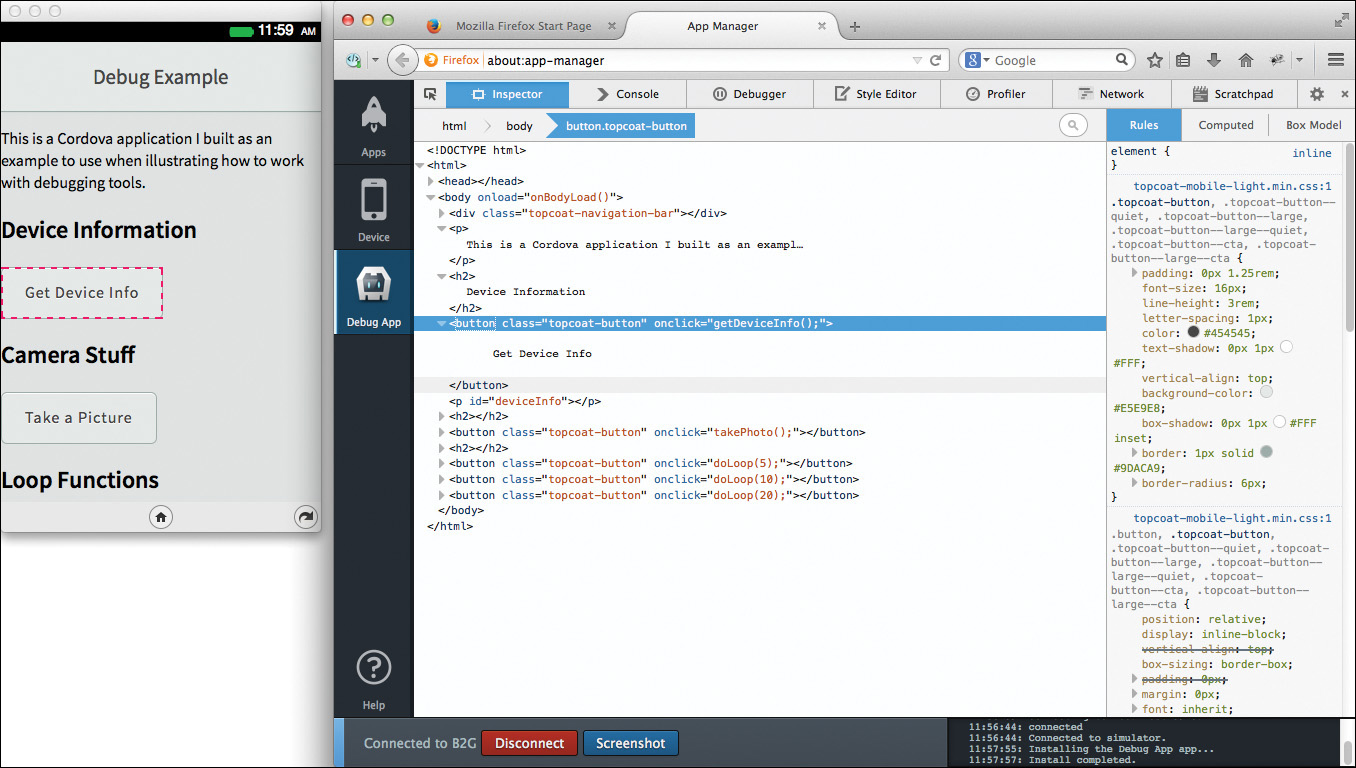
The Inspector window shown in Figure 8.14 allows you view the application’s HTML content and edit it just as you were able to do with weinre and GapDebug (described in Chapter 5). In the figure, you can see that I’ve highlighted the div that encloses the main image on the page; in the simulator it draws a red dashed line around the selected element in the application.
In the Debugger window shown in Figure 8.15, you can view the application’s JavaScript files and interact with them. In this example, I’ve set breakpoints inside of several of the functions in the application’s JavaScript code by clicking in the margin next to the lines where I want to set the breakpoints.

When the application runs, JavaScript execution will halt on each of the marked lines; then I can use the buttons highlighted in the upper-left corner of the Debugger window to step through the code as needed. The first button is the Pause button, followed by Step Over, Step Into, and Step Out buttons.
The Pause button halts application execution; it will change to a Continue button once the code is halted, allowing you to continue execution. The Step Over button allows you to execute a function without stepping through the code in the function; the function executes and returns to the debugger once execution has completed. The Step Into button allows you to execute the code in a function by stepping through each line individually, and the Step Out button will complete execution of the current function.
Click the icon highlighted on the upper-right corner of the Debugger window to open a panel that provides options for defining watches, viewing variable values, and viewing DOM events bound by your code. These tools give you detailed information about what’s happening within your code and should enable you to quickly get to the root of any issues.
Warning
In my testing, I found that the Sources pane in the Debugger window would not list any files until I reloaded the application by clicking the Update button shown in Figure 8.6. Ideally this will be fixed by the time you read this.
When running an application on Firefox OS, dialogs look much different from the way they do on other platforms. Figure 8.16 shows the results of using the JavaScript alert function in a Cordova application. Notice how the “dialog” covers the entire window.
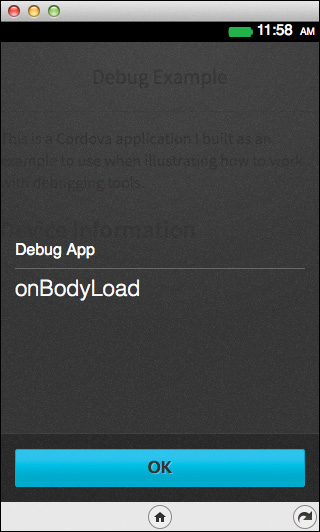
Calls to the Cordova alert method will display the results shown in Figure 8.17.

I’ve hit only some of the highlights of this tool; there’s a whole lot more the Firefox App Manager can do to help you test and debug your Cordova applications. You can find much more detailed instructions on how to use all of the features of App Manager at http://goo.gl/JzSXQQ.
Debugging Applications on a Firefox OS Device
Debugging Firefox OS applications on a physical device is no different from what you have already seen; the capabilities available to you are exactly the same. The only difference is in the initial setup and how you connect the device to the debugger.
Before you can use a physical device with the App Manager’s debugging tools, you must first enable remote debugging on the device. To do this, open the device’s Settings application, then Device Information. In the Device Information page, tap on More Information. On the More Information page is an option for Developer settings as shown at the bottom of Figure 8.18.

On the Developer page shown in Figure 8.19, enable the Remote debugging checkbox; with this enabled, you’re ready to start debugging Cordova applications on the device.

To use a physical device with App Manager, simply connect the device to the system running App Manager using a USB cable. After the device drivers install, you should see the device listed as one of the options in the bottom of the App Manager window as shown in Figure 8.3. In this case, my device is a ZTE Open C, Firefox OS 1.3 device called ea1b334.
When you click the Device button, App Manager will connect to the device, and all of the other testing and debugging capabilities I described in the previous section will be available to you.
Be sure that the Firefox OS device you’re using is compatible with App Manager. As I started this chapter, I had a Firefox OS device lying around that I used for some application testing for Apache Cordova 3 Programming. I plugged it in and spent hours trying to figure out why the App Manager saw the device but wouldn’t connect to it. The device I had was a Firefox OS 1.0 device, and App Manager requires Firefox OS 1.2 or higher. Save yourself some trouble and check the device’s OS version before trying to make it work with App Manager.
Wrap-Up
In this chapter, I showed you how to use the free tools available from Mozilla to test and debug your Cordova applications for Firefox OS. You now have the information you need to test Firefox OS applications using the Firefox OS simulator or a physical device.