
Ensuring that Solr is meeting the SLA expectations for performance is the goal of monitoring. Solr provides both RESTful and JMX hooks to allow you to integrate Solr into your enterprise monitoring platform.
Note
Don't have your own monitoring platform? There are two offerings, available from New Relic (http://newrelic.com) and Sematext (http://sematext.com/spm/) that provide a comprehensive monitoring solution. Both are cloud based (SaaS) and communicate via a small agent installed into Solr that provides a wealth of statistics and analysis about the JVM, as well as Solr specific metrics such as request response time and throughput, cache hit rate, and indexing performance.
From the admin interface, when you click on the Plugins / Stats link, you get a list of all the plugins for Solr, and can drill down by plugin and get detailed information, including any custom components you develop! However, what isn't immediately obvious is that this information is actually being served up to the browser as JSON data that is consumed by the Admin page. This means, if you perform a GET request, you can return the data in whichever format you want, based on the wt parameter:
>>curl "http://localhost:8983/solr/mbartists/admin/mbeans?stats=true&cat=CACHE&wt=xml&indent=true"
Open the downloaded file and you will see all the data as XML. The following is an excerpt of the statistics available for the cache that stores individual documents and the standard request handler, where the metrics you might want to monitor are highlighted:
<entry>
   <name>documentCache</name>
   <class>org.apache.solr.search.LRUCache</class>
   <version>1.0</version>
   <description>LRU Cache(maxSize=512, initialSize=512)</description>
   <stats>
      <stat name="lookups">3251</stat>
      <stat name="hits">3101</stat>
      <stat name="hitratio">0.95</stat>
      <stat name="inserts">160</stat>
      <stat name="evictions">0</stat>
      <stat name="size">160</stat>
      <stat name="warmupTime">0</stat>
      <stat name="cumulative_lookups">3251</stat>
      <stat name="cumulative_hits">3101</stat>
      <stat name="cumulative_hitratio">0.95</stat>
      <stat name="cumulative_inserts">150</stat>
      <stat name="cumulative_evictions">0</stat>
   </stats>
</entry>
<entry>
   <name>standard</name>
   <class>org.apache.solr.handler.component.SearchHandler</class>
   <version>$Revision: 1052938 $</version>
   <description>Search using components: org.apache.solr.handler.component.QueryComponent, org.apache.solr.handler.component.FacetComponent
   </description>
   <stats>
      <stat name="handlerStart">1298759020886</stat>
      <stat name="requests">359</stat>
      <stat name="errors">0</stat>
      <stat name="timeouts">0</stat>
      <stat name="totalTime">9122</stat>
      <stat name="avgTimePerRequest">25.409472</stat>
      <stat name="avgRequestsPerSecond">0.446995</stat>
   </stats>
</entry>
While integrating into each monitoring system will be different, as an example, you can look at ./examples/11/check_solr.rb for a simple Ruby script that queries a core and checks whether the average hit ratio and the average time per request are above certain thresholds:
>> ./check_solr.rb -w 13 -c 20 –I mbartists
CRITICAL - Average Time per request more than 20 milliseconds old: 39.5
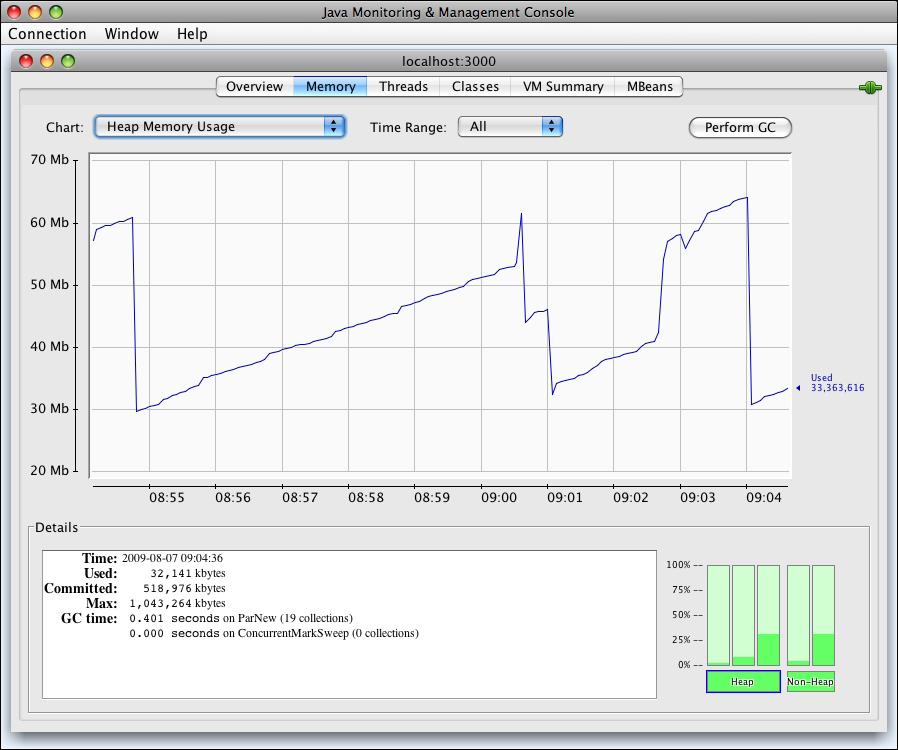
Java Management Extensions (JMX) is a Java standard API for monitoring and managing applications and network services. Originally meant to help with server administration, it was added to J2SE Version 5. JMX-enabled applications and services expose information and available operations for resources such as MBeans (Managed Bean). MBeans can be managed remotely by a wide variety of management consoles such as the JConsole GUI that comes with Java and the web-based JMX Console that comes with the JBoss application server. Here is a screenshot of a nice sawtooth pattern of memory usage that you want from Solr; as you can see, garbage collection kicks in on a regular basis:
Solr exposes information about its components through MBeans. However, actual management operations, such as re-indexing information, are not exposed through JMX. You can leverage JMX to monitor the status of Solr, such as finding out how many documents have been indexed. In large enterprise environments, the JMX standard simplifies integrating monitoring tasks into existing monitoring platforms.
In solrconfig.xml, the <jmx/> tag needs to be uncommented to enable JMX support. In order to actually start up with JMX, you need to provide some extra parameters to support remote connections, including the port to be connected to:
>>java - Dcom.sun.management.jmxremote - Dcom.sun.management.jmxremote.port=3000 - Dcom.sun.management.jmxremote.ssl=false - Dcom.sun.management.jmxremote.authenticate=false -jar start.jar
However, this configuration is totally insecure. In a production environment, you would want to require usernames and passwords for access. For more information, please refer to the JMX documentation at http://java.sun.com/j2se/1.5.0/docs/guide/management/agent.html#remote.
J2SE ships with JConsole, a GUI client for connecting to JMX servers. In order to start it, run the following command:
>> [JDK_HOME]/bin/jconsole
In order to connect to Solr, choose the Remote tab, and enter localhost for Host or IP and 3000 for Port. As we have started without requiring authentication, you do not need to enter a username and password.
For Solr, the key tabs to use in JConsole are Memory and MBeans. Memory provides a visual charting of the consumption of memory and can help you monitor low memory situations and when to start optimizing your indexes (as discussed in Chapter 9, Integrating Solr).
You can also monitor the various components of Solr by choosing the MBeans tab. In order to find out how many documents you've indexed, you would look at the SolrIndexSearch Mbean. Select solr from the tree listing on the left, and drill down to the searcher folder and select the org.apache.solr.search.SolrIndexSearcher component. You will see information such as the number of documents, and how many are marked deleted (it's the difference between maxDocs and numDocs). While you can pull this type of information out of the admin statistics web page, the JMX standard provides a much simpler method that can be easily integrated into other tools.
In order to save yourself typing in the extra startup parameters, see the previous Jetty startup integration section for how to add these JMX startup parameters, such as -Dcom.sun.management.jmxremote to your Jetty configuration.