
Chapter 6. Getting Input from Sensors
6.0. Introduction
Getting and using input from sensors enables Arduino to respond to or report on the world around it. This is one of the most common tasks you will encounter. This chapter provides simple and practical examples of how to use the most popular input devices and sensors. Wiring diagrams show how to connect and power the devices, and code examples demonstrate how to use data derived from the sensors.
Sensors respond to input from the physical world and convert this into an electrical signal that Arduino can read on an input pin. The nature of the electrical signal provided by a sensor depends on the kind of sensor and how much information it needs to transmit. Some sensors (such as photoresistors and Piezo knock sensors) are constructed from a substance that alters their electrical properties in response to physical change. Others are sophisticated electronic modules that use their own microcontroller to process information before passing a signal on for the Arduino.
Sensors use the following methods to provide information:
- Digital on/off
Some devices, such as the tilt sensor in Recipe 6.1 and the motion sensor in Recipe 6.3, simply switch a voltage on and off. These can be treated like the switch recipes shown in Chapter 5.
- Analog
Other sensors provide an analog signal (a voltage that is proportional to what is being sensed, such as temperature or light level). The recipes for detecting light (Recipe 6.2), motion (Recipes 6.1 and 6.3), vibration (Recipe 6.6), sound (Recipe 6.7), and acceleration (Recipe 6.18) demonstrate how analog sensors can be used. All of them use the
analogReadcommand that is discussed in Chapter 5.- Pulse width
Distance sensors, such as the PING))) in Recipe 6.4, provide data using pulse duration proportional to the distance value. Applications using these sensors measure the duration of a pulse using the
pulseIncommand.- Serial
Some sensors provide values using a serial protocol. For example, the RFID reader in Recipe 6.9 and the GPS in Recipe 6.14 communicate through the Arduino serial port (see Chapter 4 for more on serial). Most Arduino boards only have one hardware serial port, so read Recipe 6.14 for an example of how you can add additional software serial ports if you have multiple serial sensors or the hardware serial port is occupied for some other task.
- Synchronous protocols: I2C and SPI
The I2C and SPI digital standards were created for microcontrollers like Arduino to talk to external sensors and modules. Recipe 6.16 shows how a compass module is connected using synchronous digital signaling. These protocols are used extensively for sensors, actuators, and peripherals, and they are covered in detail in Chapter 13.
There is another generic class of sensing devices that you may make use of. These are consumer devices that contain sensors but are sold as devices in their own right, rather than as sensors. Examples of these in this chapter include a PS/2 mouse and a PlayStation game controller. These devices can be very useful; they provide sensors already incorporated into robust and ergonomic devices. They are also inexpensive (often less expensive than buying the raw sensors that they contain), as they are mass-produced. You may have some of these lying around.
If you are using a device that is not specifically covered in a recipe, you may be able to adapt a recipe for a device that produces a similar type of output. Information about a sensor’s output signal is usually available from the company from which you bought the device or from a data sheet for your device (which you can find through a Google search of the device part number or description).
Data sheets are aimed at engineers designing products to be manufactured, and they usually provide more detail than you need to just get the product up and running. The information on output signal will usually be in a section referring to data format, interface, output signal, or something similar. Don’t forget to check the maximum voltage (usually in a section labeled “Absolute Maximum Ratings”) to ensure that you don’t damage the component.
Warning
Sensors designed for a maximum of 3.3 volts can be destroyed by connecting them to 5 volts. Check the absolute maximum rating for your device before connecting.
Reading sensors from the messy analog world is a mixture of science, art, and perseverance. You may need to use ingenuity and trial and error to get a successful result. A common problem is that the sensor just tells you a physical condition has occurred, not what caused it. Putting the sensor in the right context (location, range, orientation) and limiting its exposure to things that you don’t want to activate it are skills you will acquire with experience.
Another issue concerns separating the desired signal from background noise; Recipe 6.6 shows how you can use a threshold to detect when a signal is above a certain level, and Recipe 6.7 shows how you can take the average of a number of readings to smooth out noise spikes.
See Also
For information on connecting electronic components, see Make: Electronics by Charles Platt (Make).
See the introduction to Chapter 5 and Recipe 5.6 for more on reading analog values from sensors.
6.1. Detecting Movement
Solution
This sketch uses a switch that closes a circuit when tilted, called a tilt sensor. The switch recipes in Chapter 5 (Recipes 5.1 and 5.2) will work with a tilt sensor substituted for the switch.
The sketch below (circuit shown in Figure 6-1) will switch on the LED attached to pin 11 when the tilt sensor is tilted one way, and the LED connected to pin 12 when it is tilted the other way:
/*
tilt sketch

  a tilt sensor attached to pin 2 lights one of
  the LEDs connected to pins 11 and 12 depending
  on which way the sensor is tilted
*/

const int tiltSensorPin = 2;             //pin the tilt sensor is connected to
const int firstLEDPin = 11;              //pin for one LED
const int secondLEDPin = 12;             //pin for the other

void setup()
{
  pinMode (tiltSensorPin, INPUT);        //the code will read this pin
  digitalWrite (tiltSensorPin, HIGH);    //and use a pull-up resistor

  pinMode (firstLEDPin, OUTPUT);         //the code will control this pin
  pinMode (secondLEDPin, OUTPUT);        //and this one
}void loop()
{
  if (digitalRead(tiltSensorPin)){       //check if the pin is high
    digitalWrite(firstLEDPin, HIGH);     //if it is high turn on firstLED
    digitalWrite(secondLEDPin, LOW);     //and turn off secondLED
  }
  else{                                  //if it isn't
    digitalWrite(firstLEDPin, LOW);      //do the opposite
    digitalWrite(secondLEDPin, HIGH);
  }
}
Discussion
The most common tilt sensor is a ball bearing in a box with contacts at one end. When the box is tilted the ball rolls away from the contacts and the connection is broken. When the box is tilted to roll the other way the ball touches the contacts and completes a circuit. Markings, or pin configurations, show which way the sensor should be oriented. Tilt sensors are sensitive to small movements of around 5 to 10 degrees when oriented with the ball just touching the contacts. If you position the sensor so that the ball bearing is directly above (or below) the contacts, the LED state will only change if it is turned right over. This can be used to tell if something is upright or upside down.
To determine if something is being shaken, you need to check how long it’s been since the state of the tilt sensor changed (this recipe’s Solution just checks if the switch was open or closed). If it hasn’t changed for a time you consider significant, the object is not shaking. Changing the orientation of the tilt sensor will change how vigorous the shaking needs to be to trigger it. The following code lights an LED when the sensor is shaken:
/*
  shaken sketch
  tilt sensor connected to pin 2
  led connected to pin 13
*/

const int tiltSensorPin = 2;
const int ledPin = 13;
int tiltSensorPreviousValue = 0;
int tiltSensorCurrentValue = 0;
long lastTimeMoved = 0;
int shakeTime=50;

void setup()
{
  pinMode (tiltSensorPin, INPUT);
  digitalWrite (tiltSensorPin, HIGH);
  pinMode (ledPin, OUTPUT);
}

void loop()
{
  tiltSensorCurrentValue=digitalRead(tiltSensorPin);
  if (tiltSensorPreviousValue != tiltSensorCurrentValue){
    lastTimeMoved = millis();
    tiltSensorPreviousValue = tiltSensorCurrentValue;
  }

  if (millis() - lastTimeMoved < shakeTime){
    digitalWrite(ledPin, HIGH);
  }
  else{
    digitalWrite(ledPin, LOW);
  }
}
Many mechanical switch sensors can be used in similar ways. A float switch can turn on when the water level in a container rises to a certain level (similar to the way a ball cock works in a toilet cistern). A pressure pad such as the one used in shop entrances can be used to detect when someone stands on it. If your sensor turns a digital signal on and off, something similar to this recipe’s sketch should be suitable.
See Also
Chapter 5 contains background information on using switches with Arduino.
Recipe 12.2 has more
on using the millis function to
determine delay.
6.2. Detecting Light
Problem
You want to detect changes in light levels. You may want to detect a change when something passes in front of a light detector or to measure the light level—for example, detecting when a room is getting too dark.
Solution
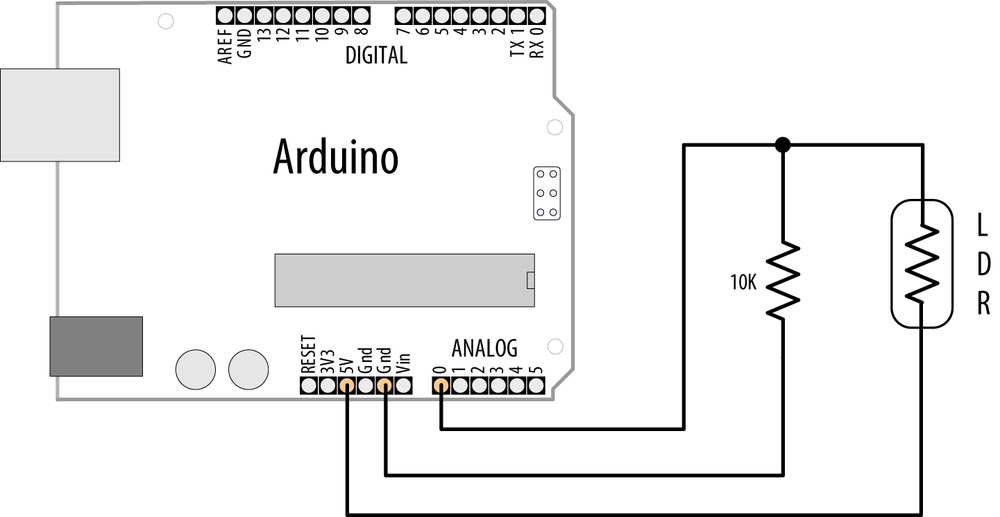
The easiest way to detect light levels is to use a light dependent resistor (LDR). This changes resistance with changing light levels, and when connected in the circuit shown in Figure 6-2 it produces a change in voltage that the Arduino analog input pins can sense.
The sketch for this recipe is simple:
const int ledPin =  13;     // LED connected to digital pin 13
const int sensorPin = 0;    // connect sensor to analog input 0

void setup()
{
  pinMode(ledPin, OUTPUT);  // enable output on the led pin
}

void loop()
{
  int rate = analogRead(sensorPin);    // read the analog input
  digitalWrite(ledPin, HIGH);   // set the LED on
  delay(rate);                  // wait duration dependent on light level
  digitalWrite(ledPin, LOW);    // set the LED off
  delay(rate);
}
Discussion
The circuit for this recipe is the standard way to use any sensor that changes its resistance based on some physical phenomenon (see Chapter 5 for background information on responding to analog signals). With the circuit in Figure 6-2, the voltage on analog pin 0 changes as the resistance of the LDR changes with varying light levels.
A circuit such as this will not give the full range of possible values from the analog input—0 to 1,023—as the voltage will not be swinging from 0 volts to 5 volts. This is because there will always be a voltage drop across each resistance, so the voltage where they meet will never reach the limits of the power supply. When using sensors such as these, it is important to check the actual values the device returns in the situation you will be using it. Then you have to determine how to convert them to the values you need to control whatever you are going to control. See Recipe 5.7 for more details on changing the range of values.
The LDR is a simple kind of sensor called a resistive sensor. A range of resistive sensors respond to changes in different physical characteristics. Similar circuits will work for other kinds of simple resistive sensors, although you may need to adjust the resistor to suit the sensor.
Choosing the best resistor value depends on the LDR you are using and the range of light levels you want to monitor. Engineers would use a light meter and consult the data sheet for the LDR, but if you have a multimeter, you can measure the resistance of the LDR at a light level that is approximately midway in the range of illumination you want to monitor. Note the reading and choose the nearest convenient resistor to this value.
See Also
This sketch was introduced in Recipe 1.6; see that Recipe for more on this and variations on this sketch.
6.3. Detecting Motion (Integrating Passive Infrared Detectors)
Solution
Use a motion sensor such as a Passive Infrared (PIR) sensor to change values on a digital pin when someone moves nearby.
Sensors such as the SparkFun PIR Motion Sensor (SEN-08630) and the Parallax PIR Sensor (555-28027) can be easily connected to Arduino pins, as shown in Figure 6-3.
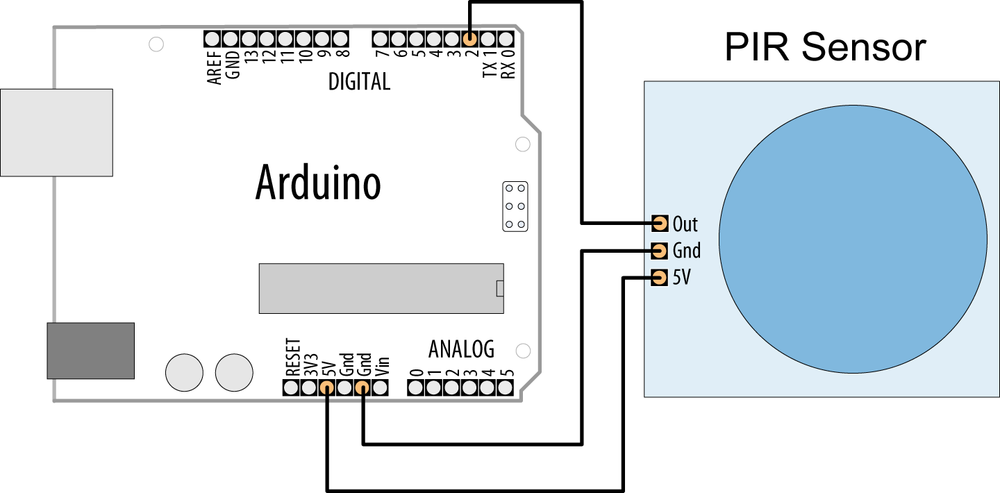
Check the data sheet for your sensor to identify the correct pins. The Parallax sensor has pins marked “OUT,” “-,” and “+” (for Output, Gnd, and +5V). The SparkFun sensor is marked with “Alarm,” “GND,” and “DC” (for Output, Gnd, and +5V).
The following sketch will light the LED on Arduino pin 13 when the sensor detects motion:
/*
   PIR sketch
   a Passive Infrared motion sensor connected to pin 2
   lights the LED on pin 13
*/

const int ledPin = 13;            // choose the pin for the LED
const int inputPin = 2;           // choose the input pin (for the PIR sensor)

void setup() {
  pinMode(ledPin, OUTPUT);         // declare LED as output
  pinMode(inputPin, INPUT);        // declare pushbutton as input
}

void loop(){
  int val = digitalRead(inputPin);  // read input value
  if (val == HIGH)                  // check if the input is HIGH
  {
    digitalWrite(ledPin, HIGH);     // turn LED on if motion detected
    delay(500);
    digitalWrite(ledPin, LOW);      // turn LED off
  }
}
Discussion
This code is similar to the pushbutton examples shown in Chapter 5. That’s because the sensor acts like a switch when motion is detected. Different kinds of PIR sensors are available, and you should check the information for the one you have connected.
Some sensors, such as the Parallax, have a jumper that
determines how the output behaves when motion is detected. In one
mode, the output remains HIGH while
motion is detected, or it can be set so that the output goes HIGH briefly and then LOW when triggered. The example sketch in
this recipe’s Solution will work in either mode.
Other sensors may go LOW on
detecting motion. If your sensor’s output pin goes LOW when motion is detected, change the line
that checks the input value so that the LED is turned on when LOW:
if (val == LOW) // motion when the input is LOW
PIR sensors come in a variety of styles and are sensitive over different distances and angles. Careful choice and positioning can make them respond to movement in part of a room, rather than all of it.
Note
PIR sensors respond to heat and can be triggered by animals such as cats and dogs, as well as by people and other heat sources.
6.4. Measuring Distance
Problem
You want to measure the distance to something, such as a wall or someone walking toward the Arduino.
Solution
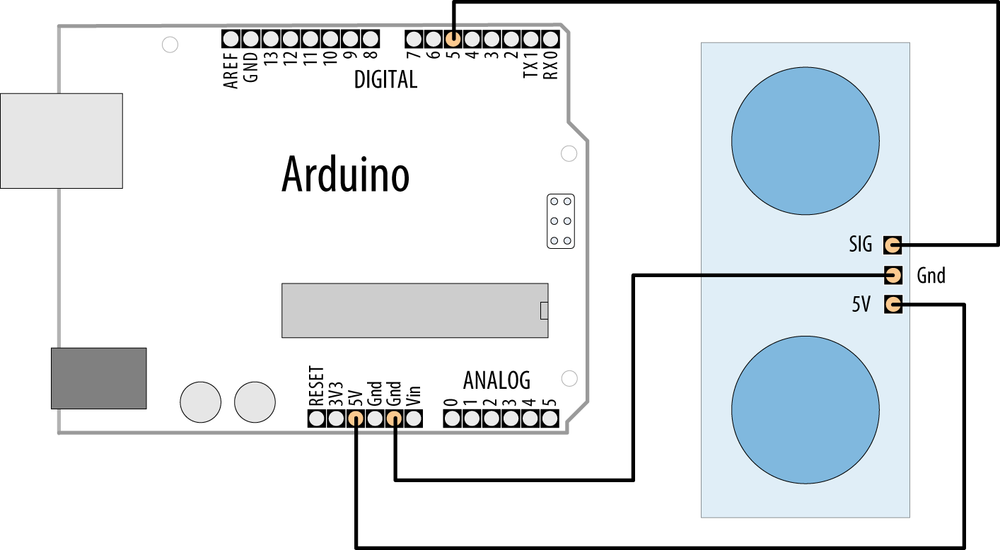
This recipe uses the popular Parallax PING))) ultrasonic distance sensor to measure the distance of an object ranging from 2 centimeters to around 3 meters. It displays the distance on the Serial Monitor and flashes an LED faster as objects get closer (Figure 6-4 shows the connections):
/* Ping))) Sensor
 * prints distance and changes LED flash rate
 * depending on distance from the Ping))) sensor
 */


const int pingPin = 5;
const int ledPin  = 13; // pin connected to LED

void setup()
{
  Serial.begin(9600);
  pinMode(ledPin, OUTPUT);
}

void loop()
{
  int cm = ping(pingPin) ;
  Serial.println(cm);
  digitalWrite(ledPin, HIGH);
  delay(cm * 10 ); // each centimeter adds 10 milliseconds delay
  digitalWrite(ledPin, LOW);
  delay( cm * 10);
}

// following code based on  http://www.arduino.cc/en/Tutorial/Ping
// returns the distance in cm
int ping(int pingPin)
{
  // establish variables for duration of the ping,
  // and the distance result in inches and centimeters:
  long duration, cm;

  // The PING))) is triggered by a HIGH pulse of 2 or more microseconds.
  // Give a short LOW pulse beforehand to ensure a clean HIGH pulse:
  pinMode(pingPin, OUTPUT);
  digitalWrite(pingPin, LOW);
  delayMicroseconds(2);
  digitalWrite(pingPin, HIGH);
  delayMicroseconds(5);
  digitalWrite(pingPin, LOW);

  pinMode(pingPin, INPUT);
  duration = pulseIn(pingPin, HIGH);

  // convert the time into a distance
  cm = microsecondsToCentimeters(duration);
  return cm ;
}

long microsecondsToCentimeters(long microseconds)
{
  // The speed of sound is 340 m/s or 29 microseconds per centimeter.
  // The ping travels out and back, so to find the distance of the
  // object we take half of the distance travelled.
  return microseconds / 29 / 2;
}
Discussion
Ultrasonic sensors provide a measurement of the time it takes for sound to bounce off an object and return to the sensor.
The “ping” sound pulse is generated when the pingPin level goes HIGH for two microseconds. The sensor will
then generate a pulse that terminates when the sound returns. The
width of the pulse is proportional to the distance the sound traveled
and the sketch then uses the pulseIn function to
measure that duration. The speed of sound is 340 meters per second,
which is 29 microseconds per centimeter. The formula for the distance
of the round trip is: RoundTrip = microseconds / 29
So, the formula for the one-way distance in centimeters is: microseconds / 29 / 2
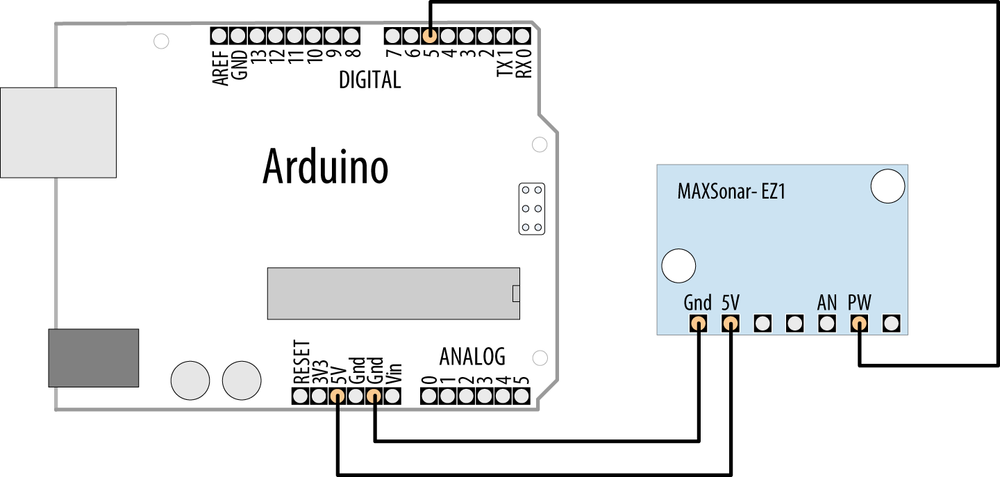
The MaxBotix EZ1 is another ultrasonic sensor that can be used to measure distance. It is easier to integrate than the Ping))) because it does not need to be “pinged.” It can provide continuous distance information, either as an analog voltage or proportional to pulse width. Figure 6-5 shows the connections.
The sketch that follows uses the EZ1 pulse width (PW) output to produce output similar to that of the previous sketch:
/*
 * EZ1Rangefinder Distance Sensor
 * prints distance and changes LED flash rate
 * depending on distance from the Ping))) sensor
 */

const int sensorPin = 5;
const int ledPin  = 13; // pin connected to LED

long value = 0;
int cm = 0;
int inches = 0;

void setup()
{
  Serial.begin(9600);
  pinMode(ledPin, OUTPUT);
}

void loop()
{
  value = pulseIn(sensorPin, HIGH) ;
  cm = value / 58;        // pulse width is 58 microseconds per cm
  inches = value / 147;   // which is 147 microseconds per inch
  Serial.print(cm);
  Serial.print(','),
  Serial.println(inches);

  digitalWrite(ledPin, HIGH);
  delay(cm * 10 ); // each centimeter adds 10 milliseconds delay
  digitalWrite(ledPin, LOW);
  delay( cm * 10);

  delay(20);
}
The EZ1 is powered through +5V and ground pins and these are
connected to the respective Arduino pins. Connect the EZ1 PW pin to
Arduino digital pin 5. The sketch measures the width of the pulse with
the pulseIn command. The width of
the pulse is 58 microseconds per centimeter, or 147 microseconds per
inch.
Note
You may need to add a capacitor across the +5V and Gnd lines to stabilize the power supply to the sensor if you are using long connecting leads. If you get erratic readings, connect a 10 uF capacitor at the sensor (see Appendix C for more on using decoupling capacitors).
You can also obtain a distance reading from the EZ1 through its
analog output—connect the AN pin to an analog input
and read the value with analogRead. The
following code prints the analog input converted to inches:
   value = analogRead(0);
   inches = value / 2;   // each digit of analog read is around 5mv
   Serial.println(inches);
The analog output is around 9.8mV per inch. The value from
analogRead is around 4.8mV per unit (see Recipe 5.6 for more on analogRead) and the preceding code rounds
these so that each group of two units is one inch. The rounding error
is small compared to the accuracy of the device, but if you want a
more precise calculation you can use floating point as follows:
   value = analogRead(0);
   float mv = (value /1024.0) * 5000 ;
   float inches  =  mv / 9.8; // 9.8mv per inch
   Serial.println(inches) ;
See Also
Recipe 5.6 explains how to convert
readings from analogInput into
voltage values.
The Arduino reference for pulseIn: http://www.arduino.cc/en/Reference/PulseIn
6.5. Measuring Distance Accurately
Problem
You want to measure how far objects are from the Arduino with more accuracy than in Recipe 6.4.
Solution
Infrared (IR) sensors generally provide an analog output that can be measured
using analogRead. They can
have greater accuracy than ultrasonic sensors, albeit with a smaller
range (a range of 10 centimeters to 1 or 2 meters is typical for IR
sensors). This sketch provides similar functionality to Recipe 6.4, but it uses an infrared sensor—the
Sharp GP2Y0A02YK0F (Figure 6-6 shows the
connections):
/* ir-distance sketch
 * prints distance and changes LED flash rate based on distance from IR sensor
 */

const int ledPin    = 13; // the pin connected to the LED to flash
const int sensorPin = 0;  // the analog pin connected to the sensor

const long referenceMv = 5000; // long int to prevent overflow when multiplied

void setup()
{
  Serial.begin(9600);
  pinMode(ledPin, OUTPUT);
}

void loop()
{
  int val = analogRead(sensorPin);
  int mV = (val * referenceMv) / 1023;

  Serial.print(mV);
  Serial.print(",");
  int cm = getDistance(mV);
  Serial.println(cm);

  digitalWrite(ledPin, HIGH);
  delay(cm * 10 ); // each centimeter adds 10 milliseconds delay
  digitalWrite(ledPin, LOW);
  delay( cm * 10);

  delay(100);
}

// the following is used to interpolate the distance from a table
// table entries are distances in steps of 250 millivolts
const int TABLE_ENTRIES = 12;
const int firstElement = 250; // first entry is 250 mV
const int INTERVAL  = 250; // millivolts between each element
static int distance[TABLE_ENTRIES] = {150,140,130,100,60,50,40,35,30,25,20,15};

int getDistance(int mV)
{
   if( mV >  INTERVAL * TABLE_ENTRIES-1 )
      return distance[TABLE_ENTRIES-1];
   else
   {
      int index = mV / INTERVAL;
      float frac = (mV % 250) / (float)INTERVAL;
      return distance[index] - ((distance[index] - distance[index+1]) * frac);
   }
}
Discussion
The output from the IR sensor is not linear—in other words, the
value read from analogRead is not
proportional to distance. So, the calculation is more complicated than
the one used in Recipe 6.4. The sketch in
this recipe’s Solution uses a table to interpolate the actual distance
by finding the nearest entry in the table and adjusting it based on
the ratio of the measured value to the next table entry (this
technique is called interpolating). You may need to
adjust the table values for your sensor—you can do this with information
from your data sheet or through trial and error.
Note
As values for the table can be found by trial and error (measuring the voltage until it changes by the required amount, and then measuring the distance), this technique can also be used when you don’t have an equation to interpret the values—for example, when you don’t have a data sheet for the device you are using.
The conversion from voltage to distance is done in this function:
int getDistance(int mV)
The function first checks if the value is within the range given in the table. The shortest valid distance is returned if the value is not within range:
   if( mV > INTERVAL * TABLE_ENTRIES-1 )
      return distance[TABLE_ENTRIES-1]; //TABLE_ENTRIES-1 is last valid entry
If the value is within the table range, integer division calculates which entry is closest but is lower than the reading:
int index = mV / INTERVAL ;
The modulo operator (see Chapter 3) is used to calculate a fractional value when a reading falls between two entries:
float frac = (mV % 250) / (float)INTERVAL;

return distance[index] - ((distance[index] - distance[index+1]) * frac);
The last line in the getDistance function
uses the index and fraction to calculate and return a distance value.
It reads the value from the table, and then adds a proportion of that
value based on the frac value. This
final element is an approximation, but as it is for a small range of
the result, it gives acceptable results. If it is not accurate enough
for you, you need to produce a table with more values closer
together.
A table can also be used to improve performance if the calculation takes significant time to complete, or is done repeatedly with a limited number of values. Calculations, particularly with floating point, can be slow. Replacing the calculation with a table can speed things up.
The values can either be hardcoded into the sketch, like this
one, or be calculated in setup().
This may make the sketch take longer to start, but as this only
happens once each time the Arduino gets power, you will then get a
speed gain every time around the main loop(). The trade-off for the speed is that
the table consumes memory—the bigger the table, the more RAM memory
used. See Chapter 17 for
help using Progmem to store data in
program memory.
Note
You may need to add a capacitor across the +5V and Gnd lines to stabilize the power supply to the sensor if you are using long connecting leads. If you get erratic readings, connect a 10 uF capacitor at the sensor (see Appendix C for more on using decoupling capacitors).
See Also
A detailed explanation of the Sharp IR sensor is available at http://www.societyofrobots.com/sensors_sharpirrange.shtml.
6.6. Detecting Vibration
Solution
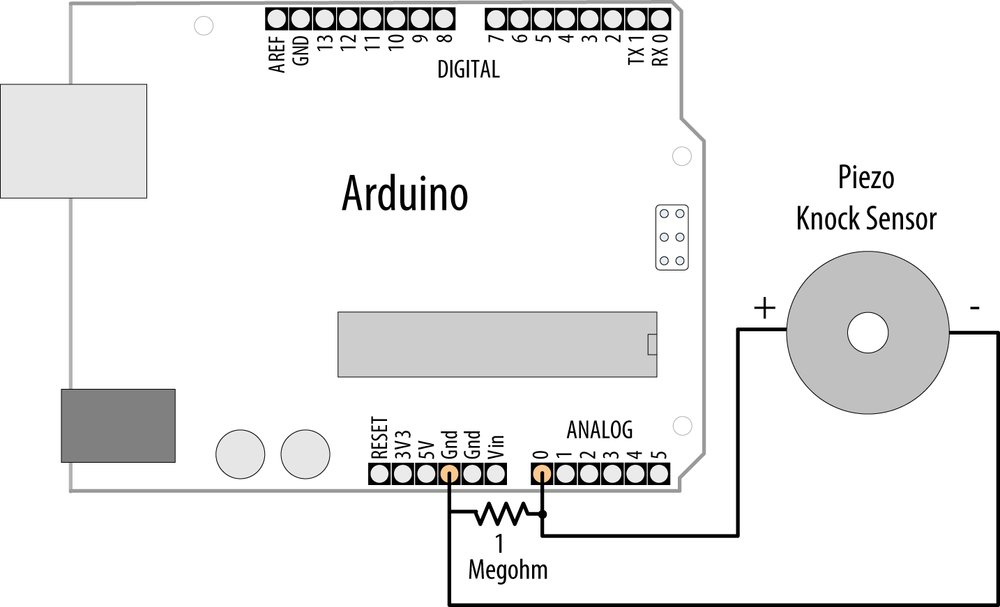
A Piezo sensor responds to vibration. It works best when connected to a larger surface that vibrates. Figure 6-7 shows the connections:
/* piezo sketch
 * lights an LED when the Piezo is tapped
 */

const int sensorPin = 0;  // the analog pin connected to the sensor
const int ledPin  = 13;     // pin connected to LED
const int THRESHOLD = 100;


void setup()
{
   pinMode(ledPin, OUTPUT);
}

void loop()
{
  int val = analogRead(sensorPin);
  if (val >= THRESHOLD)
  {
    digitalWrite(ledPin, HIGH);
    delay(100);  // to make the LED visible
  }
  else
    digitalWrite(ledPin, LOW);
}
Discussion
A Piezo sensor, also known as a knock sensor, produces a voltage in response to physical stress. The more it is stressed, the higher the voltage. The Piezo is polarized and the positive side (usually a red wire or a wire marked with a “+”) is connected to the analog input; the negative wire (usually black or marked with a “–”) is connected to ground. A high-value resistor (1 megohm) is connected across the sensor.
The voltage is detected by Arduino analogRead to turn
on an LED (see Chapter 5 for more about the
analogRead function). The THRESHOLD value determines the level from
the sensor that will turn on the LED, and you can decrease or increase
this value to make the sketch more or less sensitive.
Piezo sensors can be bought in plastic cases or as bare metal disks with two wires attached. The components are the same; use whichever fits your project best.
Some sensors, such as the Piezo, can be driven by the Arduino to produce the thing that they can sense. Chapter 9 has more about using a Piezo to generate sound.
6.7. Detecting Sound
Solution
This recipe uses the BOB-08669 breakout board for the Electret Microphone (SparkFun). Connect the board as shown in Figure 6-8 and load the code to the board.

The built-in LED on Arduino pin 13 will turn on when you clap, shout, or play loud music near the microphone. You may need to adjust the threshold—use the Serial Monitor to view the high and low values, and change the threshold value so that it is between the high values you get when noise is present and the low values when there is little or no noise. Upload the changed code to the board and try again:
/*
microphone sketch

SparkFun breakout board for Electret Microphone is connected to analog pin 0
*/

const int ledPin = 13;            //the code will flash the LED in pin 13
const int middleValue = 512;      //the middle of the range of analog values
const int numberOfSamples = 128;  //how many readings will be taken each time

int sample;                       //the value read from microphone each time
long signal;                      //the reading once you have removed DC offset
long averageReading;              //the average of that loop of readings

long runningAverage=0;          //the running average of calculated values
const int averagedOver= 16;     //how quickly new values affect running average
                                //bigger numbers mean slower

const int threshold=400;        //at what level the light turns onvoid setup() {
  pinMode(ledPin, OUTPUT);
  Serial.begin(9600);
}

void loop() {
  long sumOfSquares = 0;
  for (int i=0; i<numberOfSamples; i++) { //take many readings and average them
    sample = analogRead(0);               //take a reading
    signal = (sample - middleValue);      //work out its offset from the center
    signal *= signal;                     //square it to make all values positive
    sumOfSquares += signal;               //add to the total
  }
  averageReading = sumOfSquares/numberOfSamples;     //calculate running average
  runningAverage=(((averagedOver-1)*runningAverage)+averageReading)/averagedOver;

  if (runningAverage>threshold){         //is average more than the threshold ?
    digitalWrite(ledPin, HIGH);          //if it is turn on the LED
  }else{
    digitalWrite(ledPin, LOW);           //if it isn't turn the LED off
  }
  Serial.println(runningAverage);        //print the value so you can check it
}
Discussion
A microphone produces very small electrical signals. If you connected it straight to the pin of an Arduino, you would not get any detectable change. The signal needs to be amplified first to make it usable by Arduino. The SparkFun board has the microphone with an amplifier circuit built in to amplify the signal to a level readable by Arduino.
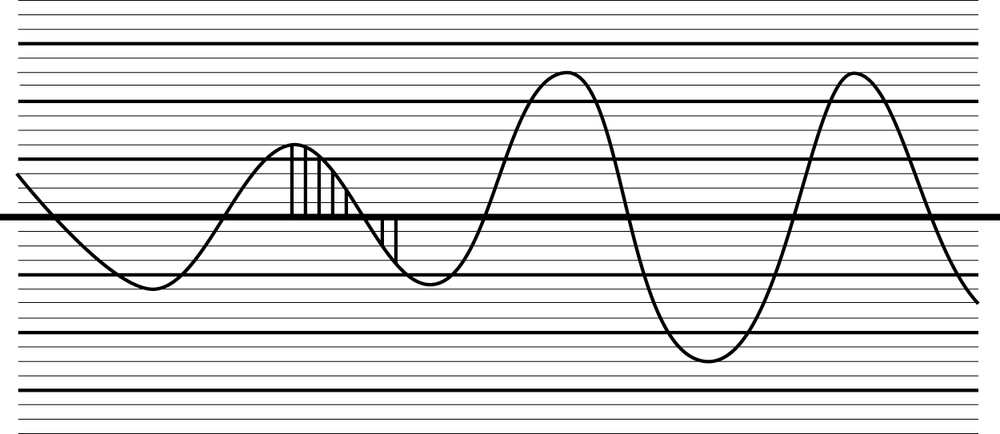
Because you are reading an audio signal in this recipe, you will
need to do some additional calculations to get useful information. An
audio signal is changing fairly quickly, and the value returned
by analogRead will
depend on what point in the undulating signal you take a reading. If
you are unfamiliar with using analogRead, see Chapter 5 and Recipe 6.2. An example waveform for an audio tone is
shown in Figure 6-9. As
time changes from left to right, the voltage goes up and down in a
regular pattern. If you take readings at the three different times
marked on it, you will get three different values. If you used this to
make decisions, you might incorrectly conclude that the signal got
louder in the middle.
An accurate measurement requires multiple readings taken close together. The peaks and troughs increase as the signal gets bigger. The difference between the bottom of a trough and the top of a peak is called the amplitude of the signal, and this increases as the signal gets louder.

To measure the size of the peaks and troughs, you measure the
difference between the midpoint voltage and the levels of the peaks
and troughs. You can visualize this midpoint value as a line running
midway between the highest peak and the lowest trough, as shown in
Figure 6-10. The line
represents the DC offset of the signal (it’s the DC value when there
are no peaks or troughs). If you subtract the DC offset value from
your analogRead values, you get the
correct reading for the signal amplitude.
As the signal gets louder, the average size of these values will increase, but as some of them are negative (where the signal has dropped below the DC offset), they will cancel each other out, and the average will tend to be zero. To fix that, we square each value (multiply it by itself). This will make all the values positive, and it will increase the difference between small changes, which helps you evaluate changes as well. The average value will now go up and down as the signal amplitude does.
To do the calculation, we need to know what value to use for the DC offset. To get a clean signal, the amplifier circuit for the microphone will have been designed to have a DC offset as close as possible to the middle of the possible range of voltage so that the signal can get as big as possible without distorting. The code assumes this and uses the value 512 (right in the middle of the analog input range of 0 to 1,023).
The values of variables at the top of the sketch can be varied if the sketch does not trigger well for the level of sound you want.
The numberOfSamples is set at
128—if it is set too small, the average may not adequately cover
complete cycles of the waveform and you will get erratic readings. If
the value is set too high, you will be averaging over too long a time,
and a very short sound might be missed as it does not produce enough
change once a large number of readings are averaged. It could also
start to introduce a noticeable delay between a sound and the light
going on. Constants used in calculations, such as numberOfSamples and averagedOver, are set to powers of 2 (128
and 16, respectively). Try to use values evenly divisible by two for
these to give you the fastest performance (see Chapter 3 for more on math functions).
6.8. Measuring Temperature
Problem
You want to display the temperature or use the value to control a device; for example, to switch something on when the temperature reaches a threshold.
Solution
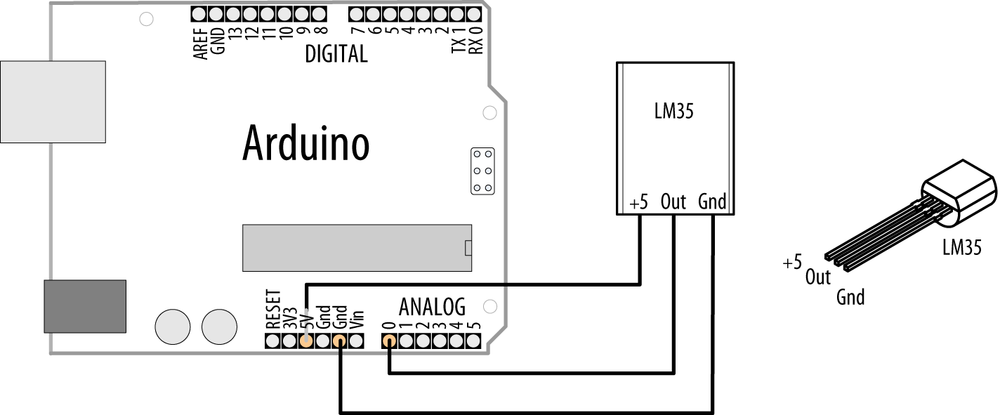
This recipe displays the temperature in Fahrenheit and Celsius (Centigrade) using the popular LM35 heat detection sensor. The sensor looks similar to a transistor and is connected as shown in Figure 6-11:
/*
 lm35 sketch
 prints the temperature to the Serial Monitor
 */

const int inPin = 0; // analog pin


void setup()
{
  Serial.begin(9600);
}


void loop()
{
  int value = analogRead(inPin);
  Serial.print(value); Serial.print(" > ");
  float millivolts = (value / 1024.0) * 5000;
  float celsius = millivolts / 10;  // sensor output is 10mV per degree Celsius
  Serial.print(celsius);
  Serial.print(" degrees Celsius, ");

  Serial.print( (celsius * 9)/ 5 + 32 );  //  converts to fahrenheit
  Serial.println(" degrees Fahrenheit");

  delay(1000); // wait for one second

}
Discussion
The LM35 temperature sensor produces an analog voltage directly proportional to temperature with an output of 1 millivolt per 0.1°C (10mV per degree).
The sketch converts the analogRead values
into millivolts (see Chapter 5) and divides this by 10
to get degrees.
The sensor accuracy is around 0.5°C, and in many cases you can use integer math instead of floating point.
The following sketch triggers pin 13 when the temperature is above a threshold:
const int inPin = 0;  // sensor connected to this analog pin
const int outPin = 13;  // digital output pin

const int threshold = 25; // the degrees celsius that will trigger the output pin


void setup()
{
  Serial.begin(9600);
  pinMode(outPin, OUTPUT);
}


void loop()
{
  int value = analogRead(inPin);
  long celsius =  (value * 500L) /1024;     // 10 mV per degree c, see text
  Serial.print(celsius);
  Serial.print(" degrees Celsius: ");
  if(celsius > threshold)
  {
     digitalWrite(outPin, HIGH);
     Serial.println("pin is on");
  }
  else
  {
     digitalWrite(outPin, LOW);
     Serial.println("pin is off");
  }
  delay(1000); // wait for one second
}
The sketch uses long (32-bit) integers to calculate the value. The letter L after the number causes the calculation to be performed using long integer math, so the multiplication of the maximum temperature (500 on a 5V Arduino) and the value read from the analog input does not overflow. See the recipes in Chapter 5 for more about converting analog levels into voltage values.
If you need the values in Fahrenheit, you could use the LM34 sensor, as this produces an output in Fahrenheit, or you can convert the values in this recipe using the following formula:
float f = (celsius * 9)/ 5 + 32 );
An alternative sensor for measuring temperature is the LM335. The device looks similar to the LM35 but it is wired and used differently.
The LM335 output is 10mV per degree Kelvin, so zero degrees Celsius results in 2.731 volts. A series resistor is required to set the operating current. A 2K ohm resistor is often used, but 2.2K ohms can also be used. Here is a sketch that displays temperature using the LM335 (Figure 6-12 shows the connections):
/*
  lm335 sketch
  prints the temperature to the Serial Monitor
 */

const int inPin = 0; // analog pin


void setup()
{
  Serial.begin(9600);
}


void loop()
{
  int value = analogRead(inPin);
  Serial.print(value); Serial.print(" > ");
  float millivolts = (value / 1024.0) * 5000;
  // sensor output is 10mV per degree Kelvin, 0 Celsius is 273.15
  float celsius = (millivolts / 10) - 273.15 ;

  Serial.print(celsius);
  Serial.print(" degrees Celsius, ");

  Serial.print( (celsius * 9)/ 5 + 32 );  //  converts to fahrenheit
  Serial.println(" degrees Fahrenheit");

  delay(1000); // wait for one second
}
You can improve the accuracy by wiring the unconnected adj pin to the slider of a 10K potentiometer with the other leads connected to +5V and Gnd. Adjust the pot to get a reading to match a known accurate thermometer.
See Also
LM35 data sheet: http://www.national.com/ds/LM/LM35.pdf
LM335 data sheet: http://www.national.com/ds/LM/LM135.pdf
6.9. Reading RFID Tags
Solution
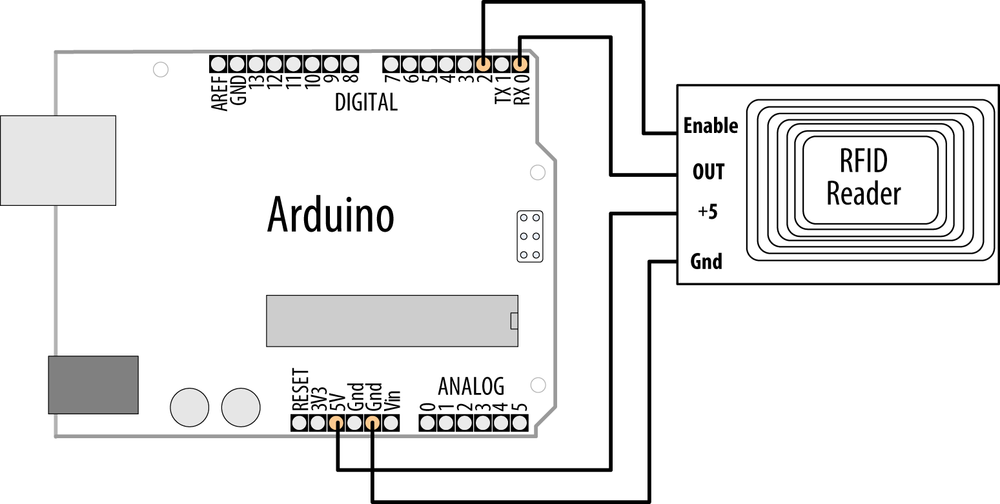
Figure 6-13 shows a Parallax RFID (radio frequency identification) reader connected to the Arduino serial port. (You may need to disconnect the reader from the serial port when uploading the sketch.)
Note
This reader works with 125kHz tags. If you are using a different reader, check the documentation to ensure correct connections and usage.
The sketch reads and displays the value of an RFID tag:
/*
 RFID sketch
 Displays the value read from an RFID tag
 */

const int startByte   = 10;  // ASCII line feed precedes each tag
const int endByte     = 13;  // ASCII carriage return terminates each tag
const int tagLength   = 10;  // the number of digits in tag
const int totalLength = tagLength + 2; //tag length + start and end bytes

char tag[tagLength + 1];  // holds the tag and a terminating null

int bytesread = 0;

void setup()
{
  Serial.begin(2400);    // set this to the baud rate of your RFID reader
  pinMode(2,OUTPUT);     // connected to the RFID ENABLE pin
  digitalWrite(2, LOW);  // enable the RFID reader
}

void loop()
{
  if(Serial.available() >= totalLength)  // check if there's enough data
  {
    if(Serial.read() == startByte)
    {
      bytesread = 0;                // start of tag so reset count to 0
      while(bytesread < tagLength)  // read 10 digit code
      {
        int val = Serial.read();
        if((val == startByte)||(val == endByte))  // check for end of code
          break;
        tag[bytesread] = val;
         bytesread = bytesread + 1; // ready to read next digit
      }
      if( Serial.read() == endByte)  // check for the correct end character
      {
        tag[bytesread] = 0; // terminate the string
        Serial.print("RFID tag is: ");
        Serial.println(tag);
      }
    }
  }
}
Discussion
A tag consists of a start character followed by a 10-digit tag and is terminated by an end character. The sketch waits for a complete tag message to be available and displays the tag if it is valid. The tag is received as ASCII digits (see Recipe 4.4 for more on receiving ASCII digits). You may want to convert this into a number if you want to store or compare the values received. To do this, change the last few lines as follows:
      if( Serial.read() == endByte)  // check for the correct end character
      {
        tag[bytesread] = 0; // terminate the string
        long tagValue = atol(tag);  // convert the ASCII tag to a long integer
        Serial.print("RFID tag is: ");
        Serial.println(tagValue);
      }
RFID stands for radio frequency identification, and as the name implies, it is sensitive to radio frequencies and can be prone to interference. The code in this recipe’s Solution will only use code of the correct length that contains the correct start and end bits, which should eliminate most errors. But you can make the code more resilient by reading the tag more than once and only using the data if it’s the same each time. (RFID readers such as the Parallax will repeat the code while a valid card is near the reader.) To do this, add the following lines to the last few lines in the preceding code snippet:
if( Serial.read() == endByte)  // check for the correct end character
{
  tag[bytesread] = 0; // terminate the string
  long tagValue = atol(tag);  // convert the ASCII tag to a long integer
  if (tagValue == lastTagValue)
  {
    Serial.print("RFID tag is: ");
    Serial.println(tagValue);
    lastTagValue = tagValue;
  }
}
You will need to add the declaration for lastTagValue at the top of the
sketch:
long lastTagValue=0;
This approach is similar to the code from Recipe 5.3. It means you will only get confirmation of a card if it is presented long enough for two readings to be taken, but false readings will be less likely. You can avoid accidental triggering by making it necessary for the card to be present for a certain amount of time before the number is reported.
6.10. Tracking Rotary Movement
Problem
You want to measure and display the rotation of something to track its speed and/or direction.
Solution
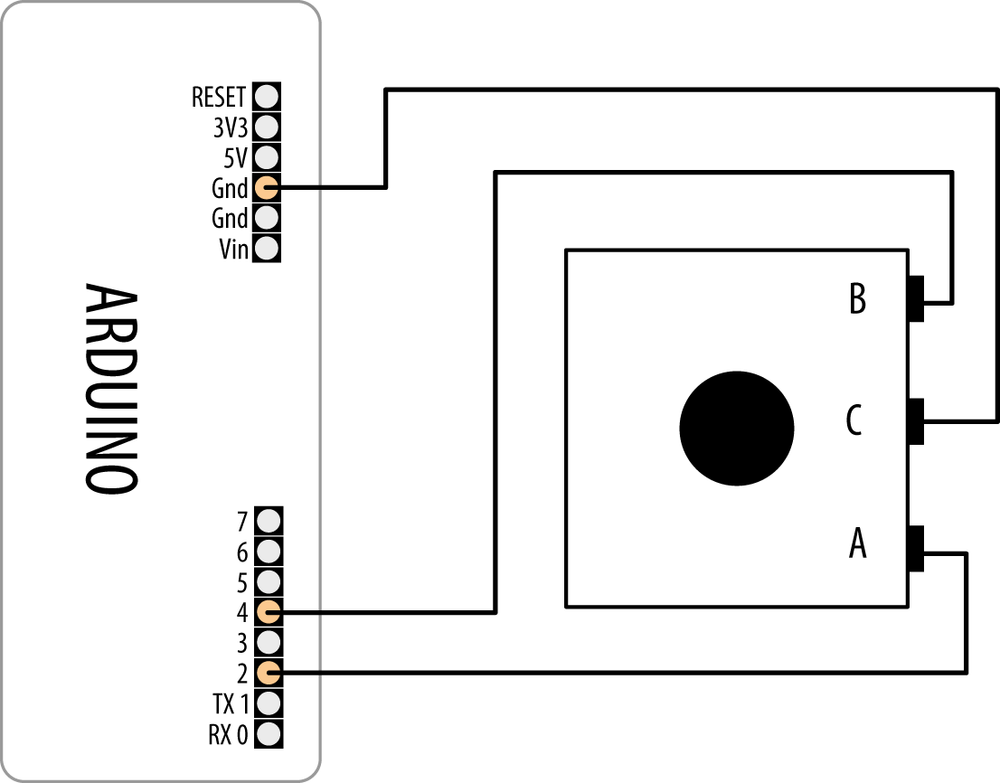
To sense rotary motion you can use a rotary encoder that is attached to the object you want to track. Connect the encoder as shown in Figure 6-14:
/*
 Read a rotary encoder
 This simple version polls the encoder pins
 The position is displayed on the Serial Monitor
 */


const int encoderPinA = 4;
const int encoderPinB = 2;
const int encoderStepsPerRevolution=16;
int angle = 0;

int val;

int encoderPos = 0;
boolean encoderALast = LOW;  // remembers the previous pin state


void setup()
{
  pinMode(encoderPinA, INPUT);
  pinMode(encoderPinB, INPUT);
  digitalWrite(encoderPinA, HIGH);
  digitalWrite(encoderPinB, HIGH);
  Serial.begin (9600);
}

void loop()
{
  boolean encoderA = digitalRead(encoderPinA);

  if ((encoderALast == HIGH) && (encoderA == LOW))
  {
    if (digitalRead(encoderPinB) == LOW)
    {
      encoderPos--;
    }
    else
    {
      encoderPos++;
    }
    angle=(encoderPos % encoderStepsPerRevolution)*360/encoderStepsPerRevolution;
    Serial.print (encoderPos);
    Serial.print (" ");
    Serial.println (angle);
  }

  encoderALast = encoderA;
}
Discussion
A rotary encoder produces two signals as it is turned. Both
signals alternate between HIGH and
LOW as the shaft is turned, but the
signals are slightly out of phase with each other. If you detect the
point where one of the signals changes from HIGH to LOW, the state of the other pin (whether it
is HIGH or LOW) will tell you which way the shaft is
rotating.
So, the first line of code in the loop function reads one of the encoder
pins:
int encoderA = digitalRead(encoderPinA);
Then it checks this value and the previous one to see if the
value has just changed to LOW:
if ((encoderALast == HIGH) && (encoderA == LOW))
If it has not, the code doesn’t execute the following block; it
goes to the bottom of loop, saves
the value it has just read in encoderALast, and goes back around to take a
fresh reading.
When the following expression is true:
if ((encoderALast == HIGH) && (encoderA == LOW))
the code reads the other encoder pin and increments or
decrements encoderPos depending on
the value returned. It calculates the angle of the shaft (taking 0 to
be the point the shaft was at when the code started running). It then
sends the values down the serial port so that you can see it in the
Serial Monitor.
Encoders come in different resolutions, quoted as
steps per revolution. This indicates how many
times the signals alternate between HIGH and LOW for one revolution of the shaft. Values
can vary from 16 to 1,000. The higher values can detect smaller
movements, and these encoders cost much more money. The value for the
encoder is hardcoded in the code in the following line:
const int encoderStepsPerRevolution=16;
If your encoder is different, you need to change that to get the correct angle values.
If you get values out that don’t go up and down, but increase
regardless of the direction you turn the encoder, try changing the
test to look for a rising edge rather than a falling one. Swap the
LOW and HIGH values in the line that checks the
values so that it looks like this:
if ((encoderALast == LOW) && (encoderA == HIGH))
Rotary encoders just produce an increment/decrement signal; they cannot directly tell you the shaft angle. The code calculates this, but it will be relative to the start position each time the code runs. The code monitors the pins by polling (continuously checking the value of) them. There is no guarantee that the pins have not changed a few times since the last time the code looked, so if the code does lots of other things as well, and the encoder is turned very quickly, it is possible that some of the steps will be missed. For high-resolution encoders this is more likely, as they will send signals much more often as they are turned.
To work out the speed, you need to count how many steps are registered in one direction in a set time.
6.11. Tracking the Movement of More Than One Rotary Encoder
Solution
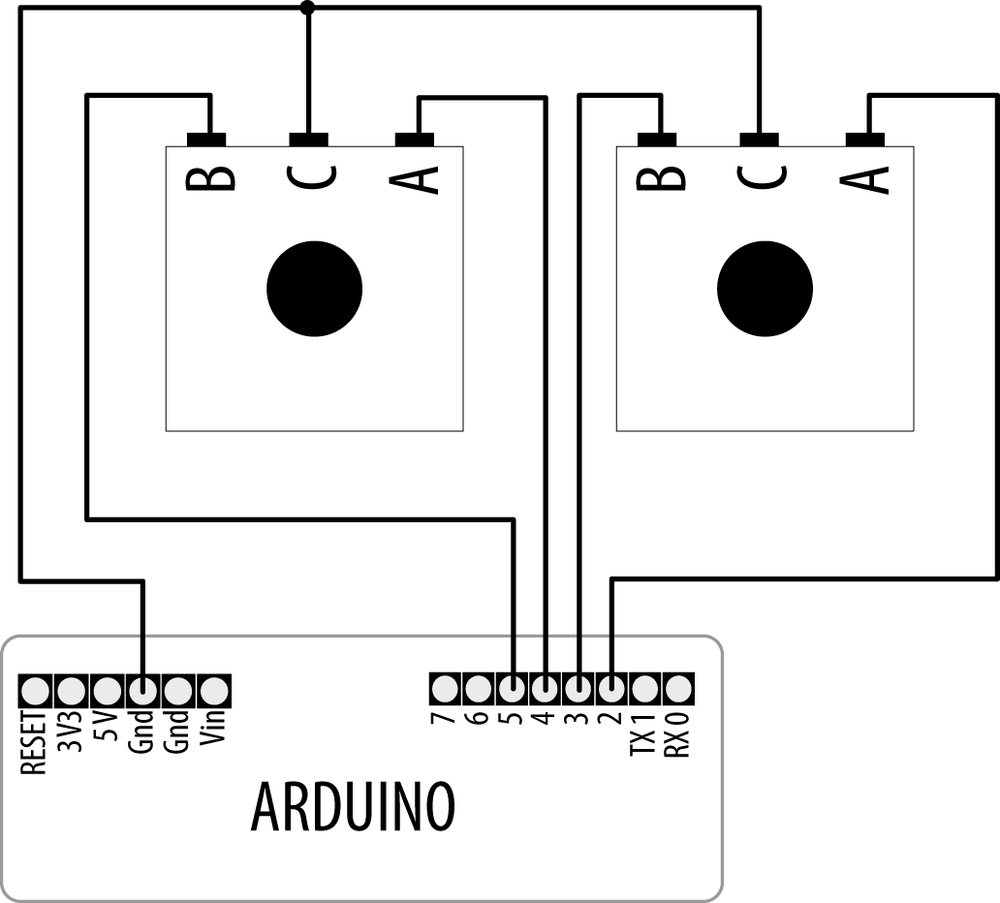
The circuit uses two encoders, connected as shown in Figure 6-15. You can read more about rotary encoders in Recipe 6.10:
/*
 RotaryEncoderMultiPoll
 This sketch has two encoders connected.
 One is connected to pins 2 and 3
 The other is connected to pins 4 and 5
 */

const int  ENCODERS = 2; // the number of encoders

const int encoderPinA[ENCODERS] = {2,4};     // encoderA pins on 2 and 4
const int encoderPinB[ENCODERS] = {3,5};     // encoderB pins on 3 and 5
int encoderPos[ ENCODERS] = { 0,0};          // initialize the positions to 0
boolean encoderALast[ENCODERS] = { LOW,LOW}; // holds last state of encoderA pin


void setup()
{
  for (int i=2; i<6; i++){
    pinMode(i, HIGH);
    digitalWrite(i, HIGH);
  }
  Serial.begin (9600);
}

int updatePosition( int encoderIndex)
{
  boolean encoderA = digitalRead(encoderPinA[encoderIndex]);
  if ((encoderALast[encoderIndex] == HIGH) && (encoderA == LOW))
  {
    if (digitalRead(encoderPinB[encoderIndex]) == LOW)
    {
      encoderPos[encoderIndex]--;
    }
    else
    {
      encoderPos[encoderIndex]++;
    }
    Serial.print("Encoder ");
    Serial.print(encoderIndex,DEC);
    Serial.print("=");
    Serial.print (encoderPos[encoderIndex]);
    Serial.println ("/");
  }
  encoderALast[encoderIndex] = encoderA;
}


void loop()
{
  for(int i=0; i < ENCODERS;i++)
  {
    updatePosition(i);
  }
}
Discussion
This recipe uses the same code logic as Recipe 6.10, which was reading one
encoder, but it uses arrays for all the variables that must be
remembered separately for each encoder. You can then use a for loop to go through each one and read it
and calculate its rotation. To use more encoders, set the ENCODERS values to the number of encoders
you have and extend the arrays and the definitions to say which pins
they are attached to.
If you get values out that don’t go up and down, but increase
regardless of the direction you turn the encoder, try changing the
test to look for a rising edge rather than a falling one. Swap the
LOW and HIGH values in the line that checks the
values from this:
if ((encoderALast[encoderIndex] ==HIGH) && (encoderA ==LOW))
to this:
if ((encoderALast[encoderIndex] ==LOW) && (encoderA ==HIGH))
If one of the encoders works but the other just counts up, switch over the A and B connections for the one that just counts up.
6.12. Tracking Rotary Movement in a Busy Sketch
Problem
As you extend your code and it is doing other things in addition to reading the encoder, reading the encoder starts to get unreliable. This problem is particularly bad if the shaft rotates quickly.
Solution
The circuit is the same as the one for Recipe 6.11. We will use an interrupt on the Arduino to make sure that every time a step happens, the code responds to it:
/*
  RotaryEncoderInterrupt sketch
 */

const int encoderPinA = 2;
const int encoderPinB = 4;
int Pos, oldPos;
volatile int encoderPos = 0; // variables changed within interrupts are volatile


void setup()
{
  pinMode(encoderPinA, INPUT);
  pinMode(encoderPinB, INPUT);
  digitalWrite(encoderPinA, HIGH);
  digitalWrite(encoderPinB, HIGH);
  Serial.begin(9600);

  attachInterrupt(0, doEncoder, FALLING); // encoder pin on interrupt 0 (pin 2)
}

void loop()
{
  uint8_t oldSREG = SREG;

  cli();
  Pos = encoderPos;
  SREG = oldSREG;
  if(Pos != oldPos)
  {
    Serial.println(Pos,DEC);
    oldPos = Pos;
  }
   delay(1000);
}


void doEncoder()
{
  if (digitalRead(encoderPinA) == digitalRead(encoderPinB))
    encoderPos++;    // count up if both encoder pins are the same
  else
    encoderPos--;    // count down if pins are different
}
This code will only report the Pos value on the serial port, at most once
every second (because of the delay), but the values reported will take
into account any movement that may have happened while it was
delaying.
Discussion
As your code has more things to do, the encoder pins will be checked less often. If the pins go through a whole step change before getting read, the Arduino will not detect that step. Moving the shaft quickly will cause this to happen more often, as the steps will be happening more quickly.
To make sure the code responds every time a step happens, you need to use interrupts. When the interrupt condition happens, the code jumps from wherever it is, does what needs to happen, and then returns to where it was and carries on.
On a standard Arduino board, two pins can be used as interrupts: pins 2 and 3. The interrupt is enabled through the following line:
attachInterrupt(0, doEncoder, FALLING);
The three parameters needed are the interrupt pin identifier (0
for pin 2, 1 for pin 3); the function to jump to when the interrupt
happens, in this case doEncoder;
and finally, the pin behavior to trigger the interrupt, in this case
when the voltage falls from 5 to 0
volts. The other options are RISING (voltage rises from 0 to 5 volts) and
CHANGE (voltage falls or
rises).
The doEncoder function checks the encoder pins to see which way the
shaft turned, and changes encoderPos to reflect this.
If the values reported only increase regardless of the direction
of rotation, try changing the interrupt to look for RISING rather than FALLING.
Because encoderPos is changed
in the function that is called when the interrupt happens, it needs to
be declared as volatile when it is created. This tells the compiler that it
could change at any time; don’t optimize the code by assuming it won’t
have changed, as the interrupt can happen at any time.
Note
The Arduino build process optimizes the code by removing code
and variables that are not used by your sketch code. Variables that
are only modified in an interrupt handler should be declared as
volatile to tell the compiler not
to remove these variables.
To read this variable in the main loop, you should take special precautions to make sure the interrupt does not happen in the middle of reading it. This chunk of code does that:
  uint8_t oldSREG = SREG;

  cli();
  Pos = encoderPos;
  SREG = oldSREG;
First you save the state of SREG (the interrupt registers), and then cli turns the interrupt off. The value is
read, and then restoring SREG turns
the interrupt back on and sets everything back as it was. Any
interrupt that occurs when interrupts are turned off will wait until
interrupts are turned back on. This period is so short that interrupts
will not be missed (as long as you keep the code in the interrupt
handler as short as possible).
6.13. Using a Mouse
Problem
You want to detect movements of a PS/2-compatible mouse and respond to changes in the x and y coordinates.
Solution
This solution uses LEDs to indicate mouse movement. The brightness of the LEDs changes in response to mouse movement in the x (left and right) and y (nearer and farther) directions. Clicking the mouse buttons sets the current position as the reference point (Figure 6-16 shows the connections):
/*
   Mouse
   an arduino sketch using ps2 mouse library
   see: http://www.arduino.cc/playground/ComponentLib/Ps2mouse
 */

// PS2 mouse library from :  http://www.arduino.cc/playground/ComponentLib/Ps2mouse
#define WProgram.h Arduino.h
#include <ps2.h>

const int dataPin =  5;
const int clockPin = 6;

const int xLedPin  = 9;
const int yLedPin  = 11;

const int mouseRange = 255;  // the maximum range of x/y values

char x;                 // values read from the mouse
char y;
byte status;

int xPosition = 0;      // values incremented and decremented when mouse moves
int yPosition = 0;
int xBrightness = 128;  // values increased and decreased based on mouse position
int yBrightness = 128;

const byte REQUEST_DATA = 0xeb; // command to get data from the mouse

PS2 mouse(clockPin, dataPin);

void setup()
{
  mouseBegin();
}

void loop()
{
  // get a reading from the mouse
  mouse.write(REQUEST_DATA); // ask the mouse for data
  mouse.read();      // ignore ack
  status = mouse.read(); // read the mouse buttons
  if(status & 1) // this bit is set if the left mouse btn pressed
    xPosition = 0; // center the mouse x position
  if(status & 2) // this bit is set if the right mouse btn pressed
    yPosition = 0; // center the mouse y position

  x = mouse.read();
  y = mouse.read();
  if( x != 0 || y != 0)
  {
    // here if there is mouse movement

    xPosition = xPosition + x; // accumulate the position
    xPosition = constrain(xPosition,-mouseRange,mouseRange);

    xBrightness = map(xPosition, -mouseRange, mouseRange, 0,255);
    analogWrite(xLedPin, xBrightness);

    yPosition = constrain(yPosition + y, -mouseRange,mouseRange);
    yBrightness = map(yPosition, -mouseRange, mouseRange, 0,255);
    analogWrite(yLedPin, yBrightness);
  }
}

void mouseBegin()
{
  // reset and initialize the mouse
  mouse.write(0xff);         // reset
  delayMicroseconds(100);
  mouse.read();              // ack byte
  mouse.read();              // blank
  mouse.read();              // blank
  mouse.write(0xf0);         // remote mode
  mouse.read();              // ack
  delayMicroseconds(100);
}
Figure 6-16 shows a female PS/2 connector from the front. If you don’t have a female connector and don’t mind chopping the end off your mouse, you can note which wires connect to each of these pins and solder to pin headers that plug directly into the correct Arduino pins.
Discussion
Connect the mouse signal (clock and data) and power leads to Arduino, as shown in Figure 6-16. This solution only works with PS/2-compatible devices, so you may need to find an older mouse—most mice with the round PS/2 connector should work.
The mouseBegin function initializes the mouse to respond to requests
for movement and button status. The PS/2 library from http://www.arduino.cc/playground/ComponentLib/Ps2mouse
handles the low-level communication. The mouse.write command is used to instruct the
mouse that data will be requested. The first call to mouse.read gets an acknowledgment (which is
ignored in this example). The next call to mouse.read gets the button status, and the
last two mouse.read calls get the
x and y movement that has
taken place since the previous request.
The sketch tests to see which bits are HIGH in the status value to determine if the left or
right mouse button was pressed. The two rightmost bits will be
HIGH when the left and right
buttons are pressed, and these are checked in the following
lines:
  status = mouse.read(); // read the mouse buttons
  if(status & 1) // rightmost bit is set if the left mouse btn pressed
    xPosition = 0; // center the mouse x position
  if(status & 2) // this bit is set if the right mouse btn pressed
    yPosition = 0; // center the mouse y position
The x and y values read from the mouse represent the
movement since the previous request, and these values are accumulated
in the variables xPosition and
yPosition.
The values of x and y will be positive if the mouse moves right
or away from you, and negative if it moves left or toward you.
The sketch ensures that the accumulated value does not exceed
the defined range (mouseRange)
using the constrain
function:
   xPosition = xPosition + x; // accumulate the position
   xPosition = constrain(xPosition,-mouseRange,mouseRange);
The yPosition calculation
shows a shorthand way to do the same thing; here the calculation for
the y value is done within the call
to constrain:
yPosition = constrain(yPosition + y,-mouseRange,mouseRange);
The xPosition and yPosition variables are reset to zero if the
left and right mouse buttons are pressed.
LEDs are illuminated to correspond to position using analogWrite—half
brightness in the center, and increasing and decreasing in brightness
as the mouse position increases and decreases.
The position can be displayed on the Serial Monitor by adding
the following line just after the second call to analogWrite():
printValues(); // show button and x and y values on Serial Monitor
You’ll also need to add this line to setup():
Serial.begin(9600);
Add the following function to the end of the sketch to print the values received from the mouse:
void printValues()
{
    Serial.println(status, BIN);

    Serial.print("X=");
    Serial.print(x,DEC);
    Serial.print(", position= ");
    Serial.print(xPosition);
    Serial.print(", brightness= ");
    Serial.println(xBrightness);

    Serial.print("Y=");
    Serial.print(y,DEC);
    Serial.print(", position= ");
    Serial.print(yPosition);
    Serial.print(", brightness= ");
    Serial.println(yBrightness);
    Serial.println();
}
See Also
For a suitable PS/2 connector and breakout, see http://www.sparkfun.com/products/8509 and http://www.sparkfun.com/products/8651.
6.14. Getting Location from a GPS
Solution
A number of fine Arduino-compatible GPS units are available today. Most use a familiar serial interface to communicate with their host microcontroller using a protocol known as NMEA 0183. This industry standard provides for GPS data to be delivered to “listener” devices such as Arduino as human-readable ASCII “sentences.” For example, the following NMEA sentence:
$GPGLL,4916.45,N,12311.12,W,225444,A,*1D |
describes, among other things, a location on the globe at 49 16.45’ north latitude by 123 11.12’ west longitude.
To establish location, your Arduino sketch must parse these strings and convert the relevant text to numeric form. Writing code to manually extract data from NMEA sentences can be tricky and cumbersome in the Arduino’s limited address space, but fortunately there is a useful library that does this work for you: Mikal Hart’s TinyGPS. Download it from http://arduiniana.org/ and install it. (For instructions on installing third-party libraries, see Chapter 16.)
The general strategy for using a GPS is as follows:
Physically connect the GPS device to the Arduino.
Read serial NMEA data from the GPS device.
Process the data to determine location.
Using TinyGPS, you do the following:
Physically connect the GPS device to the Arduino.
Create a TinyGPS object.
Read serial NMEA data from the GPS device.
Process each byte with TinyGPS’s
encode()method.Periodically query TinyGPS’s
get_position()method to determine location.
The following sketch illustrates how you can acquire data from a GPS attached to Arduino’s serial port. It lights the built-in LED connected to pin 13 whenever the device is in the Southern Hemisphere:
// A simple sketch to detect the Southern Hemisphere
// Assumes: LED on pin 13, GPS connected to Hardware Serial pins 0/1
#include "TinyGPS.h"

TinyGPS gps; // create a TinyGPS object

#define HEMISPHERE_PIN 13

void setup()
{
  Serial.begin(4800); // GPS devices frequently operate at 4800 baud
  pinMode(HEMISPHERE_PIN, OUTPUT);
  digitalWrite(HEMISPHERE_PIN, LOW); // turn off LED to start
}
void loop()
{
  while (Serial.available())
  {
    int c = Serial.read();
    // Encode() each byte
    // Check for new position if encode() returns "True"
    if (gps.encode(c))
    {
      long lat, lon;
      gps.get_position(&lat, &lon);
      if (lat < 0) // Southern Hemisphere?
        digitalWrite(HEMISPHERE_PIN, HIGH);
      else
        digitalWrite(HEMISPHERE_PIN, LOW);
    }
  }
}
Start serial communications using the rate required by your GPS. See Chapter 4 if you need more information on using Arduino serial communications.
A 4,800 baud connection is established with the GPS. Once bytes
begin flowing, they are processed by encode(), which parses the NMEA data. A
true return from encode() indicates that TinyGPS has
successfully parsed a complete sentence and that fresh position data
may be available. This is a good time to check the device’s current
location with a call to get_position().
TinyGPS’s get_position()
returns the most recently observed latitude and longitude. The example
examines latitude; if it is less than zero, that is, south of the
equator, the LED is illuminated.
Discussion
Attaching a GPS unit to an Arduino is usually as simple as connecting two or three data lines from the GPS to input pins on the Arduino. Using the popular USGlobalSat EM-406A GPS module as an example, you can connect the lines as shown in Table 6-1.
EM-406A line | Arduino pin |
GND | Gnd |
VIN | +Vcc |
RX | TX (pin 1) |
TX | RX (pin 0) |
GND | Gnd |
Warning
Some GPS modules use RS-232 voltage levels, which are incompatible with Arduino’s TTL logic and can permanently damage the board. If your GPS uses RS-232 levels then you need some kind of intermediate logic conversion device like the MAX232 integrated circuit.
The code in this recipe’s Solution assumes that the GPS is connected directly to Arduino’s built-in serial port, but this is not usually the most convenient design. In many projects, the hardware serial port is needed to communicate with a host PC or other peripheral and cannot be used by the GPS. In cases like this, select another pair of digital pins and use a serial port emulation (“soft serial”) library to talk to the GPS instead.
SoftwareSerial is the serial emulation library that currently ships with the Arduino IDE. If you are using a version prior to Arduino 1.0, you will need to use a third-party library called NewSoftSerial, also published at http://arduiniana.org/. For a more detailed discussion on software serial, see Recipes 4.13 and 4.14.
You can move the GPS’s TX line to Arduino pin 2 and RX line to pin 3 to free up the hardware serial port for debugging (see Figure 4-7). Leaving the USB cable connected to the host PC, modify the preceding sketch to use SoftwareSerial to get a detailed glimpse of TinyGPS in action through the Arduino’s Serial Monitor:
// Another simple sketch to detect the Southern Hemisphere
// Assumes: LED on pin 13, GPS connected to pins 2/3
// (Optional) Serial debug console attached to hardware serial port 0/1

#include "TinyGPS.h"
#include "SoftwareSerial.h"

#define HEMISPHERE_PIN 13
#define GPS_RX_PIN 2
#define GPS_TX_PIN 3

TinyGPS gps; // create a TinyGPS object
SoftwareSerial ss(GPS_RX_PIN, GPS_TX_PIN); // create soft serial object

void setup()
{
  Serial.begin(9600); // for debugging
  ss.begin(4800); // Use Soft Serial object to talk to GPS
  pinMode(HEMISPHERE_PIN, OUTPUT);
  digitalWrite(HEMISPHERE_PIN, LOW); // turn off LED to start
}
void loop()
{
  while (ss.available())
  {
    int c = ss.read();
    Serial.write(c); // display NMEA data for debug
    // Send each byte to encode()
    // Check for new position if encode() returns "True"
    if (gps.encode(c))
    {
      long lat, lon;
     unsigned long fix_age;
    gps.get_position(&lat, &lon, &fix_age);
    if (fix_age == TinyGPS::GPS_INVALID_AGE )
      Serial.println("No fix ever detected!");
    else if (fix_age > 2000)
      Serial.println("Data is getting STALE!");
    else
      Serial.println("Latitude and longitude valid!");

      Serial.print("Lat: ");
      Serial.print(lat);
      Serial.print(" Lon: ");
      Serial.println(lon);
      if (lat < 0) // Southern Hemisphere?
        digitalWrite(HEMISPHERE_PIN, HIGH);
      else
        digitalWrite(HEMISPHERE_PIN, LOW);
    }
  }
}
Note that you can use a different baud rate for connection to the Serial Monitor and the GPS.
This new sketch behaves the same as the earlier example but is much easier to debug. At any time, you can simply hook a monitor up to the built-in serial port to watch the NMEA sentences and TinyGPS data scrolling by.
When power is turned on, a GPS unit begins transmitting NMEA
sentences. However, the sentences containing valid location data are
only transmitted after the GPS establishes a fix, which requires the
GPS antenna to have visibility of the sky and can take up to two
minutes or more. Stormy weather or the presence of buildings or other
obstacles may also interfere with the GPS’s ability to pinpoint
location. So, how does the sketch know whether TinyGPS is delivering
valid position data? The answer lies in the third parameter to
get_position(), the optional
fix_age.
If you supply a pointer to an unsigned long variable as get_position()’s third parameter, TinyGPS
sets it to the number of milliseconds since the last valid position
data was acquired; see also Recipe 2.11. A value of 0xFFFFFFFF here (symbolically, GPS_INVALID_AGE) means TinyGPS has not yet parsed any
valid sentences containing position data. In this case, the returned
latitude and longitude are invalid as well (GPS_INVALID_ANGLE).
Under normal operation, you can expect to see quite low values
for fix_age. Modern GPS devices are
capable of reporting position data as frequently as one to five times
per second or more, so a fix_age in
excess of 2,000 ms or so suggests that there may be a problem. Perhaps
the GPS is traveling through a tunnel or a wiring flaw is corrupting
the NMEA data stream, invalidating the checksum (a calculation to
check that the data is not corrupted). In any case, a large fix_age indicates that the coordinates
returned by get_position() are
stale. The following code is an example of how fix_age can be used to ensure that the
position data is fresh:
    long lat, lon;
    unsigned long fix_age;
    gps.get_position(&lat, &lon, &fix_age);
    if (fix_age == TinyGPS::GPS_INVALID_AGE)
      Serial.println("No fix ever detected!");
    else if (fix_age > 2000)
      Serial.println("Data is getting STALE!");
    else
      Serial.println("Latitude and longitude valid!");
See Also
TinyGPS is available for download at http://arduiniana.org/libraries/tinygps.
For a deeper understanding of the NMEA protocol, read the Wikipedia article at http://en.wikipedia.org/wiki/NMEA.
Several shops sell GPS modules that interface well with TinyGPS and Arduino. These differ mostly in power consumption, voltage, accuracy, physical interface, and whether they support serial NMEA. SparkFun (http://www.sparkfun.com) carries a large range of GPS modules and has an excellent buyer’s guide.
GPS technology has inspired lots of creative Arduino projects. A very popular example is the GPS data logger, in which a moving device records location data at regular intervals to the Arduino EEPROM or other on-board storage. See the breadcrumbs project at http://code.google.com/p/breadcrumbs/wiki/UserDocument for an example. Ladyada makes a popular GPS data logging shield; see http://www.ladyada.net/make/gpsshield/.
Other interesting GPS projects include hobby airplanes and helicopters that maneuver themselves to preprogrammed destinations under Arduino software control. Mikal Hart built a GPS-enabled “treasure chest” with an internal latch that cannot be opened until the box is physically moved to a certain location. See http://arduiniana.org.
6.15. Detecting Rotation Using a Gyroscope
Problem
You want to respond to the rate of rotation. This can be used to keep a vehicle or robot moving in a straight line or turning at a desired rate.
Solution
Gyroscopes provide an output related to rotation rate (as opposed to an accelerometer, which indicates rate of change of velocity). Most low-cost gyroscopes use an analog voltage proportional to rotation rate, although some also provide output using I2C (see Chapter 13 for more on using I2C to communicate with devices). This recipe works with a gyro with an analog output proportional to rotation rate. Figure 6-17 shows an LY530AL breakout board from SparkFun. Many low-cost gyros, such as the one used here, are 3.3V devices and must not be plugged in to the 5V power pin.

Warning
Check the maximum voltage of your gyro before connecting power. Plugging a 3.3V gyro into 5V can permanently damage the device.
The Gyro OUT connection is
the analog output and is connected to Arduino analog input
0:
/*
  gyro sketch
  displays the rotation rate on the Serial Monitor
 */


const int inputPin = 0;  // analog input 0
int rotationRate = 0;

void setup()
{
  Serial.begin(9600);   // sets the serial port to 9600
}

void loop()
{
  rotationRate = analogRead(inputPin); // read the gyro output
  Serial.print("rotation rate is ");
  Serial.println(rotationRate);
  delay(100);                          // wait 100ms for next reading
}
Discussion
The loop code reads the gyro
value on analog pin 0 and displays this on the Serial Monitor.
Using the older LISY300AL gyro
The previous edition covered the LISY300AL gyro, which may now be difficult to obtain. But if you have one, you can use the same sketch if you connect the Power Down (PD) pin to Gnd. Better yet, you can wire the PD pin to an Arduino pin so you can turn the gyro on and off from your sketch. Figure 6-18 shows the connections for the LISY3000AL.
The PD connection enables the gyro to be switched into low power mode and is connected to analog pin 1 (in this sketch, it is used as a digital output pin). You can connect PD to any digital pin; the pin used here was chosen to keep the wiring neater. The sketch above can be modified to control the PD pin as follows:
const int inputPin = 0;      // analog input 0
const int powerDownPin = 15; // analog input 1 is digital input 15

int rotationRate = 0;

void setup()
{
  Serial.begin(9600);           // sets the serial port to 9600
  pinMode(powerDownPin, OUTPUT);
  digitalWrite(powerDownPin, LOW);  // gyro not in power down mode
}

// loop code is same as above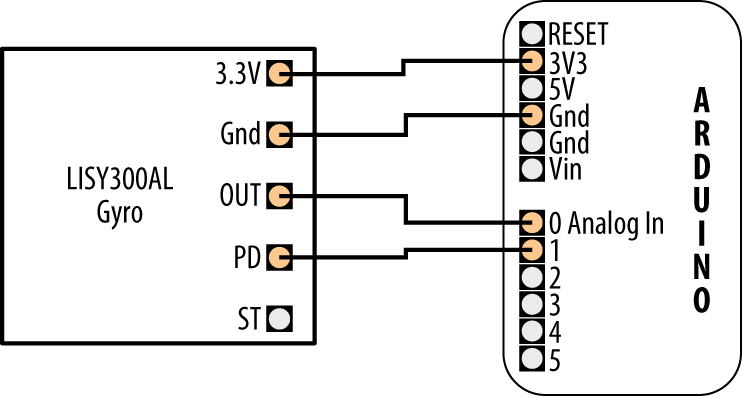
If you don’t need to switch the gyro into low-power mode, you
can connect the PD line to Gnd (PD LOW is on, PD HIGH is power down mode).
Note
Analog input pins can be used as digital pins (but not the
other way around). Analog input 0 is digital pin 14; analog input
1 is digital pin 15, and so on. Arduino 1.0 introduced new
definitions that enable you to refer to Analog input 0 as A0, Analog input 1 as A1, etc.
Measuring rotation in three dimensions using the ITG-3200 sensor
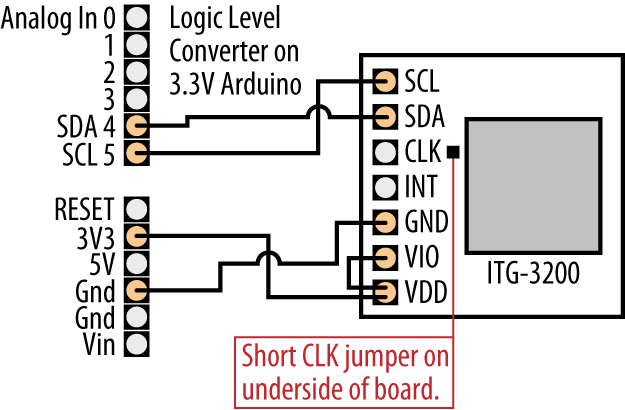
The ITG-3200 is a 3-axis gyroscope with excellent performance for the price. Even if you only require 2-axis measurements, it is a better choice than the LY530ALH for applications that need accurate measurements or have a high rotation rate (up to 2000° per second). It is a 3.3V I2C device, so if you are not using a 3.3V Arduino board you will need a logic-level converter to protect the gyro’s SCL and SDA pins. See the introduction to Chapter 13 for more on I2C and using 3.3V devices.
The breakout board from SparkFun (SEN-09801) makes it easy to connect this up (see Figure 6-19), but don’t forget to solder the CLK jumper on the underside of the board that enables the internal clock.
This sketch below prints the values of each of the x,y and z axis separated by commas:
/*
 ITG-3200 example sketch
 Based on the SparkFun quick start guide: http://www.sparkfun.com/tutorials/265
 */
#include <Wire.h>

const int itgAddress = 0x69;

// ITG-3200 constants - see data sheet
const byte SMPLRT_DIV= 0x15;
const byte DLPF_FS   = 0x16;
const byte INT_CFG   = 0x17;
const byte PWR_MGM   = 0x3E;
const byte GYRO_X_ADDRESS = 0x1D; // GYRO_XOUT_H
const byte GYRO_Y_ADDRESS = 0x1F; // GYRO_YOUT_H
const byte GYRO_Z_ADDRESS = 0x21; // GYRO_ZOUT_H

// Configuration settings, see data sheet for details
const byte DLPF_CFG_0    = 0x1;
const byte DLPF_CFG_1    = 0x2;
const byte DLPF_CFG_2    = 0x4;
const byte DLPF_FS_SEL_0 = 0x8;
const byte DLPF_FS_SEL_1 = 0x10;

void setup()
{
  Serial.begin(9600);
  Wire.begin();

  //Configure the gyroscope
  //Set the gyroscope scale for the outputs to +/-2000 degrees per second
  itgWrite(DLPF_FS, (DLPF_FS_SEL_0|DLPF_FS_SEL_1|DLPF_CFG_0));
  //Set the sample rate to 100 hz
  itgWrite(SMPLRT_DIV, 9);
}

//read and output X,Y and Z rates to Serial Monitor
void loop()
{
  //Create variables to hold the output rates.
  int xRate, yRate, zRate;

  //Read the x,y and z output rates from the gyroscope.
  xRate = readAxis(GYRO_X_ADDRESS);
  yRate = readAxis(GYRO_Y_ADDRESS);
  zRate = readAxis(GYRO_Z_ADDRESS);

  //Print the output rates to the Serial Monitor
  int temperature = 22;
  Serial.print(temperature);
  Serial.print(','),
  Serial.print(xRate);
  Serial.print(','),
  Serial.print(yRate);
  Serial.print(','),
  Serial.println(zRate);

  //Wait 10ms before reading the values again.
  delay(10);
}

//Write the given data to the given itg-3200 register
void itgWrite(char registerAddress, char data)
{

  Wire.beginTransmission(itgAddress); // initiate the send sequence
  Wire.write(registerAddress);        // the register address to write
  Wire.write(data);                   // the data to be written
  Wire.endTransmission();             // this actually sends the data
}

//Read data from the specified register on the ITG-3200 and return the value.
unsigned char itgRead(char registerAddress)
{
  //This variable will hold the contents read from the i2c device.
  unsigned char data=0;

  Wire.beginTransmission(itgAddress);
  Wire.write(registerAddress); //Send the Register Address
  Wire.endTransmission();      //End the communication sequence.

  Wire.beginTransmission(itgAddress);
  Wire.requestFrom(itgAddress, 1);    //Ask the device for data

  if(Wire.available()){  // Wait for a response from device
    data = Wire.read();  // read the data
  }

  Wire.endTransmission();   //End the communication sequence
  return data;   //Return the read data
}

// Read X,Y or Z Axis rate of the gyroscope.
// axisRegAddress argument selects the axis to be read.
int readAxis(byte axisRegAddress)
{
  int data=0;
  data = itgRead(axisRegAddress)<<8;
  data |= itgRead(axisRegAddress + 1);
  return data;
}
See Also
See Chapter 13 for more about I2C.
See Using 3.3 Volt Devices with 5 Volt Boards for more about that topic.
A SparkFun tutorial for the ITG-3200 is at http://www.sparkfun.com/tutorials/265.
6.16. Detecting Direction
Solution
This recipe uses the HM55B Compass Module from Parallax (#29123); Figure 6-20 shows the connections:
/*
  HM55bCompass sketch
  uses 'software SPI' serial protocol implemented using Arduino bit operators
  (see Recipe 3.13)
  prints compass angle to Serial Monitor
 */

const int enablePin = 2;
const int clockPin  = 3;
const int dataPin   = 4;

// command codes (from HM55B data sheet)
const byte COMMAND_LENGTH = 4;        // the number of bits in a command
const byte RESET_COMMAND = B0000;     // reset the chip
const byte MEASURE_COMMAND = B1000;   // start a measurement
const byte READ_DATA_COMMAND = B1100; // read data and end flag
const byte MEASUREMENT_READY = B1100; // value returned when measurement complete


int angle;

void setup()
{
  Serial.begin(9600);
  pinMode(enablePin, OUTPUT);
  pinMode(clockPin, OUTPUT);
  pinMode(dataPin, INPUT);
  reset();  // reset the compass module
}

void loop()
{
  startMeasurement();
  delay(40); // wait for the data to be ready
  if (readStatus()==MEASUREMENT_READY);  // check if the data is ready
  {
    angle = readMeasurement();          //read measurement and calculate angle
    Serial.print("Angle = ");
    Serial.println(angle); // print angle
  }
  delay(100);
}

void reset()
{
  pinMode(dataPin, OUTPUT);
  digitalWrite(enablePin, LOW);
  serialOut(RESET_COMMAND, COMMAND_LENGTH);
  digitalWrite(enablePin, HIGH);
}

void startMeasurement()
{
  pinMode(dataPin, OUTPUT);
  digitalWrite(enablePin, LOW);
  serialOut(MEASURE_COMMAND, COMMAND_LENGTH);
  digitalWrite(enablePin, HIGH);
}

int readStatus()
{
  int result = 0;
  pinMode(dataPin, OUTPUT);
  digitalWrite(enablePin, LOW);
  serialOut(READ_DATA_COMMAND, COMMAND_LENGTH);
  result = serialIn(4);
  return result;   // returns the status
}

int readMeasurement()
{
  int X_Data = 0;
  int Y_Data = 0;
  int calcAngle = 0;
  X_Data = serialIn(11); // Field strength in X
  Y_Data = serialIn(11); // and Y direction
  digitalWrite(enablePin, HIGH); // deselect chip
  calcAngle = atan2(-Y_Data , X_Data) / M_PI * 180; // angle is atan(-y/x)
  if(calcAngle < 0)
    calcAngle = calcAngle + 360; // angle from 0 to 259 instead of plus/minus 180
  return calcAngle;
}

void serialOut(int value, int numberOfBits)
{
  for(int i = numberOfBits; i > 0; i--) // shift the MSB first
  {
    digitalWrite(clockPin, LOW);
    if(bitRead(value, i-1) == 1)
      digitalWrite(dataPin, HIGH);
    else
      digitalWrite(dataPin, LOW);
    digitalWrite(clockPin, HIGH);
  }
}

int serialIn(int numberOfBits)
{
  int result = 0;

  pinMode(dataPin, INPUT);
  for(int i = numberOfBits; i > 0; i--) // get the MSB first
  {
    digitalWrite(clockPin, HIGH);
    if (digitalRead(dataPin) == HIGH)
      result = (result << 1) + 1;
    else
      result = (result << 1) + 0;
    digitalWrite(clockPin, LOW);
  }

  // the following converts the result to a twos-complement negative number
  // if the most significant bit in the 11 bit data is 1
  if(bitRead(result, 11) == 1)
    result = (B11111000 << 8) | result; // twos complement negation

  return result;
}
Discussion
The compass module provides magnetic field intensities on two perpendicular axes (x and y). These values vary as the compass orientation is changed with respect to the Earth’s magnetic field (magnetic north).
The data sheet for the device tells you what values to send to reset the compass. Check if a valid reading is ready (if so, it will transmit it).
The sketch uses the functions serialIn() and
serialOut() to handle the pin
manipulations that send and receive messages.
The compass module is initialized into a known state in
the reset() function
called from setup(). The startMeasurement() function initiates the measurement, and after a brief
delay, the readStatus()
function indicates if the data is ready. A value of 0 is returned if the measurement is not
ready, or 12 (binary 1100) if the
compass is ready to transmit data.

Eleven bits of data are read into the X_Data and Y_Data variables. If you use a different
device, you will need to check the data sheet to see how many bits and
in what format the data is sent. X_Data and Y_Data store the magnetic field readings,
and the angle to magnetic north is calculated as follows: Radians =
arctan(–y/x)
This is implemented in the sketch in the line:
calcAngle = atan2(-Y_Data , X_Data) / M_PI * 180; // angle is atan(-y/x)
To make a servo follow the compass direction over the first 180 degrees, add the following:
#include <Servo.h>
Servo myservo;
in setup:
myservo.attach(8);
and in loop after the angle
is calculated:
// the servo is driven only up to 180 degrees
    angle = constrain(angle, 0,180);
myservo.write(angle);
Direction sensors are increasingly being used in smartphones. Consequently, high performance and low-cost devices are becoming more available. The sketch that follows is for one such device, the 3.3 volt HMC5883L I2C magnetometer chip. Breakout boards are available for this part, for example the SEN-10530 from SparkFun. Connect the GND and VCC pins to Ground and the 3.3V power pin. The SDA and SCL pins are connected to Arduino pins 4 and 5 (see Chapter 13 for more on using I2C devices with Arduino). If you want to use the HMC5883L with a 5 volt Arduino board, see Using 3.3 Volt Devices with 5 Volt Boards for details on how to use a level shifter.
Warning
Connecting the HMC5883L directly to Arduino pins on a standard 5V board can permanently damage the HMC5883L chip.
/*
 Uses HMC5883L to get earths magnetic field in x,y and z axis
 Displays direction as angle between 0 and 359 degrees
*/

#include <Wire.h> //I2C Arduino Library

const int hmc5883Address = 0x1E; //0011110b, I2C 7bit address of HMC5883
const byte hmc5883ModeRegister      = 0x02;
const byte hmcContinuousMode        = 0x00;
const byte hmcDataOutputXMSBAddress = 0x03;


void setup(){
  //Initialize Serial and I2C communications
  Serial.begin(9600);
  Wire.begin();

  //Put the HMC5883 IC into the correct operating mode
  Wire.beginTransmission(hmc5883Address); //open communication with HMC5883
  Wire.write(hmc5883ModeRegister); //select mode register
  Wire.write(hmcContinuousMode);   //continuous measurement mode
  Wire.endTransmission();
}

void loop(){

  int x,y,z; //triple axis data

  //Tell the HMC5883 where to begin reading data
  Wire.beginTransmission(hmc5883Address);
  Wire.write(hmcDataOutputXMSBAddress); //select register 3, X MSB register
  Wire.endTransmission();

  //Read data from each axis, 2 registers per axis
  Wire.requestFrom(hmc5883Address, 6);
  if(6<=Wire.available()){
    x = Wire.read()<<8; //X msb
    x |= Wire.read(); //X lsb
    z = Wire.read()<<8; //Z msb
    z |= Wire.read(); //Z lsb
    y = Wire.read()<<8; //Y msb
    y |= Wire.read(); //Y lsb
  }

  //Print out values of each axis
  Serial.print("x: ");
  Serial.print(x);
  Serial.print("  y: ");
  Serial.print(y);
  Serial.print("  z: ");
  Serial.print(z);

  int angle = atan2(-y , x) / M_PI * 180; // angle is atan(-y/x)
  if(angle < 0)
     angle = angle  + 360; // angle from 0 to 359 instead of plus/minus 180
  Serial.print(" Direction = ");
  Serial.println(angle);

  delay(250);
}
6.17. Getting Input from a Game Control Pad (PlayStation)
Solution
This recipe uses a Sony PlayStation 2–style controller with the PSX library at http://www.arduino.cc/playground/Main/PSXLibrary. Figure 6-21 shows the connections.
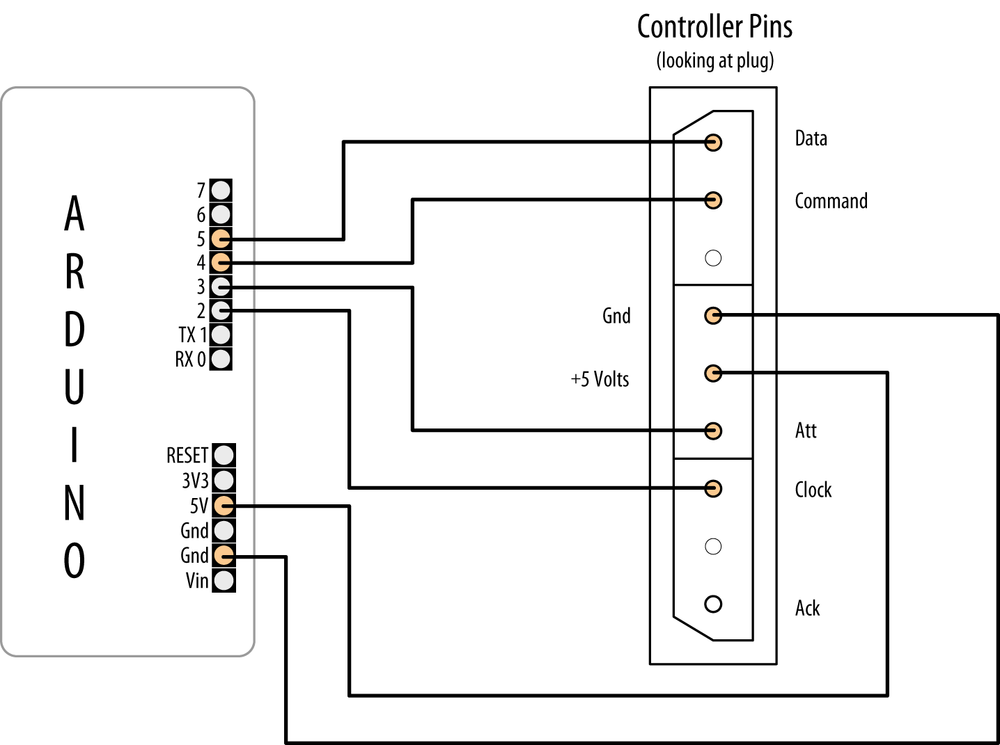
The sketch uses the Serial Monitor to show which button is pressed:
/*
 * PSX sketch
 *
 * Display joystick and button values
 * uses PSX library written by Kevin Ahrendt
 * http://www.arduino.cc/playground/Main/PSXLibrary
 */

#include <Psx.h>                       // Includes the Psx Library

Psx Psx;                               // Create an instance of the Psx library
const int dataPin  = 5;
const int cmndPin  = 4;
const int attPin   = 3;
const int clockPin = 2;
const int psxDelay = 50;         // determine the clock delay in microseconds

unsigned int data = 0;           // data stores the controller response

void setup()
{
  // initialize the Psx library
  Psx.setupPins(dataPin, cmndPin, attPin, clockPin, psxDelay);
  Serial.begin(9600); // results will be displayed on the Serial Monitor
}


void loop()
{
  data = Psx.read();        // get the psx controller button data

  // check the button bits to see if a button is pressed
  if(data & psxLeft)
    Serial.println("left button");
  if(data & psxDown)
    Serial.println("down button");
  if(data & psxRight)
    Serial.println("right button");
  if(data & psxUp)
    Serial.println("up button");
  if(data & psxStrt)
    Serial.println("start button");
  if(data & psxSlct)
    Serial.println("select button");

  delay(100);
}
Discussion
Game controllers provide information in many different ways. Most recent controllers contain chips that read the switches and joystick in the controller and communicate the information using a protocol depending on the game platform. Older controllers are more likely to give direct access to switches and joysticks using connectors with many connections. The latest wave of game platforms uses USB as the connection and these require hardware support such as a USB host shield.
See Also
PlayStation controller protocol: http://www.gamesx.com/controldata/psxcont/psxcont.htm
6.18. Reading Acceleration
Problem
You want to respond to acceleration; for example, to detect when something starts or stops moving. Or you want to detect how something is oriented with respect to the Earth’s surface (measure acceleration due to gravity).
Solution
Like many of the sensors discussed in this chapter, there is a wide choice of devices and methods of connection. Recipe 4.11 gave an example of a virtual joystick using the accelerometer in the Wii nunchuck to follow hand movements. Recipe 13.2 has more information on using the Wii nunchuck accelerometer. The recipe here uses analog output proportional to acceleration. Suitable devices include the ADXL203CE (SF SEN-00844), ADXL320 (SF SEN 00847), and MMA7260Q (SF SEN00252)—check the SparkFun accelerometer selection guide on the SparkFun website for more information.
Figure 6-22 shows the connections for the x- and y-axes of an analog accelerometer.

Warning
Check the data sheet for your device to ensure that you don’t exceed the maximum voltage. Many accelerometers are designed for 3.3V operation and can be damaged if connected to the 5V power connection on an Arduino board.
The simple sketch here uses the ADXL320 to display the acceleration in the x- and y-axes:
/*
  accel sketch
  simple sketch to output values on the x- and y-axes
 */

const int xPin = 0;  // analog input pins
const int yPin = 1;

void setup()
{
  Serial.begin(9600);  // note the higher than usual serial speed
}

void loop()
{
int xValue;  // values from accelerometer stored here
int yValue;

    xValue = analogRead(xPin);
    yValue = analogRead(yPin);

    Serial.print("X value = ");
    Serial.println(xValue);

    Serial.print("Y value = ");
    Serial.println(yValue);
    delay(100);
}
Discussion
You can use techniques from the previous recipes to extract information from the accelerometer readings. You might need to check for a threshold to work out movement (see Recipe 6.6 for an example of threshold detection). You may need to average values like Recipe 6.7 to get values that are of use. If the accelerometer is reading horizontally, you can use the values directly to work out movement. If it is reading vertically, you will need to take into account the effects of gravity on the values. This is similar to the DC offset in Recipe 6.7, but it can be complicated, as the accelerometer may be changing orientation so that the effect of gravity is not a constant value for each reading.
See Also
SparkFun selection guide: http://www.sparkfun.com/commerce/tutorial_info.php?tutorials_id=167