
9
Liquid Crystal Displays
In this chapter you will
- Use character LCD modules to display text and numeric data
- Create custom characters to display on character LCD modules
- Use color LCD modules to display text and data
- Create a temperature history–graphing thermometer display
For some projects, you’ll want to display information to the user somewhere other than on a desktop computer monitor. One of the easiest and most versatile ways to display information is with a liquid crystal display (LCD) module and your Arduino. You can display text, custom characters, and numeric data using a character LCD module and color graphics with a graphic LCD module.
Character LCD Modules
LCD modules that display characters such as text and numbers are the most inexpensive and simplest to use of all LCDs. They can be purchased in various sizes, which are measured by the number of rows and columns of characters they can display. Some include a backlight and allow you to choose the color of the characters and the background color. Any LCD with an HD44780- or KS0066-compatible interface and a 5 V backlight should work with your Arduino. The first LCD we’ll use is a 16-character–by–2-row LCD module with a backlight, as shown in Figure 9-1.
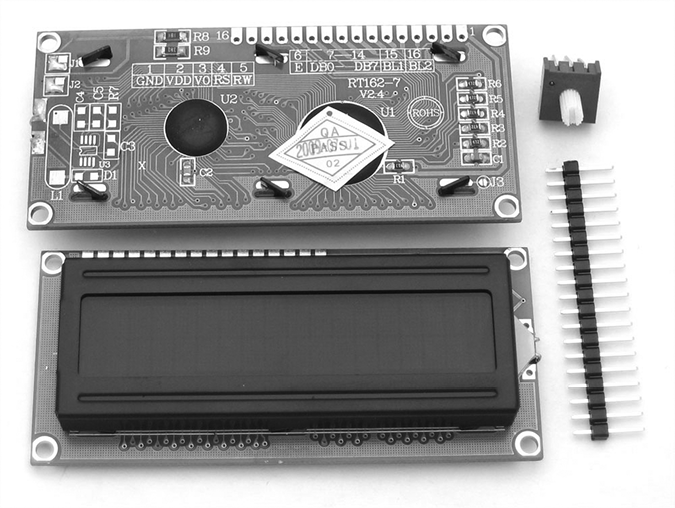
Figure 9-1: Example LCD module with trimpot and header pins
The trimpot (the variable resistor for the LCD) has a value of 10 kΩ and is used to adjust the display contrast. If the header pins have not already been soldered into the row of holes along the top of the LCD, you’ll need to do this to make insertion into the breadboard straightforward.
The holes along the top of the LCD are numbered 1 through 16. Number 1 is closest to the corner of the module and marked as VSS (connected to GND) in the schematic shown in Figure 9-2. We’ll refer to this schematic for all of the LCD examples in this book. In some rare situations, you could find yourself with an LCD that has a 4.2 V instead of a 5 V backlight. (If you are unsure of this, check with your supplier.) If this is the case, place a 1N4004 diode in series between the Arduino 5 V and the LCD LED+ pin.
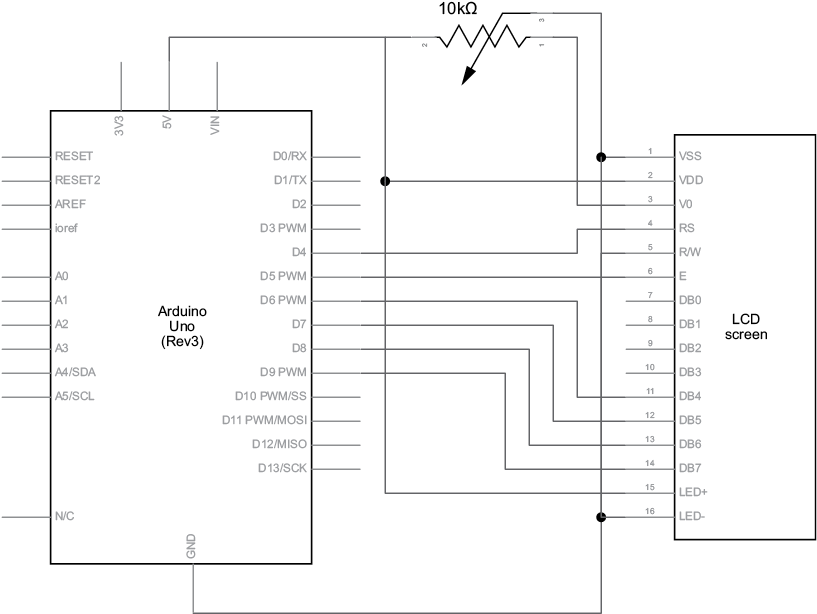
Figure 9-2: Basic LCD schematic
Using a Character LCD in a Sketch
To use the character LCD shown in Figure 9-1, we will first explore the required functions and how they work through some simple demonstrations. Before moving on, you’ll need to install the required Arduino library from the Library Manager. Using the method described in Chapter 7, search for and install the “LiquidCrystal by Arduino, Adafruit” library. Then you can enter and upload the basic sketch shown in Listing 9-1.
// Listing 9-1
#include <LiquidCrystal.h>
LiquidCrystal lcd(4, 5, 6, 7, 8, 9);  // pins for RS, E, DB4, DB5, DB6, DB7
void setup()
{
   lcd.begin(16, 2);
   lcd.clear();
}
void loop()
{
  lcd.setCursor(0, 5);
  lcd.print("Hello");
  lcd.setCursor(1, 6);
  lcd.print("world!");
  delay(10000);
}
Listing 9-1: LCD demonstration sketch
Figure 9-3 shows the result of Listing 9-1.

Figure 9-3: LCD demonstration: “Hello world!”
Now to see how the sketch in Listing 9-1 works. First, we need to add a line whose purpose is to include the library for LCD modules (which is automatically installed with the Arduino IDE). Then we need to tell the library which pins are connected to the Arduino. To do this, we add the following lines before the void setup() method:
#include <LiquidCrystal.h>
LiquidCrystal lcd(4, 5, 6, 7, 8, 9);  // pins for RS, E, DB4, DB5, DB6, DB7
The numbers entered in the LiquidCrystal function match the pins labeled on the LCD. If you’re unsure about your LCD’s pinouts, contact the supplier.
If you need to use different digital pins on the Arduino, adjust the pin numbers in the second line of this code.
Next, in void setup(), we tell the Arduino the size of the LCD in columns and rows. For example, here’s how we’d tell the Arduino that the LCD has 2 rows of 16 characters each:
lcd.begin(16, 2);Displaying Text
With the LCD setup complete, clear the LCD’s display with the following:
lcd.clear(); Then, to position the cursor, which is the starting point for the text, use this:
lcd.setCursor(x, y);Here, x is the column (0 to 15) and y is the row (0 or 1). Next, to display the word text, for example, you would enter the following:
lcd.print("text");Now that you can position and locate text, let’s move on to displaying variable data.
Displaying Variables or Numbers
To display the contents of variables on the LCD screen, use this line:
lcd.print(variable);If you’re displaying a float variable, you can specify the number of decimal places to use. For example, here lcd.print(pi, 3) tells the Arduino to display the value of pi to three decimal places, as shown in Figure 9-4:
  float pi = 3.141592654;
  lcd.print("pi: ");
lcd.print(pi, 3); 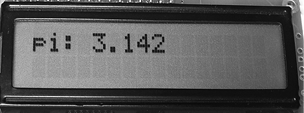
Figure 9-4: LCD displaying a floating-point number
When you want to display an integer on the LCD screen, you can display it in hexadecimal or binary, as shown in Listing 9-2.
// Listing 9-2
  int zz = 170;
  lcd.setCursor(0, 0);
  lcd.print("Binary: ");
  lcd.print(zz, BIN);    // display 170 in binary
  lcd.setCursor(0, 1);
  lcd.print("Hexadecimal: ");
  lcd.print(zz, HX);     // display 170 in hexadecimal
Listing 9-2: Functions for displaying binary and hexadecimal numbers
The LCD will then display the text shown in Figure 9-5.
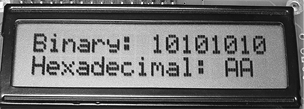
Figure 9-5: Results of the code in Listing 9-2
Project #28: Defining Custom Characters
In addition to using the standard letters, numbers, and symbols available on your keyboard, you can define up to eight of your own characters in each sketch. Notice in the LCD module that each character is made up of eight rows of five dots, or pixels. Figure 9-6 shows a close-up.

Figure 9-6: Each character is made up of eight rows of five pixels.
To display your own characters, you must first define each one using an array. For example, to create a smiley face, you could use the following:
byte a[8] = {  B00000,
               B01010,
               B01010,
               B00000,
               B00100,
               B10001,
               B01110,
               B00000  };
Each number in the array addresses an individual pixel in the display. A 0 turns off a pixel, and a 1 turns it on. The elements in the array represent the rows of pixels in the display; the top element is the top row, the next element is the second row down, and so on.
In this example, since the first element is B00000, all the pixels in the top row are turned off. In the next element, B01010, every other pixel is turned on, and the 1s form the tops of the eyes. The following rows continue to fill out the character.
Next, assign the array (which defines your new character) to the first of the eight custom character slots in void setup() with the following function:
lcd.createChar(0, a); // assign the array a[8] to custom character slot 0Finally, to display the character, add the following in void loop():
lcd.write(byte(0)); To display our custom character, we’d use the following code:
// Project 28 - Defining Custom Characters
#include <LiquidCrystal.h>
LiquidCrystal lcd(4, 5, 6, 7, 8, 9);  // pins for RS, E, DB4, DB5, DB6, DB7
byte a[8] = {  B00000,
               B01010,
               B01010,
               B00000,
               B00100,
               B10001,
               B01110,
               B00000  };
void setup()
{
   lcd.begin(16, 2);
   lcd.createChar(0, a);
}
void loop()
{
   lcd.write(byte(0));  // write the custom character 0 to the next cursor
                        // position
}
Figure 9-7 shows the smiley faces displayed on the LCD screen.

Figure 9-7: The result of Project 28
Character LCD modules are simple to use and somewhat versatile. For example, using what you’ve learned, you could create a detailed digital thermometer by combining this LCD and the temperature measurement part of Project 20, on page 122 in Chapter 6. However, if you need to display a lot of data or graphical items, you will need to use a graphic LCD module.
Graphic LCD Modules
Graphic LCD modules are larger and more expensive than character modules, but they’re also more versatile. You can use them not only to display text but also to draw lines, dots, circles, and more to create visual effects. The graphic LCD used in this book is a 128 × 160-pixel color module with an ST7735-compatible interface, as shown in Figure 9-8.

Figure 9-8: A graphic LCD module
Connecting the Graphic LCD
Before you can use the graphic LCD, you’ll need to connect eight wires between the LCD and the Arduino. This is easily done with male-to-female jumper wires, as the LCD has the connection pins presoldered at the factory. Make the connections as shown in Table 9-1.
Table 9-1: Connections Between the Graphic LCD Module and Arduino
| LCD pin label | To Arduino pin | LCD pin function |
| Vcc | 5 V | VDD |
| GND | GND | VSS (GND) |
| CS | D10 | Chip select |
| RST | D8 | Reset |
| A0 (or DC) | D9 | Control |
| SDA | D11 | Data in |
| SCK | D13 | Clock in |
| LED | 3.3 V | Backlight LED |
Using the LCD
Before moving on, you’ll need to install the required Arduino library from the Library Manager. Using the method described in Chapter 7, search for and install the “TFT by Arduino, Adafruit” library.
To use the LCD, insert the following three lines before void setup():
#include <TFT.h>               // include the graphics LCD library
#include <SPI.h>               // include the library for the SPI data bus

TFT TFTscreen = TFT(10, 9, 8); // allocate pins to LCD
#include <SPI.h>               // library for SPI data bus
(Don’t panic about the “SPI data bus”; for now, the line above is all you need to know. We’ll examine the SPI bus in more detail in Chapter 19.)
Then add the following lines inside void setup() to prepare the display:
  TFTscreen.begin();             // activate LCD
  TFTscreen.background(0, 0, 0); // clear the LCD screen
Controlling the Display
There are five text sizes you can choose from, as shown in Figures 9-9 and 9-10.
The first thing you need to consider is the background color for the display you are generating. This is set with:
TFTscreen.background(b, g, r); // set background color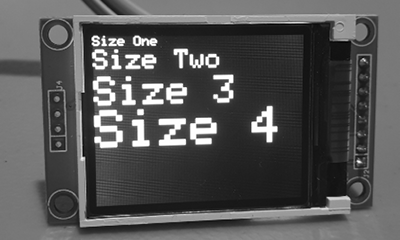
Figure 9-9: Four of the five text sizes available on the LCD

Figure 9-10: The largest of the five text sizes available on the LCD
You set the color of the background using RGB (red, green, blue) values between 0 and 255. For example, a white background would be maximum red, maximum green, and maximum blue—so 255, 255, 255. A pure red background would have a value of 255 for red and values of 0 for green and blue. For a black background, use zero for all three values. (You can find a handy list of RGB color tables at https://www.rapidtables.com/web/color/RGB_Color.html.)
Next, you need to set the text size if you’re writing text to the LCD for the first time or if you need to change the size mid-sketch. To do this, use:
TFTscreen.setTextSize(x);where x is a number between 1 and 5 that matches the text sizes shown in Figures 9-9 and 9-10.
Then you set the color of the text with the following function:
TFTscreen.stroke(B, G, R);where B, G, and R are the corresponding values for your blue, green, and red color levels, respectively.
Finally, to write text to your screen, use the following function:
TFTscreen.text("Hello, world!", x, y);This will display the text “Hello, world!” with the top left of the text positioned on the LCD at x, y.
This works great for static text. However, if you want to display a numeric variable, you need to do a little more work. The variable needs to be converted from a number type to a character array whose size will match the largest possible value. For example, if you’re reading the Arduino’s analog input 0 and want to display the value, use this:
char analogZero[4];Then during the sketch, before sending the analog value to the LCD, convert the value to a string, like so:
String sensorVal = String(analogRead(A0));This string gets converted and inserted into the character array:
sensorVal.toCharArray(analogZero, 4);Finally, to display the value on the LCD, we can use the .text() command as usual:
TFTscreen.text(analogZero, x, y);where the value of analogZero is displayed with the top left of the text positioned at x, y.
Now that we’ve been through all the commands for using text on the LCD, let’s put them into action in the next project.
Project #29: Seeing the Text Functions in Action
With this project, you’ll make your LCD display text in five sizes as well as the numeric value read from your Arduino’s analog input 0.
The Sketch
Wire up your LCD as described in Table 9-1 and then upload the following sketch:
// Project 29 - Seeing the Text Functions in Action
#include <TFT.h>  // Arduino TFT LCD library
#include <SPI.h>  // SPI bus library

TFT TFTscreen = TFT(10, 9, 8);     // allocate digital pins to LCD

char analogZero[4];

void setup()
{
  TFTscreen.begin();               // activate LCD
  TFTscreen.background(0, 0, 0);   // set display to black
}

void loop()
{
  TFTscreen.stroke(255, 255, 255); // white text
  TFTscreen.setTextSize(1);
  TFTscreen.text("Size One", 0, 0);
  TFTscreen.setTextSize(2);
  TFTscreen.text("Size Two", 0, 10);
  TFTscreen.setTextSize(3);
  TFTscreen.text("Size 3", 0, 30);
  TFTscreen.setTextSize(4);
  TFTscreen.text("Size 4", 0, 55);
  delay(2000);
  TFTscreen.background(0, 0, 0);   // set display to black
  TFTscreen.setTextSize(5);
  TFTscreen.text("Five", 0, 0);
  delay(2000);
  TFTscreen.background(0, 0, 0);   // set display to black
  TFTscreen.stroke(255, 255, 255); // white text
  TFTscreen.setTextSize(1);
  TFTscreen.text("Sensor Value :
 ", 0, 0);
  TFTscreen.setTextSize(3);
  String sensorVal = String(analogRead(A0));
  // convert the reading to a char array
  sensorVal.toCharArray(analogZero, 4);
  TFTscreen.text(analogZero, 0, 20);
  delay(2000);
  TFTscreen.background(0, 0, 0);   // set display to black
}
Running the Sketch
You should see all five sizes of text displayed on the LCD over two screens. Then you should see a third screen with the value from analog input 0, like the example shown in Figure 9-11.
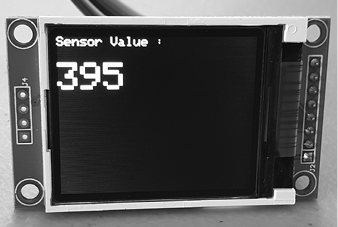
Figure 9-11: Analog input value shown on TFT LCD
Creating More Complex Display Effects with Graphic Functions
Now let’s look at the functions we can use to create various display effects. Keep in mind that the graphic LCD screen has a resolution of 160 columns by 128 pixels, but when we refer to these columns and pixels in functions in our sketches, they are counted from 0 to 159 across and 0 to 127 down. Also, as with the text example earlier, we still need to use the five lines of code mentioned in “Using a Character LCD in a Sketch” on page 169 to initialize the display.
There are various functions that allow you to display dots (single pixels), lines, rectangles, and circles on the display. Apply your project requirements and add a dash of imagination to create a colorful and useful display output. We’ll run through those functions now, and then you can see them in action through a demonstration sketch.
Before drawing any object, you need to define its color. This is done with
TFTscreen.stroke(B, G, R);where B, G, and R are the corresponding values for your blue, green, and red color levels, respectively.
To draw a single dot on the display, we use
TFTscreen.point(X, Y);where X and Y are the horizontal and vertical coordinates of the dot. With our LCD, the X range falls between 0 and 159 and the Y range falls between 0 and 127.
To draw a line from one point to another, we use
TFTscreen.line(X1, Y1, X2, Y2);where X1 and Y1 are the coordinates of the starting point and X2 and Y2 are the coordinates of the end of the line.
To draw a circle, we use
TFTscreen.circle(X, Y, R);where X and Y are the coordinates of the center of the circle, and R is the radius of the circle in pixels. If you wish to fill the circle (or a rectangle, described a bit later) with a color, instead of just drawing an outline, precede the circle() function with
TFTscreen.fill(B, G, R);where B, G, and R are the corresponding values for your blue, green, and red fill levels, respectively. Note that a fill color doesn’t change the shape’s outline, so you still need to precede the shape function with the stroke() function.
If you wish to draw more than one filled item, you only need to use the fill() command once. If you then want to turn off the fill and revert to outlines only, use this:
TFTscreen.noFill();Finally, you can draw rectangles with the following function:
TFTscreen.rect(X1, Y1, X2, Y2);where X1, Y1 are the coordinates for the top left of the rectangle and X2, Y2 are the coordinates for the bottom right of the rectangle.
Project #30: Seeing the Graphic Functions in Action
Now that we’ve been through all the commands for using the graphic functions on the LCD, let’s put them into action in this project.
The Sketch
Wire up your LCD as described in Table 9-1 and then upload the following sketch:
// Project 30 - Seeing the Graphic Functions in Action

#include <TFT.h>                 // Arduino TFT LCD library
#include <SPI.h>                 // SPI bus library
TFT TFTscreen = TFT(10, 9, 8);   // allocate digital pins to LCD

int a;

void setup()
{
  TFTscreen.begin(); // activate LCD
  TFTscreen.background(0, 0, 0); // set display to black
  randomSeed(analogRead(0));     // for random numbers
}

void loop()
{
  // random dots
  for (a = 0; a < 100; a++)
  {
    TFTscreen.stroke(random(256), random(256), random(256));
    TFTscreen.point(random(160), random(120));
    delay(10);
  }
  delay(1000);
  TFTscreen.background(0, 0, 0); // set display to black

  // random lines
  for (a = 0; a < 100; a++)
  {
    TFTscreen.stroke(random(256), random(256), random(256));
    TFTscreen.line(random(160), random(120), random(160), random(120));
    delay(10);
  }
  delay(1000);
  TFTscreen.background(0, 0, 0); // set display to black

  // random circles
  for (a = 0; a < 50; a++)
  {
    TFTscreen.stroke(random(256), random(256), random(256));
    TFTscreen.circle(random(160), random(120), random(50));
    delay(10);
  }
  delay(1000);
  TFTscreen.background(0, 0, 0); // set display to black

  // random filled circles
  for (a = 0; a < 50; a++)
  {
    TFTscreen.fill(random(256), random(256), random(256));
    TFTscreen.stroke(random(256), random(256), random(256));
    TFTscreen.circle(random(160), random(120), random(50));
    delay(10);
  }
  delay(1000);
  TFTscreen.background(0, 0, 0); // set display to black

  // random rectangles
  TFTscreen.noFill();
  for (a = 0; a < 50; a++)
  {
    TFTscreen.stroke(random(256), random(256), random(256));
    TFTscreen.rect(random(160), random(120), random(160), random(120));
    delay(10);
  }
  delay(1000);
  TFTscreen.background(0, 0, 0); // set display to black

  // random filled rectangles
  TFTscreen.noFill();
  for (a = 0; a < 50; a++)
  {
    TFTscreen.fill(random(256), random(256), random(256));
    TFTscreen.stroke(random(256), random(256), random(256));
    TFTscreen.rect(random(160), random(120), random(160), random(120));
    delay(10);
  }
  delay(1000);
  TFTscreen.background(0, 0, 0); // set display to black
}
After the sketch has uploaded, the display will run through all the graphic functions we have examined in this chapter. For example, you should see the lines shown in Figure 9-12.
With the functions discussed so far and some imagination, you can create a variety of display effects or display data graphically. In the next section, we’ll build on our quick-read thermometer project using the LCD screen and some of these functions.
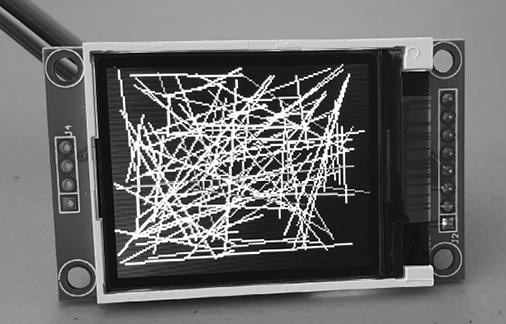
Figure 9-12: Random lines on the LCD
Project #31: Creating a Temperature History Monitor
In this project, our goal is to measure the temperature once every 20 minutes and display the last 120 readings in a dot graph. Each reading will be represented as a pixel, with the temperature on the vertical axis and time on the horizontal axis.
The most current reading will appear on the left, and the display will continually scroll the readings from left to right. The current temperature will also be displayed as a numeral.
The Algorithm
Although it may sound complex, this project is fairly easy, requiring only two functions. The first function takes a temperature reading from the TMP36 temperature sensor and stores it in an array of 120 values. Each time a new reading is taken, the previous 119 values are moved down the array to make way for the new reading, and the oldest reading is erased.
The second function draws on the LCD screen. It displays the current temperature, a scale for the graph, and the positions of each pixel for the display of the temperature data over time.
The Hardware
Here’s what you’ll need to create this project:
- One 160 × 128-pixel ST7735 TFT LCD module, as used in this chapter
- One TMP36 temperature sensor
- Various connecting wires
- One breadboard
- Arduino and USB cable
Connect the graphic LCD as described in Table 9-1 and connect the TMP36 sensor to 5 V, analog 5, and GND as you did in Project 20 in Chapter 6.
The Sketch
Our sketch combines the code we used to measure temperature in Chapter 6 and the graphic functions described earlier in this chapter. Enter and upload the following sketch, which includes relevant comments about the functions used:
// Project 31 - Creating a Temperature History Monitor

#include <TFT.h>  // Arduino TFT LCD library
#include <SPI.h>  // SPI bus library

TFT TFTscreen = TFT(10, 9, 8);
// allocate digital pins to LCD

int tcurrent = 0;
int tempArray[120];

char currentString[3];

void getTemp() // function to read temperature from TMP36
{
  float sum = 0;
  float voltage = 0;
  float sensor = 0;
  float celsius;

  // read the temperature sensor and convert the result to degrees C
  sensor   = analogRead(5);
  voltage  = (sensor * 5000) / 1024;
  voltage  = voltage - 500;
  celsius  = voltage / 10;
  tcurrent = int(celsius);

  // insert the new temperature at the start of the array of past temperatures
  for (int a = 119 ; a >= 0 ; --a )
  {
    tempArray[a] = tempArray[a - 1];
  }
  tempArray[0] = tcurrent;
}

void drawScreen() // generate TFT LCD display effects
{
  int q;
  // display current temperature
  TFTscreen.background(0, 0, 0);   // clear screen to black
  TFTscreen.stroke(255, 255, 255); // white text
  TFTscreen.setTextSize(2);
  TFTscreen.text("Current:", 20, 0);
  String tempString = String(tcurrent);
  tempString.toCharArray(currentString, 3);
  TFTscreen.text(currentString, 115, 0);
  // draw scale for graph
  TFTscreen.setTextSize(1);
  TFTscreen.text("50", 0, 20);
  TFTscreen.text("45", 0, 30);
  TFTscreen.text("40", 0, 40);
  TFTscreen.text("35", 0, 50);
  TFTscreen.text("30", 0, 60);
  TFTscreen.text("25", 0, 70);
  TFTscreen.text("20", 0, 80);
  TFTscreen.text("15", 0, 90);
  TFTscreen.text("10", 0, 100);
  TFTscreen.text(" 5", 0, 110);
  TFTscreen.text(" 0", 0, 120);
  TFTscreen.line(20, 20, 20, 127);
  // plot temperature data points
  for (int a = 25 ; a < 145 ; a++)
  {
    // convert the temperature value to a suitable y-axis position on the LCD
    q = (123 - (tempArray[a - 25] * 2));
    TFTscreen.point(a, q);
  }
}

void setup()
{
  TFTscreen.begin();             // activate LCD
  TFTscreen.background(0, 0, 0); // set display to black
}

void loop()
{
  getTemp();
  drawScreen();
  for (int a = 0 ; a < 20 ; a++) // wait 20 minutes until the next reading
  {
    delay(60000);                // wait 1 minute
  }
}
Running the Sketch
The resulting display should look something like Figure 9-13.

Figure 9-13: Results of Project 31
Modifying the Sketch
Different people can interpret data better when they see it presented in different visual formats. For this reason, you may want to create a bar graph instead, with vertical lines indicating the values.
This type of project could also be used to display other kinds of data, such as the voltage from various sensors as measured by analog input pins. Or you could add another temperature sensor and show both values at once. Almost anything that returns a value can be displayed using the graphic LCD module.
Looking Ahead
Now that you have experience with LCDs, you can see that the Arduino is in fact a small computer: it can accept and process incoming data and display it to the outside world. But this is only the beginning. In the next chapter, you’ll examine libraries in much more depth, learn to write your own library, and then use your new library with the temperature sensor used in previous projects.