Chapter 14
Printing and Plotting
Plotting is the term for producing physical prints using a large-format printer, which is either networked or directly connected to an AutoCAD® workstation. There is much more to plotting a drawing or publishing an entire sheet set than hitting the Print icon, however. Before you can successfully print, you must first learn to configure a plotter and a plot style table; you’ll then learn how to create professional output from modelspace and/or paperspace. As you’ll see in this chapter, you’ll also have the option to keep everything in digital format and export DWF or PDF files that can be shared on the Internet with your partners and clients.
- Configuring output devices
- Creating plot style tables
- Using plot style tables
- Plotting in modelspace
- Plotting layouts in paperspace
- Exporting to an electronic format
Configuring Output Devices
In the most general sense, everything you do on a computer is a form of input. Creating physical or even electronic drawings, on the other hand, are forms of output. Output devices are more commonly known as printers.
Large-format (24″ wide or larger) printers are marketed as “plotters” because of the history of technology. When I started my career more than 20 years ago, plotters had technical pens in them that you had to refill individually with ink. The paper (actually Mylar film) was rolled back and forth, and the pens literally plotted one line at a time. Thankfully, modern inkjet technology is much faster, so you no longer wind up with clogged pens and ink on your hands.
In the following sections, you will configure an output device by setting up a system printer and an AutoCAD plotter. Once these steps are completed, you won’t have to perform them again on the same computer.
Setting Up a System Printer
The first thing you’ll need to do is set up a system printer, which contains drivers that your operating system uses to control the output device. System printers are not specific to AutoCAD; device manufacturers supply drivers, which you then install to become printers on your system.
If you are reading this book at work, you undoubtedly already have a system printer or your CAD manager has installed one for you. For the purposes of this book, however, you will install a driver for the HP DesignJet 800 plotter (an industry workhorse), whether or not you own this device. You will be using the HP DesignJet 800 system printer in this chapter. The following steps guide you in installing this typical system printer:
1. Open your browser, and type
HP DesignJet 800 42 driver as a Google search. Select the first search result, or go to
www.hp.com and search for Download Drivers and Software.
2. Select your operating system from the list, and download the appropriate driver.
3. Install the driver following the manufacturer’s instructions. Select File:Port in the installation options because you don’t have access to the actual device. If you did have the physical device, you would select the relevant connection port, such as Parallel, Ethernet, USB, or Wireless.
Setting Up an AutoCAD Plotter
Most programs send output directly to system printers, but AutoCAD is an exception. AutoCAD has another layer of software between the program and the operating system known as an AutoCAD plotter. In this section, you will set up an AutoCAD plotter that sends its output to the system printer, which in turn hands off the print job to the output device itself.
AutoCAD for Mac doesn’t use AutoCAD plotters but instead outputs directly to the system printers listed under System Preferences.
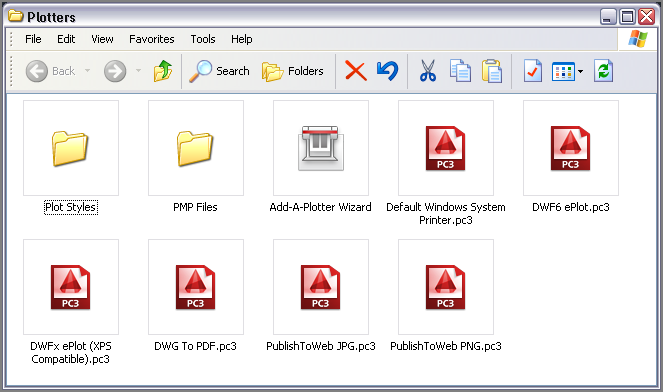
1. In AutoCAD, type
PLOTTERMANAGER and press Enter. The Windows Explorer dialog box appears displaying the Add-A-Plotter Wizard and various AutoCAD plotters that have the
.pc3 file extension (see
Figure 14-1).
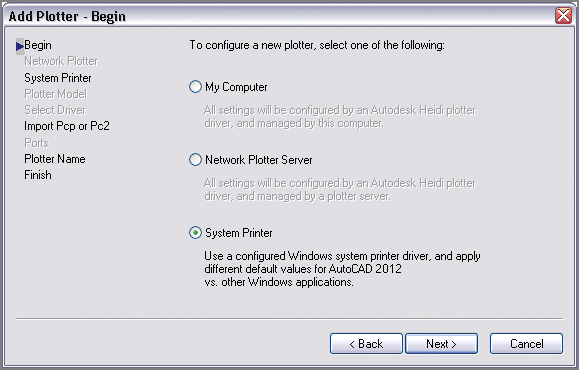
2. Double-click the Add-A-Plotter Wizard. Read the Introduction page and click Next.
3. Select the System Printer radio button (see
Figure 14-2) and click Next.
Plotting Raster Images to Scale
For more information on setting up and plotting to a raster plotter driver in AutoCAD, see my book Enhancing Architectural Drawings and Models with Photoshop (Sybex, 2010). Raster images of drawing layers can be output to scale from AutoCAD and enhanced in Photoshop for presentation.
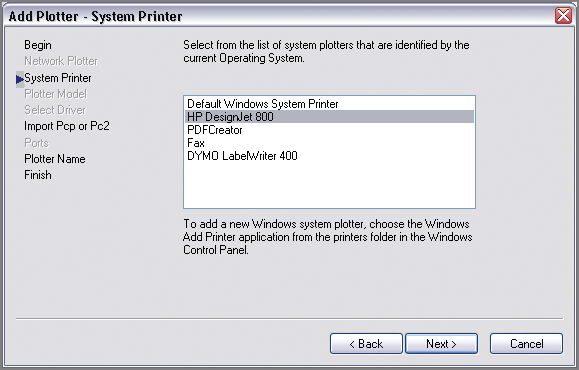
4. Select the HP DesignJet 800 system printer from the list in the Add Plotter – System Printer dialog box (see
Figure 14-3). The listed printers will differ on your computer depending on which drivers you (or your CAD manager) have already installed on your system. Click Next.
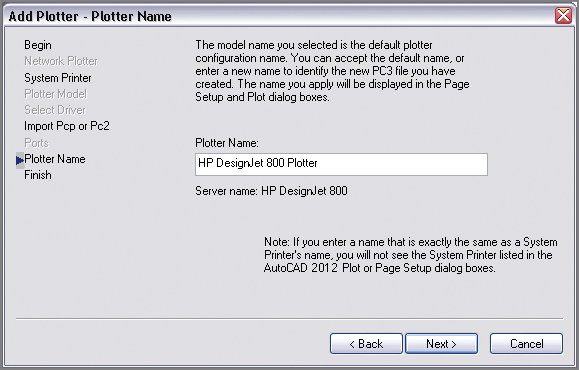
5. The next page allows you to import a legacy PCP or PC2 file from older versions of AutoCAD. Since you are creating a PC3 file from scratch, click Next to open the Add Plotter – Plotter Name page.
6. AutoCAD now suggests a name for the plotter that is identical to the name of the system printer. Type the name
HP DesignJet 800Plotter to differentiate the new printer name from the system printer (see
Figure 14-4). Click Next.
Edit the Custom Properties in the Plotter Configuration Editor to access settings specific to the system printer driver.
7. The final page of the Add Plotter wizard allows you to edit the newly created plotter driver itself. Click the Edit Plotter Configuration button to do this.
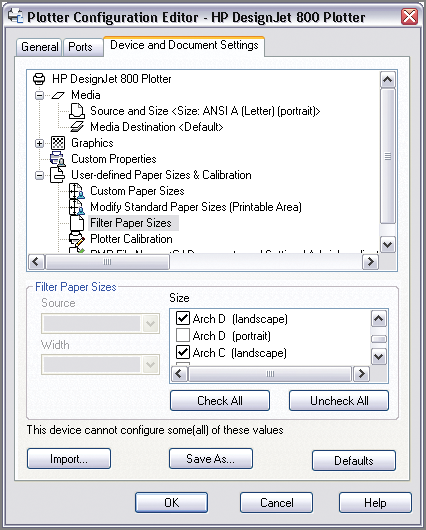
8. Select the Device And Document Settings tab, and then select the Filter Paper Sizes node in the Plotter Configuration Editor dialog box that appears. Click the Uncheck All button. You should filter the list of paper sizes to display only the sizes you use. Scroll down the list, and select the following paper sizes: Arch C (landscape) and Arch D (landscape).
Figure 14-5 shows the result.
9. Click OK to close the Plotter Configuration Editor. Click Finish to close the Add-A-Plotter Wizard.
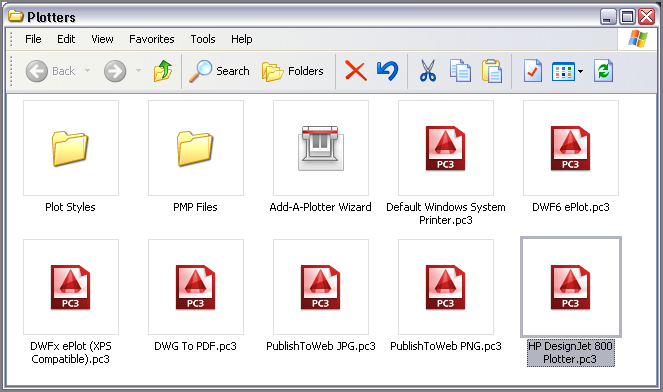
10. The new AutoCAD plotter driver you just created,
HP DesignJet 800 Plotter.pc3, appears in the Windows Explorer window that was opened in step 1 (see
Figure 14-6). Close Windows Explorer.
Creating Plot Style Tables
You cannot create or modify plot styles on the Mac version of AutoCAD—you can use only the default plot styles.
Plot style tables determine the final appearance of objects in terms of their color, linetype, lineweight, end cap, line fill, and screening percentage. Plot style tables take precedence over layer properties when the drawing is printed.
In addition to creating a system printer and AutoCAD plotter, you will need to create a plot style table or use an existing one. AutoCAD has two types of plot style tables: color-dependent and named.
Color-Dependent Plot Style Tables (CTB Files) These have been used since the days of pen plotters when you assigned a number of colors in AutoCAD to a specific physical pen. For example, red objects might plot using the 0.5 mm pen, and green and yellow objects might use the 0.7 mm pen. Many firms still use color-dependent plot style tables today.
Named Plot Styles (STB Files) These were a new feature in AutoCAD 2000. Named plot style tables offer greater flexibility as compared with color-dependent plot styles because plot criteria can be assigned by layer or by object rather than by color only. In the following exercise, you will create a named plot style. Named plot styles use the .stb file extension.
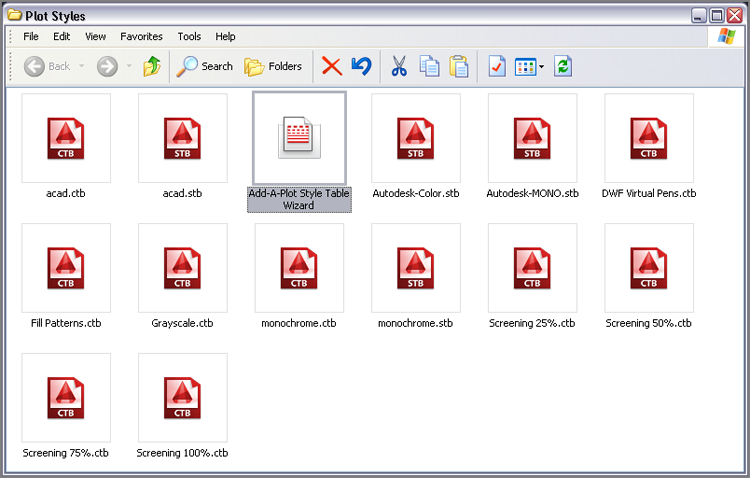
1. Type
STYLESMANAGER, and press Enter. Windows Explorer appears and displays a number of preset plot style table files (see
Figure 14-7).
2. Double-click the Add-A-Plot Style Table Wizard. Read the introductory page and then click Next.
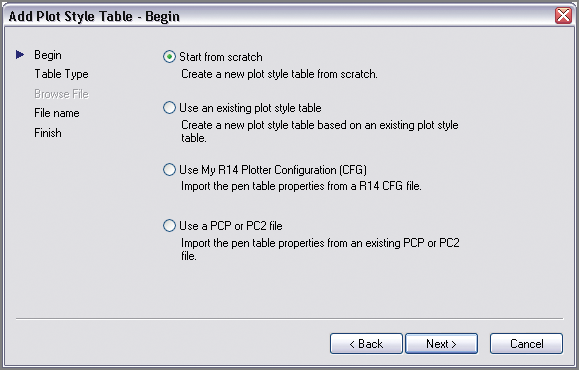
3. Select Start From Scratch on the next page (see
Figure 14-8). Click Next.
4. Select the Named Plot Style radio button on the next page. This will create a named plot style having one default style called Normal. Click Next.
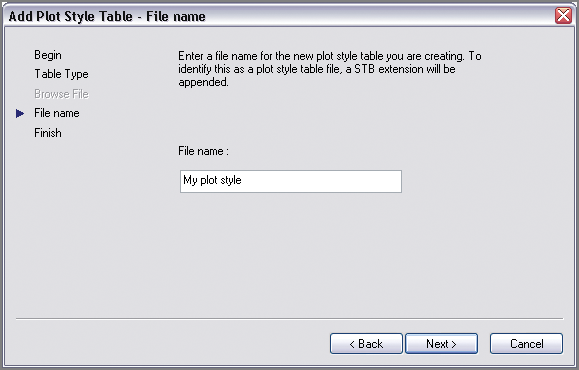
5. For lack of a more descriptive name, type
My plot style on the File Name page (see
Figure 14-9). Click Next.
6. The final page of the wizard allows you to edit the newly created STB file itself. Click the Plot Style Table Editor button.
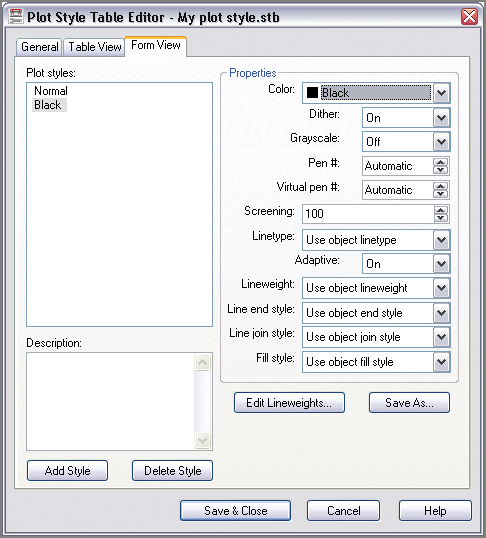
7. Select the Form View tab in the Plot Style Table Editor that appears. Click the Add Style button. Type Black, and press Enter.
8. Open the Color drop-down, and select Black (see
Figure 14-10).
9. Click the Add Style button again, type 20% Screen, and press Enter. Highlight the value next to the word Screening, type 20, and press Tab. Click Save & Close to close the Plot Style Table Editor.
Screening refers to the intensity of ink sprayed on the paper while plotting. Selecting 100 directs the inkjet print head to spray at full intensity whereas setting this value to 0 will not spray any ink. Intermediate values produce varying levels of grayscale.
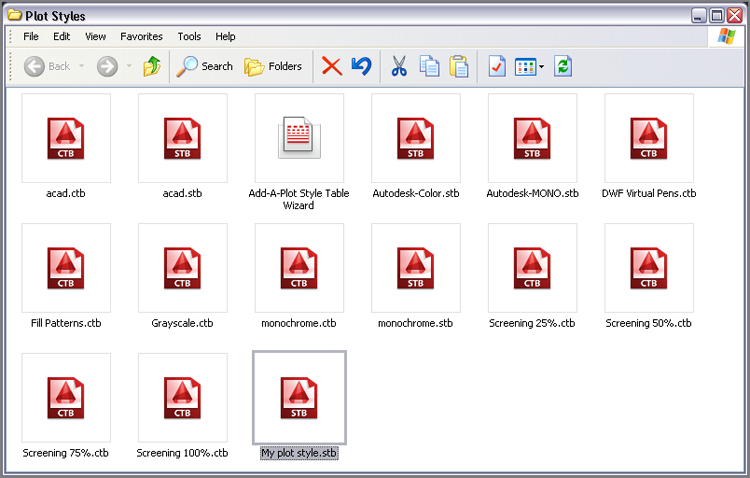
10. Click Finish to close the Add Plot Style Table wizard. The named plot style table you just created,
My plot style.stb, appears in the Windows Explorer window that was opened in step 1 (see
Figure 14-11). Click the close box in Windows Explorer.
Using Plot Style Tables
New drawings are created using either color-dependent or named plot style tables. A setting in the Options dialog box controls this behavior. Existing drawings must go through a conversion process to switch from utilizing one plot style table type to the other.
After you decide (or your CAD manager decides for you) which type of plot style table to use consistently, you will want to save a template that records this preference so that you don’t have to revisit this issue every time you create a new drawing.
In the next exercise, you will configure new drawings to utilize named plot style tables and learn how to use plot styles by layer or by object.
Configuring New Drawings for Named Plot Style Tables
In the following steps, you will configure new drawings to use named plot styles and you will save a template that has a named plot style table assigned:
1. Type OP (for Options), and press Enter. Select the Plot And Publish tab in the Options dialog box that appears.
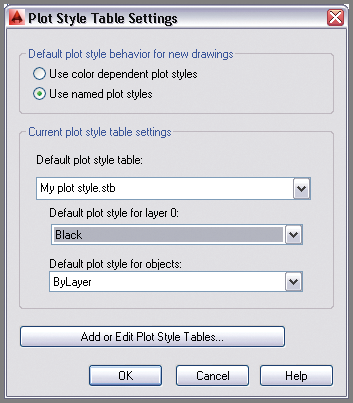
2. Click the Plot Style Table Settings button in the lower right of the Options dialog box. Select the Use Named Plot Styles radio button in the Plot Style Table Settings dialog box that appears. Select
My plot style.stb from the Default Plot Style Table drop-down menu. Select Black from the Default Plot Style For Layer 0 drop-down menu. Select ByLayer from the Default Plot Style For Objects drop-down menu if it is not already selected (see
Figure 14-12). Click OK, and then click OK again to close both of the open dialog boxes.
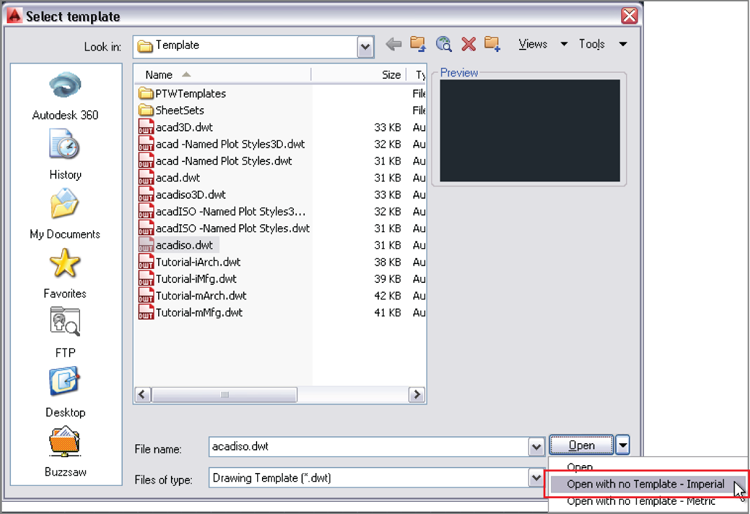
3. Click the New button on the File tabs. Click the arrow button adjacent to the Open button in the Select Template dialog box that appears. Choose Open With No Template – Imperial from the drop-down menu (see
Figure 14-13).
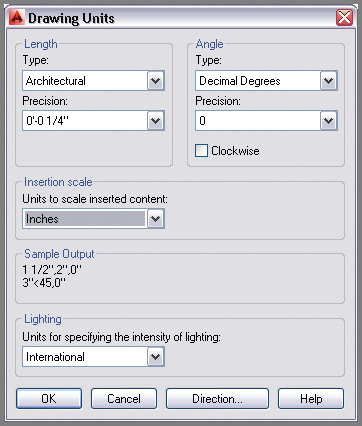
4. Type
UN (for Units), and press Enter. Choose Architectural units (or Decimal units in metric) with a precision of 1/4″ (metric users choose a precision of 0.0). Set Units To Scale Inserted Content under the Insertion Scale area to Inches (or Centimeters in metric) (see
Figure 14-14). Click OK.
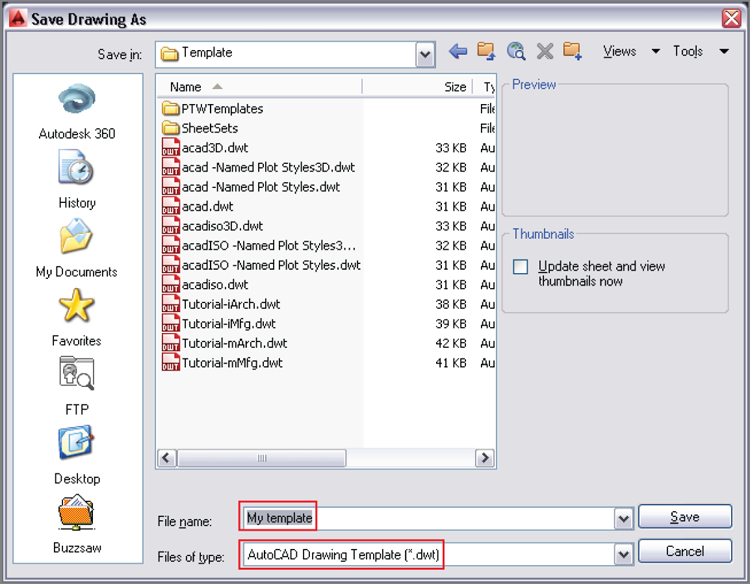
5. Click the Save As button in the Quick Access toolbar. Change the Files Of Type drop-down in the Save Drawing As dialog box that appears to AutoCAD Drawing Template (*.dwt). Type
My template in the File Name text box (see
Figure 14-15). Click Save.
AutoCAD® 2014 allows you to save a copy of any template or drawing file remotely in Autodesk 360 within the Save As dialog box. Autodesk 360 also appears in Windows Explorer, fully integrated into Windows’ filesystem. Saving and opening drawings in the cloud is now as simple as saving and opening locally.
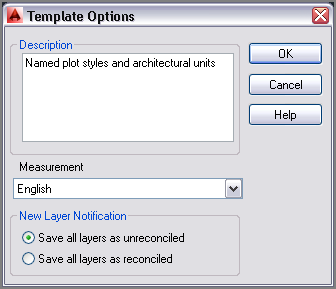
6. Type
Named plot styles and architectural units in the Template Options dialog box that appears (see
Figure 14-16). Click OK.
7. Type CLOSE, and press Enter.
You can now create new drawings that have named plot styles (and architectural or decimal units) simply by selecting My Template—no other configuration is required.
Switching Plot Style Table Types in Existing Drawings
If you are switching from named plot styles to color-dependent plot styles in an existing drawing, use the CONVERTPSTYLES command to make the conversion. If you are going in the other direction and converting an existing drawing from color-dependent plot styles to named plot styles, you must first use the CONVERTCTB command and then use CONVERTPSTYLES.
Assigning Plot Styles by Layer or by Object
If you are working in a drawing that uses a color-dependent plot style table, then the plot styles are automatically configured by color. When working on a drawing that uses a named plot style table, you will need to assign named plot styles by layer and/or by object, as shown in the following exercise:
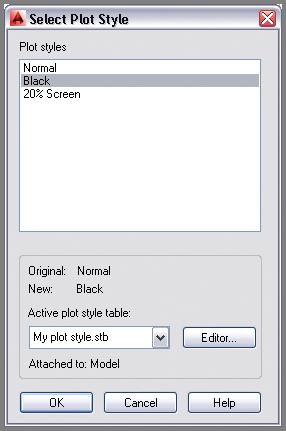
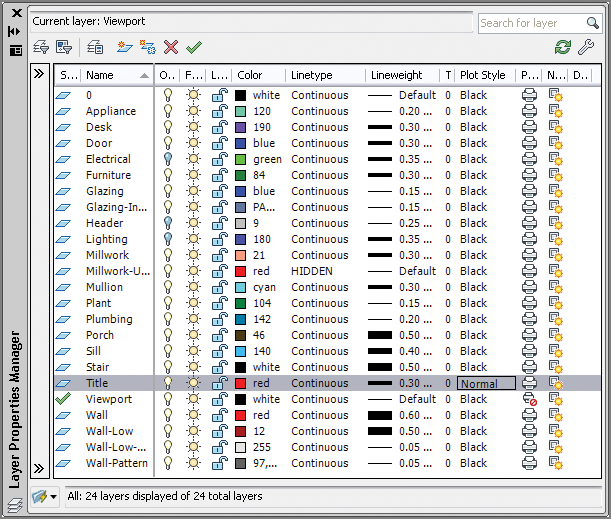
2. Type
LA (for Layer), and press Enter. Right-click any one of the layer names in the Layer Properties Manager that appears, and choose Select All from the context menu. Click the word Normal in the Plot Style column. The plot style table you created earlier (
My plot style.stb) is selected. Choose Black in the Select Plot Style dialog box (see
Figure 14-17). Click OK. Now all the layers will plot in black.
3. Click the Title layer in the Layer Properties Manager to select it; all the other layers automatically deselect. Click the Plot Style on the Title layer, and change it to Normal in the Select Plot Style dialog box that appears (see
Figure 14-18). The title text will now appear in red.
The Normal plot style in
My plot style.stb outputs objects in color.
4. Close the Layer Properties Manager.
5. Select the ribbon’s View tab. Click the Properties button in the Palettes panel.
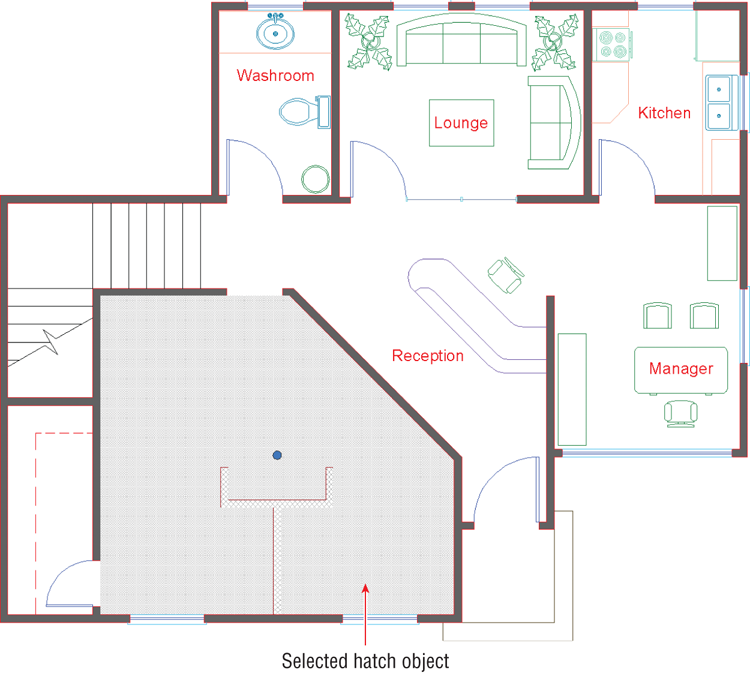
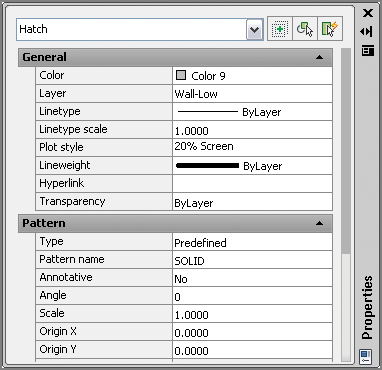
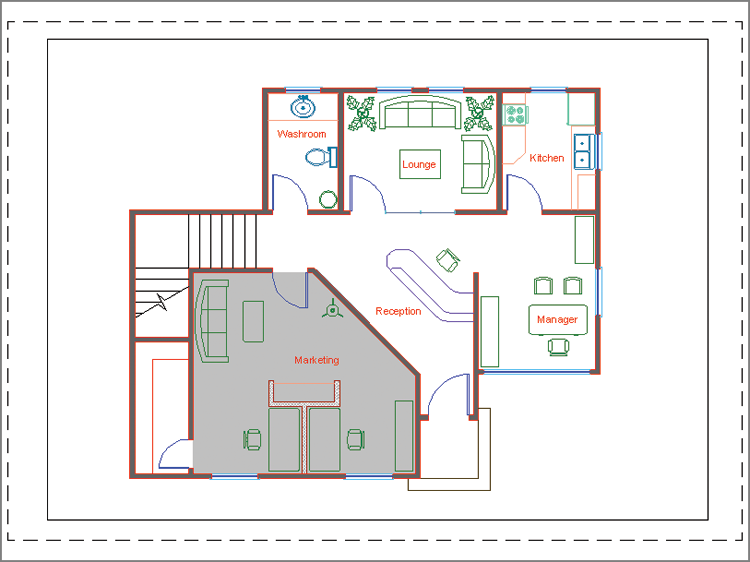
6. Click the solid hatch of the flooring in Marketing to select it (see
Figure 14-19).
7. Open the Plot Style drop-down in the Properties palette, and select Other from the menu. Select 20% Screen in the Select Plot Style dialog box that appears. Click OK, and 20% Screen is listed as the plot style for the Hatch object in the Properties palette (see
Figure 14-20). This object will plot with reduced intensity, so the hatch appears lighter.
8. Press Esc to deselect. Close the Properties palette.
9. Save your work as Ch14-B.dwg.
Plotting in Modelspace
You can plot whatever you are working on in modelspace at any time. This is usually done to create a test plot, so that you (or your colleagues) can check and possibly mark up the evolving design on paper. In the following steps, you will create a test plot in modelspace.
1. Open the Ch14-B.dwg file. If this file is not open, find it on the book’s web page.
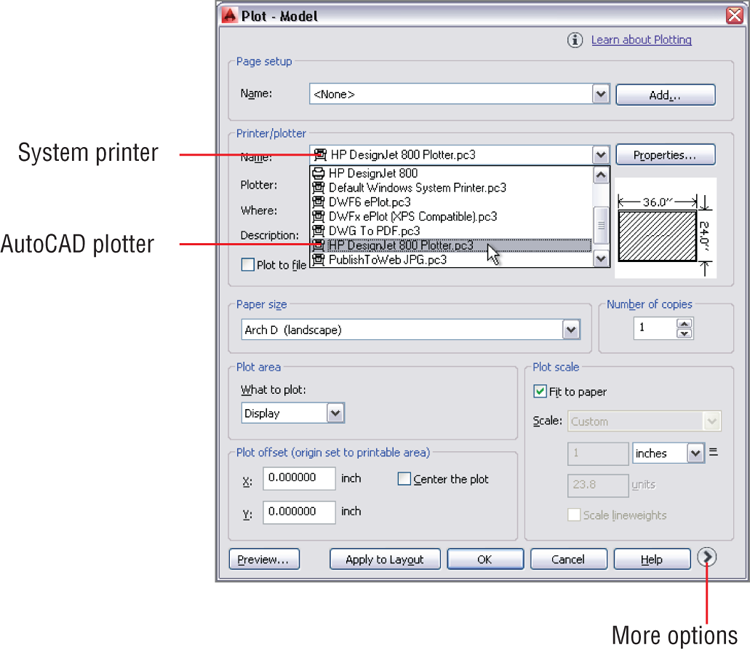
2. Click the Plot tool in the Quick Access toolbar. Open the Name drop-down menu in the Plot – Model dialog box (see
Figure 14-21). Observe that both a system printer and an AutoCAD plotter appear for the HP DesignJet 800 device. Click Cancel.
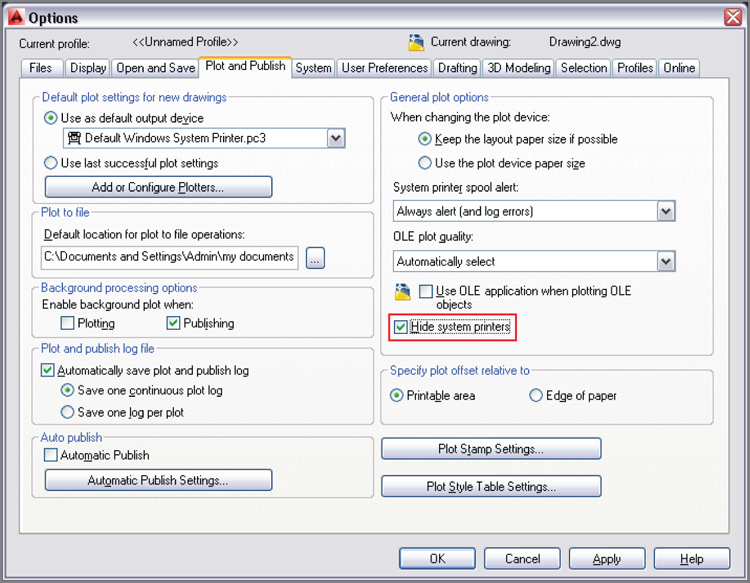
3. It can be confusing seeing the system printers and AutoCAD plotters in the same drop-down menu in the Plot dialog box. You should hide the system printers to remove this doubling of potential output drivers. Type OP (for Options), and press Enter.
4. Select the Plot And Publish tab. Select Hide System Printers in the General Plot Options area (see
Figure 14-22). Click OK.
Choose the Fit To Paper option if you don’t care about plotting to scale. Pay attention to the plot thumbnail when selecting specific scales to see if the drawing will fit on the chosen paper size.
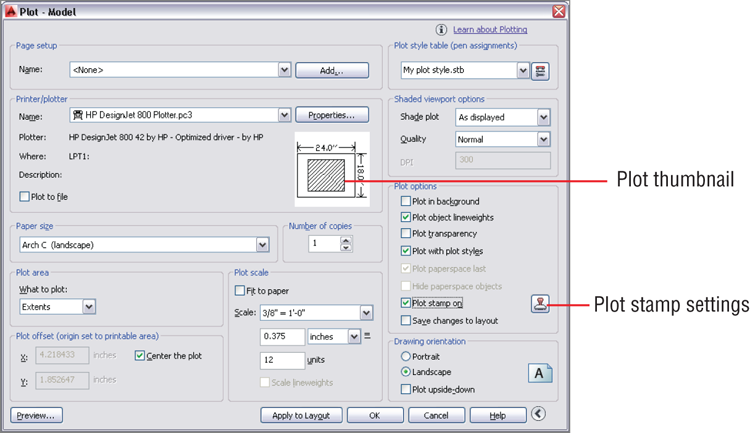
5. Type
PLOT, and press Enter. Select the
HP DesignJet 800 Plotter.pc3 from the Name drop-down menu (no system printers appear). Select Arch C (landscape) in the Paper Size area and Extents in the What To Plot drop-down menu. Select Center The Plot in the Plot Offset area, deselect Fit To Paper in the Plot Scale area, and 3/8″ = 1′-0″ from the Scale drop-down menu. Click the More Options button to expand the dialog box. Select
My plot style.stb in the Plot Style Table area. Select Plot Stamp On in the Plot Options area (see
Figure 14-23).
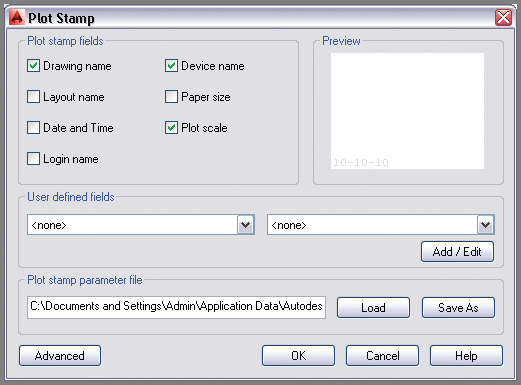
6. Click the Plot Stamp Settings button, as shown in
Figure 14-23. Select Drawing Name, Device Name, and Plot Scale in the Plot Stamp dialog box that appears (see
Figure 14-24). Click OK.
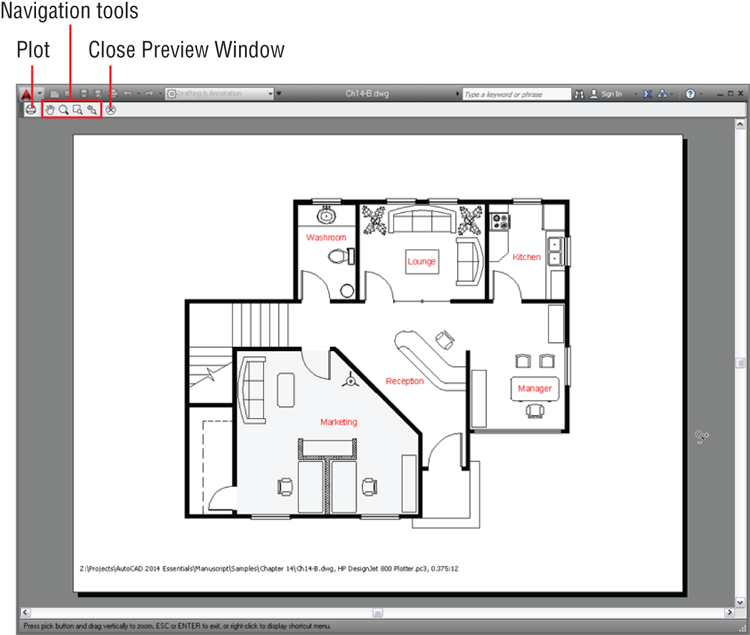
7. Click the Preview button in the Plot – Model dialog box. Click Continue in the Plot – Plot Scale Confirm dialog box that appears. A preview window temporarily replaces the user interface (see
Figure 14-25).
8. Click the Plot icon, as shown in
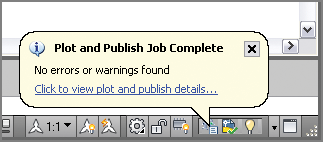
Figure 14-25. The plot is immediately sent to the hypothetical HP DesignJet 800 output device. If this device were really attached to your computer, it would start plotting within a few seconds. Once the plot has been sent, a notification window appears in the lower-right corner of the user interface (see
Figure 14-26). The plot is complete; click the close box in the notification window.
9. Save your work as Ch14-C.dwg.
Plotting Layouts in Paperspace
Layouts are the preferred plotting environment where you can display multiple scaled drawings within viewports, surrounded by title blocks containing text, and/or having dimensions in paperspace. In the following steps, you will create and plot two layouts from paperspace:
1. Open the Ch14-C.dwg file. If this file is not open, find it on the book’s web page.
Layouts are always plotted at 1:1 scale in Imperial units. Metric layouts are also plotted at 1:1 scale if one millimeter equals one drawing unit, or at 10:1 scale if you decide one centimeter equals one drawing unit.
2. Click the Layout1 icon on the status bar. A single viewport is automatically generated on the layout.
3. Click the ribbon’s Output tab, and click the Page Setup Manager icon in the Plot panel. Click the New button in the Page Setup Manager dialog box that appears. Click OK in the New Page Setup dialog box to accept the default name of Setup1. Click OK to return to the Page Setup Manager.
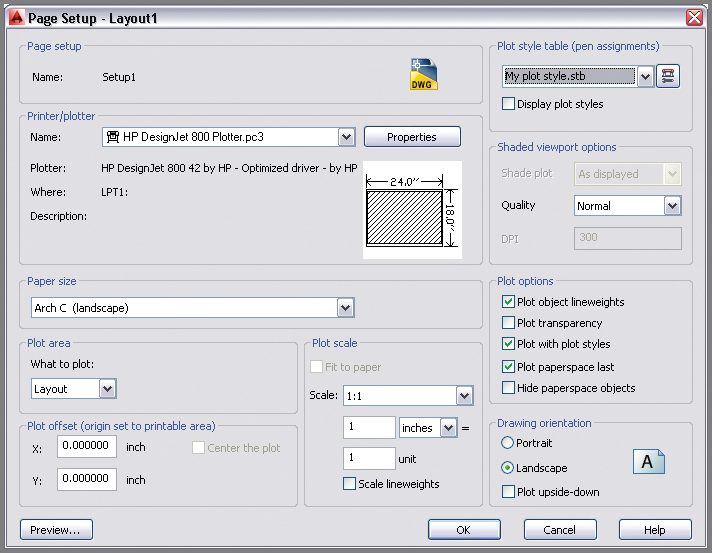
4. In the Page Setup dialog box that appears, click the Modify button, open the Name drop-down menu, and select
HP DesignJet 800 Plotter.pc3. Then select Arch C (landscape) in the Paper Size drop-down menu. Select
My plot style.stb in the Plot Style Table drop-down menu (see
Figure 14-27). Click OK.
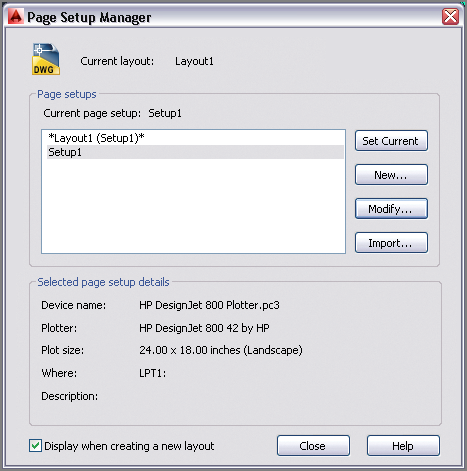
5. The Page Setup Manager dialog box now lists Setup1 as a saved page setup. Select Display When Creating A New Layout (see
Figure 14-28). Click the Set Current button, and then click Close.
6. Double-click within the viewport to activate floating modelspace. Select 3/8″ = 1′-0″ from the Viewport Scale menu on the status bar. Double-click outside the viewport on the drawing canvas to return to paperspace.
7. Select the viewport, and stretch its grips to reveal and center the entire building, as shown in
Figure 14-29. You might need to move the viewport to center the building on the page, depending on how you stretch the grips.
8. Press Ctrl+P to execute the PLOT command. Deselect Plot Stamp On in the Plot dialog box that appears. Click OK, and the plot is processed. Close the plot notification window when it appears.
9. Click the Quick View Layouts icon in the status bar. Click New Layout in the toolbar that appears, and then click the Layout2 icon to initialize it.
10. Select Setup1 in the Page Setup Manager that appears, and click the Set Current and Close buttons. Layout2 is configured the same way as Layout1.
11. Double-click inside the viewport to activate floating modelspace. Select 3/8″ = 1′-0″ from the Viewport Scale menu on the status bar.
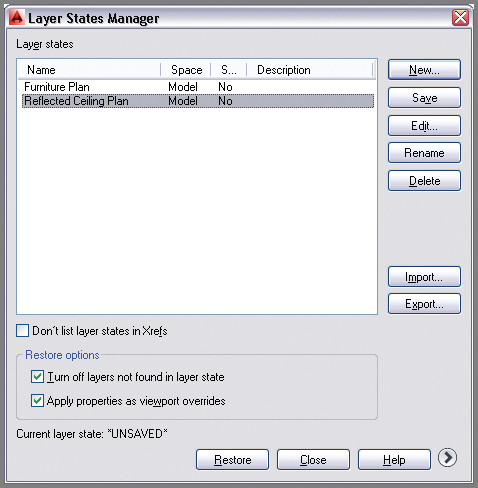
12. Type
LAYERSTATE, and press Enter. Select the Reflected Ceiling Plan layer state, and then click the Restore button (see
Figure 14-30).
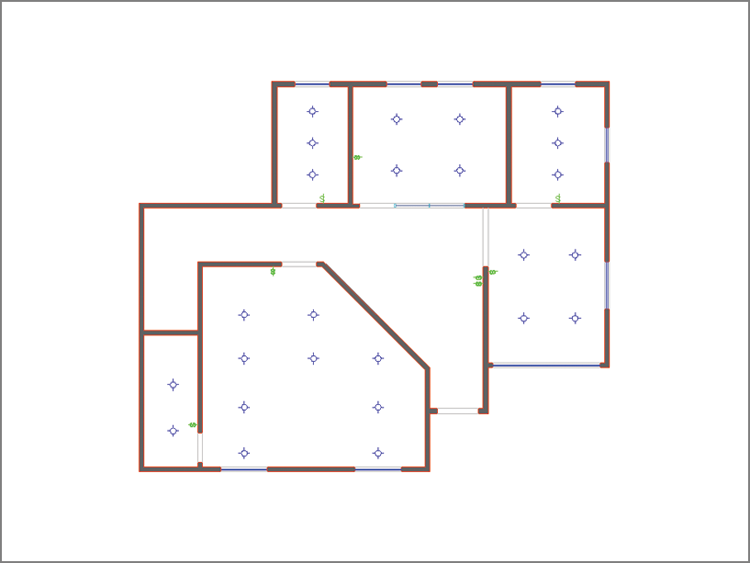
13. Double-click outside the viewport on the drawing canvas to return to paperspace. Open the Application menu, choose the Print category, and then click Plot. Click the Preview button to open a preview window (see
Figure 14-31).
14. Click the Plot icon in the upper-left corner of the preview window, and the plot is processed. Close the plot notification window.
You may remove the HP DesignJet 800 plotter from your system or use it to practice plotting.
Your drawing should now resemble Ch14-D.dwg, which is available among the book’s download files.
Exporting to an Electronic Format
If you’d like to reduce the amount of paper you use and eliminate reprographics and drawing shipment costs, Windows users can consider exporting their drawings to electronic formats such as DWF (Design Web Format) and/or PDF (Portable Document Format). Mac for AutoCAD users can’t export to DWF (they can, however, save as PDF in the Plot dialog box). You can email, FTP, or use an online service to transfer electronic files to your subcontractors and clients for collaboration or approval purposes. In the following steps, you will export a DWF file:
1. Open the Ch14-D.dwg file on the book’s web page.
2. Click the ribbon’s Output tab and, in the Export To DWF/PDF panel, click on the drop-down arrow under the Export icon. Select DWFx from the menu that appears.
DWFx files are written in XML (Extensible Markup Language) as opposed to Autodesk’s proprietary DWF format. DWFx files can be viewed in the Internet Explorer browser without installing a plug-in.
3. Click the Save button in the Save As DWFx dialog box.
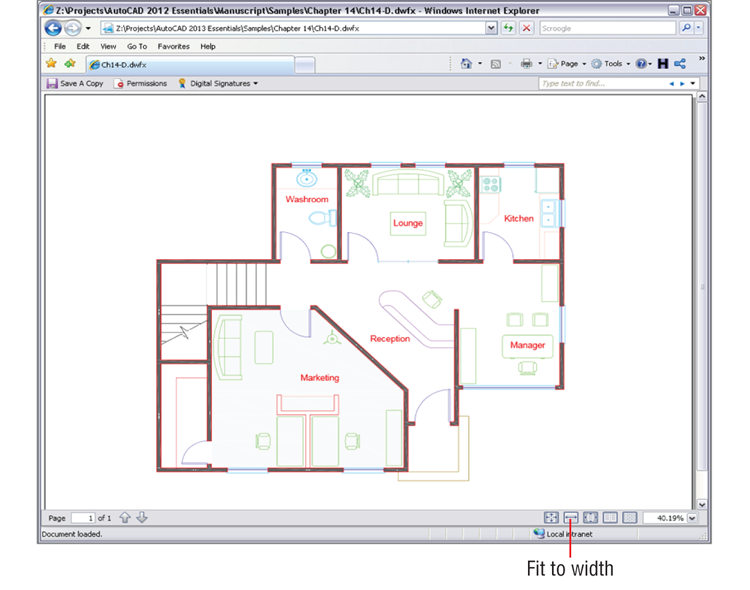
4. Right-click the
Ch14-D.dwfx file on your hard drive; select Open With, and select Microsoft Internet Explorer. After a few moments, the vector drawing appears in the browser. Click the Fit To Width button at the bottom of the interface (see
Figure 14-32).
Use Autodesk Design Review if you want to view and mark up DWF or DWFx files.
The Essentials and Beyond
In this chapter, you learned how to configure a typical output device by creating both a system printer and an AutoCAD plotter. You configured a plot style table and created a template that uses it. In addition, you plotted from both modelspace and layouts in paperspace, saved a page setup, and learned the entire plotting process. Finally, you learned how to keep everything in a digital format and export a DWFx file that can be shared over the Internet.
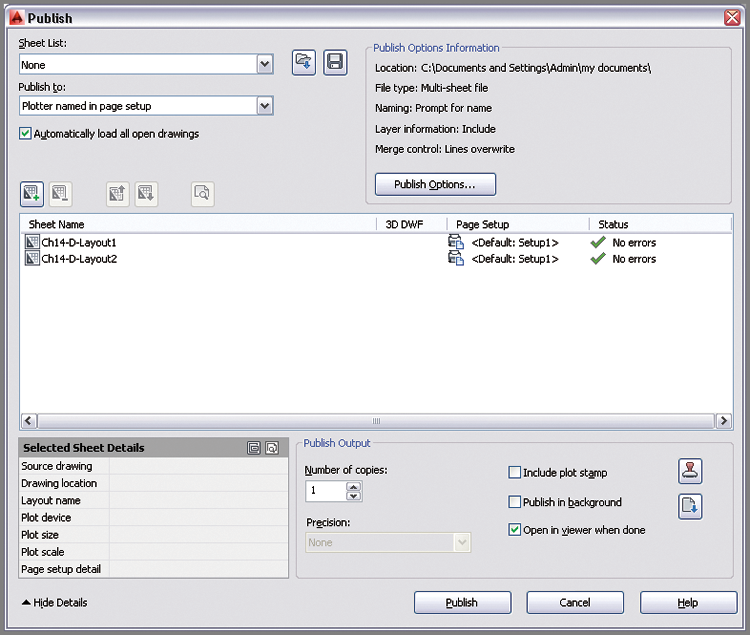
Additional Exercise
Explore the PUBLISH command on your own. Experiment with publishing multiple layouts from one drawing or any combination of modelspace views and layouts from multiple sheets all at once. The Publish feature is a great time-saver when you are ready to plot a stack of sheets. You can even try saving a sheet list for printing an identical set of the same drawings at another time.