Chapter 15
Working with Data
The AutoCAD® 2014 program has several features that allow you to manipulate data within your drawings. (Please note that AutoCAD® LT doesn’t support these features.) In this chapter, you’ll begin by geolocating project geometry. Then you will define attributes within a block definition in order to store nongraphical data. You’ll proceed to enter values in several block references, and then you’ll create a table to organize and display this data on a drawing layout. The data shown in the table will be a mixture of static text and dynamically linked fields that display textual information in modelspace. After creating this complex data-management system, you’ll change one of the attribute’s values and watch as the fields displaying data in the table automatically update.
- Geolocating projects
- Importing SketchUp models
- Defining attributes and blocks
- Inserting attributed blocks
- Editing table styles and creating tables
- Using fields in table cells
- Editing table data
Geolocating Projects
In AutoCAD 2014, you can store your project’s geographic location and site orientation with respect to true north within the drawing file. This information can be specified using road maps or aerial imagery all within AutoCAD, without having to use another program to access this information (such as Google Earth).
When geolocated blocks or images are inserted or attached to your drawing files, they are aligned using the geographic data as the common point of reference. When each team member uses geolocated drawings, drawing coordination will be automatically streamlined. In the following steps, you will geolocate a drawing using the AutoCAD built-in mapping service:
1. Go to the book’s web page at
www.sybex.com/go/autocad2014essentials, browse to Chapter 15, get the file
Ch15-A.dwg or
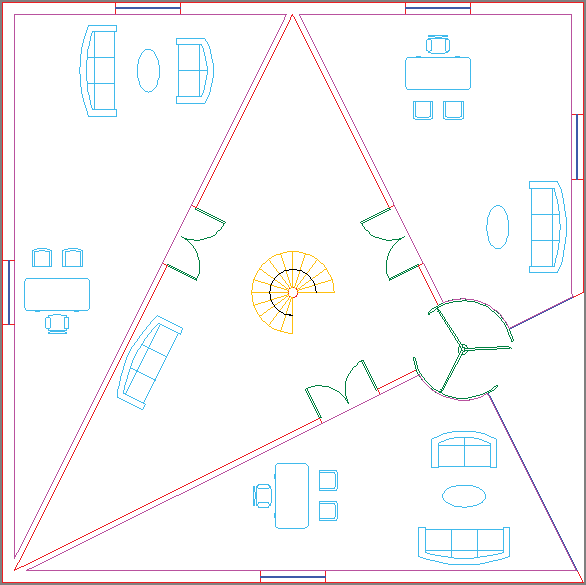
Ch15-A-metric.dwg, and open it. The drawing is an elaboration on the diagram you dimensioned in Chapter 11, “Dimensioning” (see
Figure 15-1).
You can access street maps instead of satellite imagery using the Road tab.
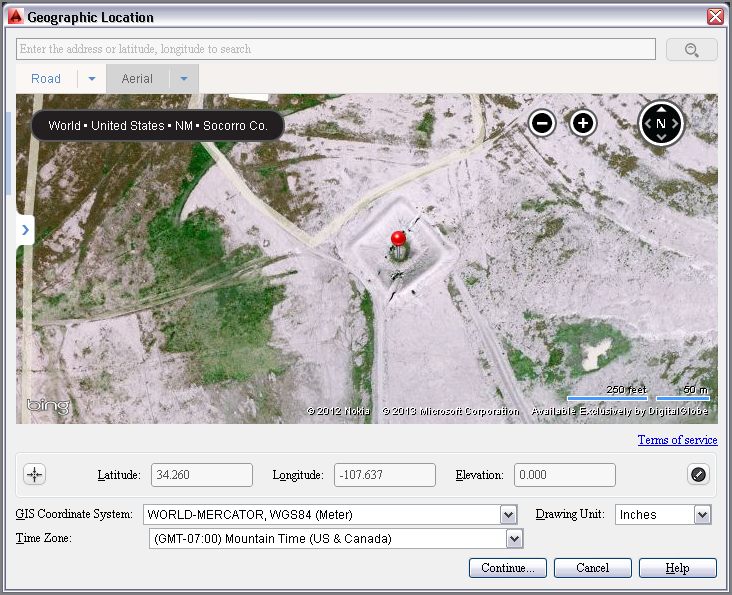
2. Select the ribbon’s Insert tab, open the Set Location flyout in the Location panel, and choose From Map. Use the navigation controls located in the upper right of the map in the Geographic Location dialog box to locate a hypothetical site for this structure. When you have zoomed in sufficiently to settle on a site location, right-click and choose Drop Pin Here from the context menu. A red pin icon appears on the map at the location where you right-clicked (see
Figure 15-2).
3. Click the Continue button at the bottom of the Geographic Location dialog box. You are prompted on the command line to select a point within the drawing for the location corresponding to the pin on the map. Click the center of the spiral staircase at the center of the floor plan.
4. The command line reads:
Specify the north direction or [Angle]<Angle>:
Press Enter to accept the default option of Angle, type
45, and press Enter to end the
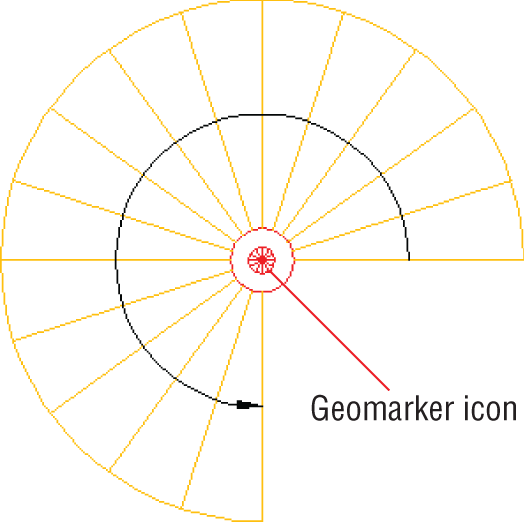
GEOGRAPHICLOCATION command. A red geomarker icon appears at the location you selected in step 3 (see
Figure 15-3).
5. After you have geolocated the drawing, a specialized Geolocation tab appears on the ribbon. To hide the map from the drawing window, go to the Map Tools panel on the Geolocation tab, open the Map Aerial flyout, and select Map Off.
6. To hide the geomarker icon from the drawing window, type GEOMARKERVISIBILITY, press Enter, type 0, and press Enter again.
7. Save your work as Ch15-B.dwg or Ch15-B-metric.dwg.
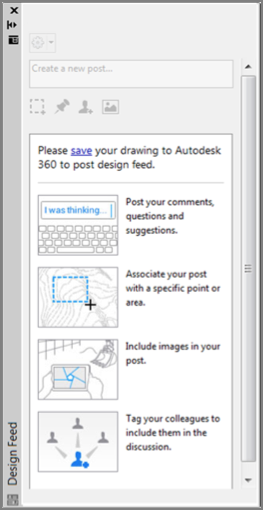
Using Design Feed
Design Feed is a new palette in AutoCAD 2014 that is accessible from the Autodesk® 360 Ribbon tab. Use Design Feed to share text messages and/or images with your colleagues. Posts are created and read using AutoCAD 2014 or the free AutoCAD® WS app for mobile devices. Whenever you tag a colleague in a post, it automatically appears in their Design Feed palette or AutoCAD WS app and they also are notified by email. All posts are stored in Autodesk 360 no matter where they are created so you can stay electronically connected to your colleagues in the office and in the field. You can also optionally geolocate your posts in drawings so that they refer to specific areas in the real world.
Importing SketchUp Models
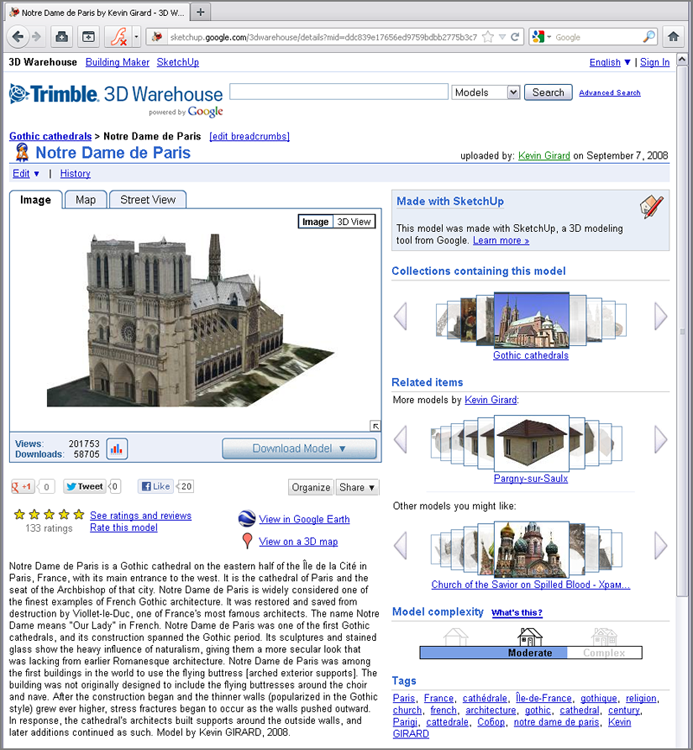
You can now import SketchUp models into AutoCAD from SKP files and import models from the Trimble 3D Warehouse using one of the free Autodesk Exchange Apps that ships with AutoCAD 2014. The ribbon’s Plug-ins tab has the Import SKP tool, which you will use to import a model from the 3D Warehouse in the following steps:
1. Open your web browser and go to
http://sketchup.google.com/3dwarehouse to access Trimble 3D Warehouse. Type
Notre Dame in the search bar and click the Search button. Select the Notre Dame de Paris model by Kevin Girard, which is the top result as of the date of this book’s publication (see
Figure 15-4). Click the Download Model button, select SketchUp 7 (.skp) from the menu that appears, and save it to your downloads folder.
2. In AutoCAD 2014, create a new blank document and select the 3D modeling workspace. Then select the Plug-ins tab and click the Import SKP tool. In the Select SKP File dialog box that appears, select the file you downloaded in the previous step and click the Open button.
3. Click any point in the drawing window to select an insertion point for the model.
4. Type Z for ZOOM and press Enter. Type E for the Extents option and press Enter.
Refer to Chapters 16–18 for more on 3D modeling.
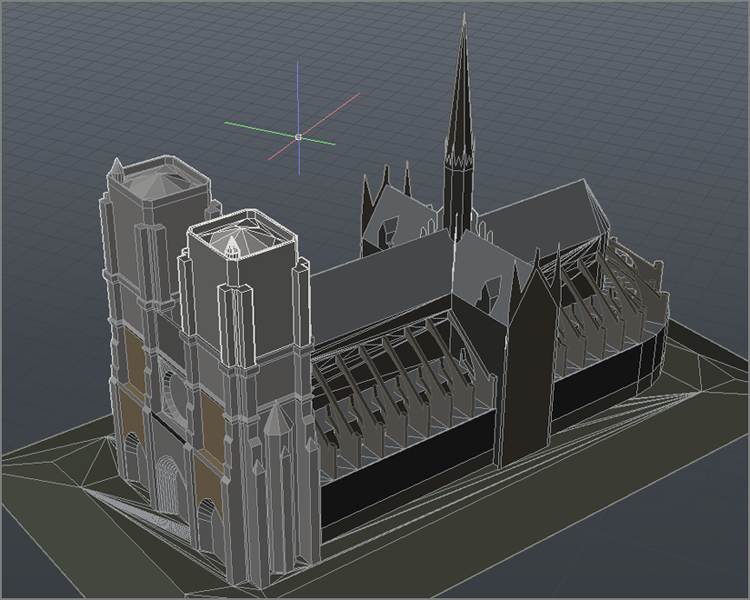
5. Hold down Shift and drag the mouse wheel or middle button to orbit the model so you can view the model in 3D. Zoom and/or pan the model to create a pleasing bird’s-eye view of the cathedral.
6. From two separate in-canvas menus located in the upper-left corner of the drawing window, select Perspective and Shaded With Edges to better visualize the geometry (see
Figure 15-5).
7. Close the drawing without saving. Select the Drafting & Annotation workspace.
Defining Attributes and Blocks
Blocks can be defined with attributes that contain any manner of textual information relevant to the object in question. Let’s explore this topic in an exercise. First you’ll alter the Annotative text style that will be used by the attributes you create. Then you’ll create attribute definitions to store employees’ names and ID numbers. Finally, you’ll define a simple block composed of two rectangles containing the attribute definitions.
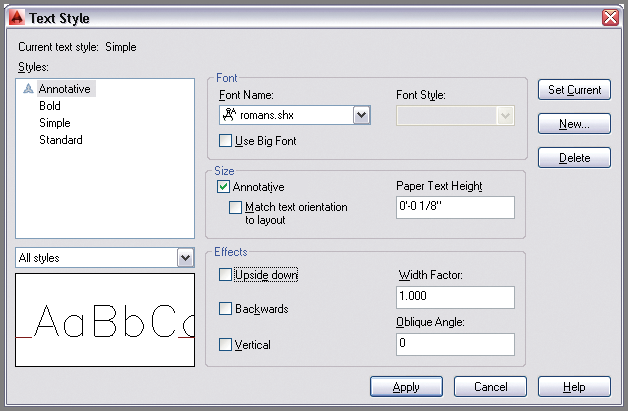
2. Type
ST (for Style), and press Enter. Select the Annotative style in the Styles list on the left side of the Text Style dialog box. Select
romans.shx in the Font Name drop-down menu. Type
1/8″ (or
0.30 cm) in the Paper Text Height box (see
Figure 15-6). Click Apply, select Set Current, and then click Close.
3. Click the Rectangle tool in the Draw panel of the ribbon’s Home tab. Click a point at some arbitrary distance from the building as the start point, type @3′,1′ (or @90,25 in metric), and press Enter.
4. Click the Copy tool in the Modify panel, select the rectangle you just drew, and press Enter. Press F3 to toggle on Endpoint object snap if it is not already on, click the upper-left corner of the rectangle, and then click its lower-left corner to create two vertically stacked rectangles. Press Enter to end the COPY command.
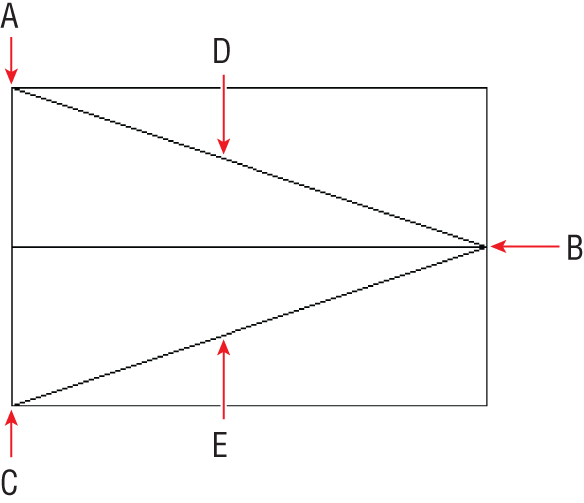
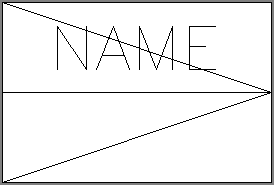
5. Click the Line tool in the Draw panel, and click points A, B, and C in
Figure 15-7. Press Enter to end the
LINE command.
6. Select 1⁄4″ = 1′-0″ scale (or 1:40 scale in metric) from the Annotation Scale menu on the status bar.
7. Right-click the Object Snap toggle on the status bar, and turn on Midpoint running object snap mode if it is not already on.
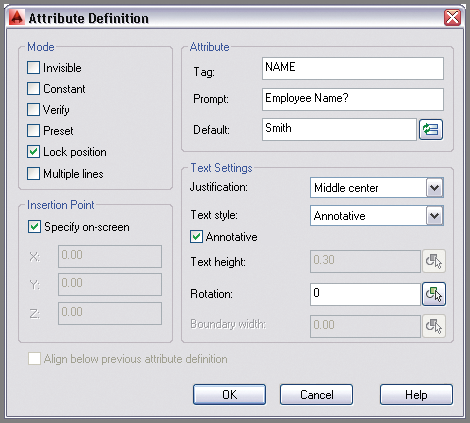
8. Expand the Block panel, and click the Define Attributes tool to open the Attribute Definition dialog box. Type
NAME as the tag,
Employee Name? as the prompt, and
Smith as the default. Set Justification to Middle Center and Text Style to Annotative (see
Figure 15-8).
Understanding the Parts of an Attribute
Tag, Prompt, and Value, along with a number of additional settings and optional modes, define every attribute. Tag is the programming name (typically capitalized without any spaces in the tag). Prompt is the question you’ll be asking the person who inserts the attributed block, prompting them to enter the attribute value. The value is entered only when the attributed block is inserted, and not when the attribute is defined (see the next section, “Inserting Attributed Blocks”). The optional Default setting displays a default value when the attributed block is eventually inserted into a drawing.
9. Click OK to close the Attribute Definition dialog box. Click the midpoint at point D in
Figure 15-7.
Figure 15-9 shows the result.
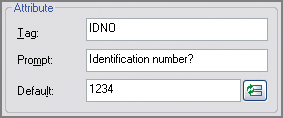
10. Press the spacebar to repeat the
ATTDEF command. Type
IDNO as the tag,
Identification number? as the prompt, and
1234 as the default (see
Figure 15-10). Set Justification to Middle Center and click OK. Click the midpoint of the lower diagonal line at point E in
Figure 15-7.
11. Click the Erase tool in the Modify panel, select the two diagonal lines, and press Enter.
12. Click the Create tool in the Block panel, and type Employee Data in the Name text box.
13. Click the Pick Insertion Base Point icon, and then click point C in
Figure 15-7.
The order in which you select attribute definitions when defining them as a block determines the order in which their prompts will appear in block references.
14. Click the Select Objects icon, click the NAME attribute definition, and then click IDNO. Select both rectangles, and press Enter. Click the Delete radio button in the Objects area of the Block Definition dialog box, and select Inches (or Centimeters) in the Block Unit drop-down menu (see
Figure 15-11). Click OK and the attribute definitions and geometry disappear as expected.
15. Save your work as Ch15-C.dwg or Ch15-C-metric.dwg.
Inserting Attributed Blocks
After you have (or your CAD manager has) gone to the trouble of defining blocks with attributes, inserting them and entering values is easy. In the following steps, you’ll insert three Employee Name blocks and enter appropriate values in each block reference:
1. If the file is not already open, go to the book’s web page, browse to Chapter 15, get the file Ch15-C.dwg or Ch15-C-metric.dwg, and open it.
2. Set the Symbol layer as current in the Layer drop-down menu in the Layers panel.
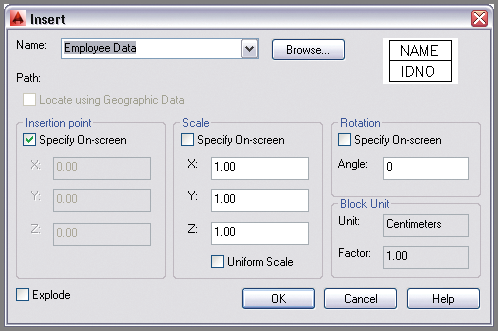
3. Click the Insert tool in the Block panel. Open the Name drop-down menu, and select Employee Data. Verify that Specify On-Screen is selected in the Insertion Point area (see
Figure 15-12).
4. Click OK in the Insert dialog box, and then click a point in the center of the room on the right. The command prompt reads:
Employee name? <Smith>:
Type
Bruno, and press Enter. The prompt now reads:
Identification number? <1234>:
Type
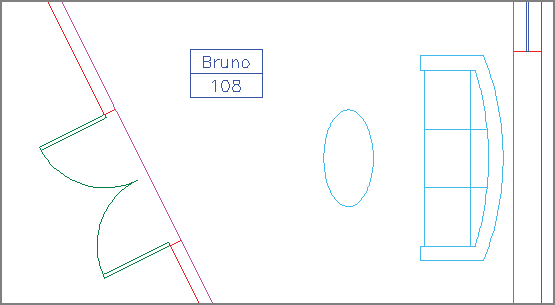
108, and press Enter. The block reference appears in the room with the values you typed in (see
Figure 15-13).
5. Type ATTDIA, and press Enter. Type 1, and press Enter.
ATTDIA is a system variable that controls whether attribute values are input at the command prompt or entered in a dialog box.
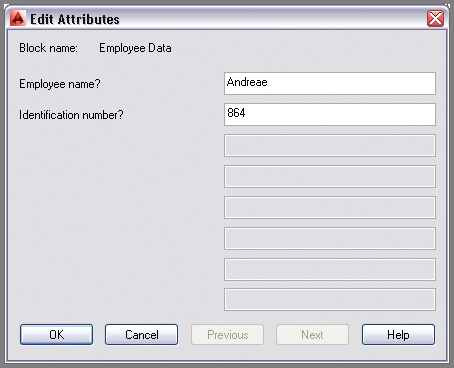
6. Type
I (for Insert), and press Enter twice. Click a point in the center of the room on the left. Type
Andreae as the employee name, press Tab, and type
864 as the identification number in the Edit Attributes dialog box (see
Figure 15-14). Click OK.
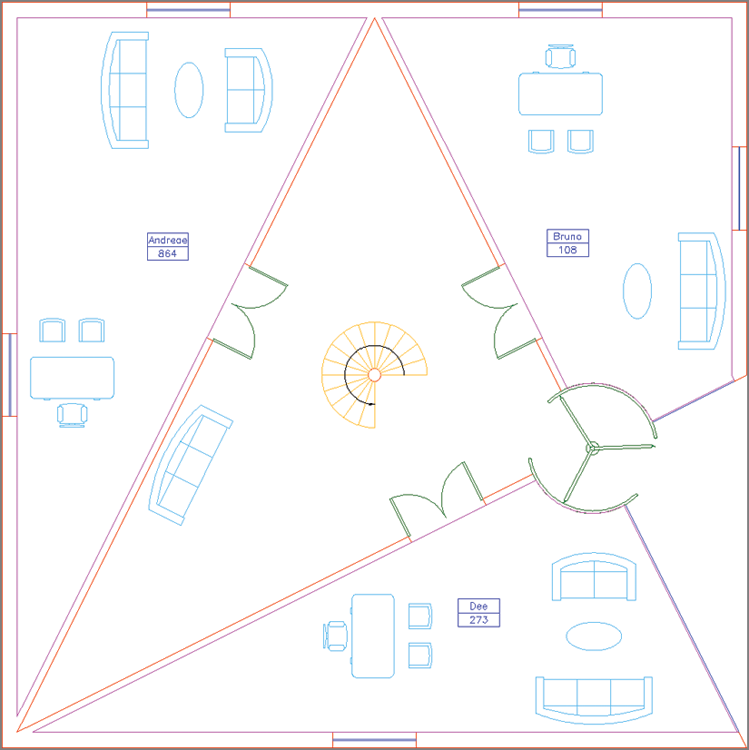
7. Press the spacebar to repeat the
INSERT command and press Enter. Click a point in the center of the room on the bottom. Type
Dee as the employee name, press Tab, and type
273 as the identification number in the Edit Attributes dialog box. Click OK.
Figure 15-15 shows the result.
8. Save your work as Ch15-D.dwg or Ch15-D-metric.dwg.
Editing Table Styles and Creating Tables
Tables are like having Microsoft Excel or another spreadsheet program within AutoCAD. The overall appearance of tables is controlled by table styles. Cell spacing, borders, and background coloring is controlled by individual table cells. In the following steps, you’ll adjust a table style, create a new table, and begin adding content to its cells:
1. If the file is not already open, go to the book’s web page, browse to Chapter 15, get the file Ch15-D.dwg or Ch15-D-metric.dwg, and open it.
2. Expand the Annotation panel on the Home ribbon tab, and click the Table Style icon. Click the Modify button in the Table Style dialog box that appears.
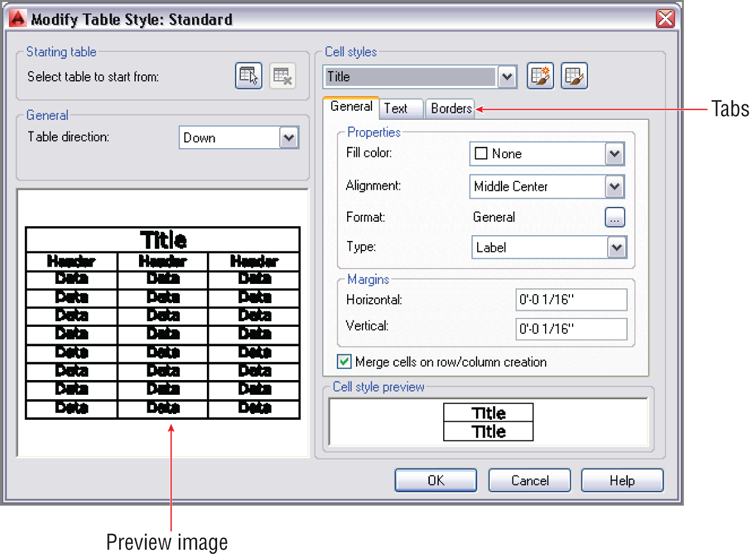
3. In the Modify Table Style: Standard dialog box that appears, open the Cell Styles drop-down menu and select Title. Select the General tab if it is not already selected. Double-click in the Horizontal text box in the Margins area. Type
1/16″ (or
0.20 cm), press Tab, and type
1/16″ (or
0.20 cm) to specify an equal vertical margin (see
Figure 15-16).
Table cell styles have three types: Title, Header, and Data.
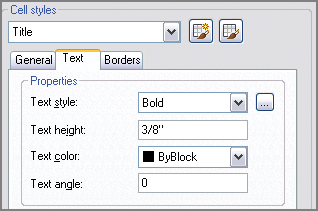
4. Select the Text tab within the Modify Table Style: Standard dialog box. Open the Text Style drop-down menu, and select Bold. Double-click the Text Height text box, and type
3/8″ (or
0.80 cm) (see
Figure 15-17).
5. Open the Cell Styles drop-down menu and select Header. Open the Text Style drop-down menu and select Bold. Double-click the Text Height text box, type 1/4″ (or 0.50 cm), press Tab, and observe the preview image update.
6. Open the Cell Styles drop-down menu and select Data. Open the Text Style drop-down menu and select Simple. Double-click the Text Height text box, and type 1/4″ (or 0.50 cm). Press Tab to update. The updates to the table style are complete. Click OK, and then click Close to end the TABLESTYLE command.
7. Click the Quick View Layouts tool on the status bar. Select Layout1, and press Esc to exit Quick View Layouts mode.
8. Open the Layer drop-down menu in the Layers panel, and set the Table layer as current.
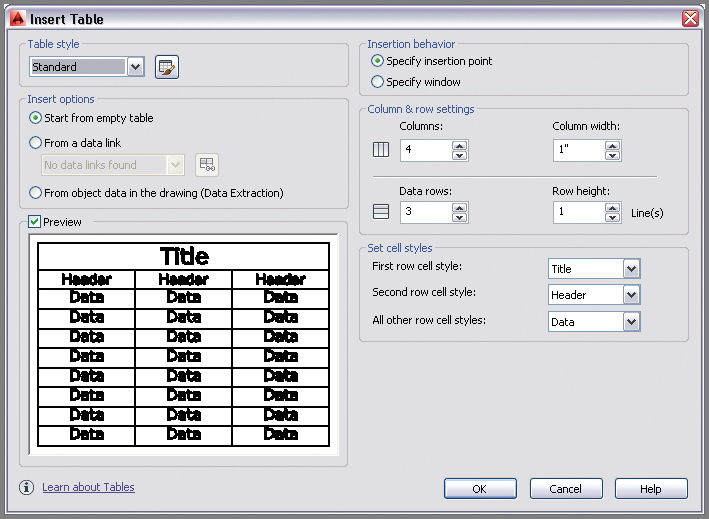
9. Click the Table tool in the Annotation panel. Set the number of Columns to 4 and Data Rows to 3 in the Insert Table dialog box. Set Column Width to 1″ (or 2.5 cm) (see
Figure 15-18). The Title, Header, and Data cell styles you customized within the Standard table style will be used by default. Click OK.
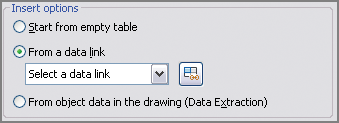
Linking to Tables in External Spreadsheets
Select the From A Data Link radio button in the Insert Table dialog box, and click the Launch The Data Link Manager icon to link dynamically to a spreadsheet in Microsoft Excel.
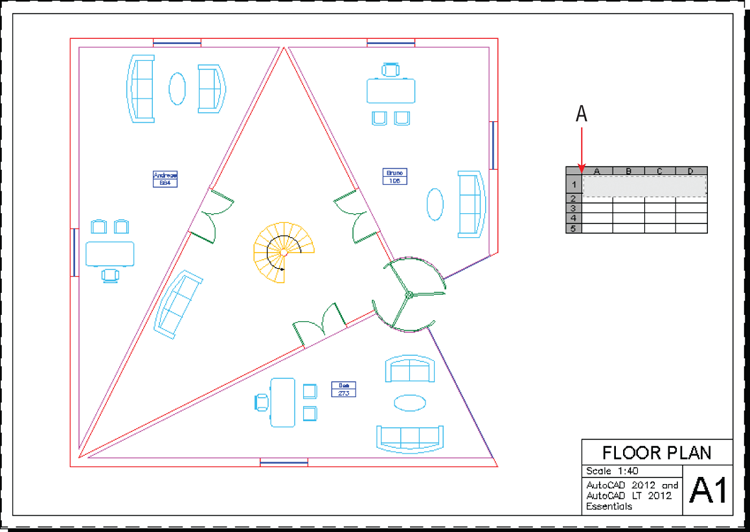
10. Click approximately at point A in
Figure 15-19 to place the empty table on the layout.
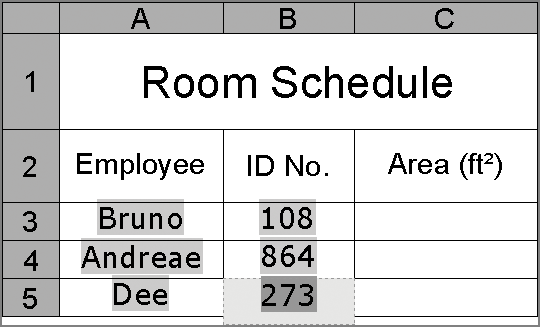
11. The cursor is highlighted within the table’s top cell. Zoom into the table by turning the mouse wheel. Type Room Schedule, and press the Tab key. Type Employee, press Tab, and type ID No. Press Tab again. The Tab key advances to the next cell from left to right, and then from top to bottom at the end of each row.
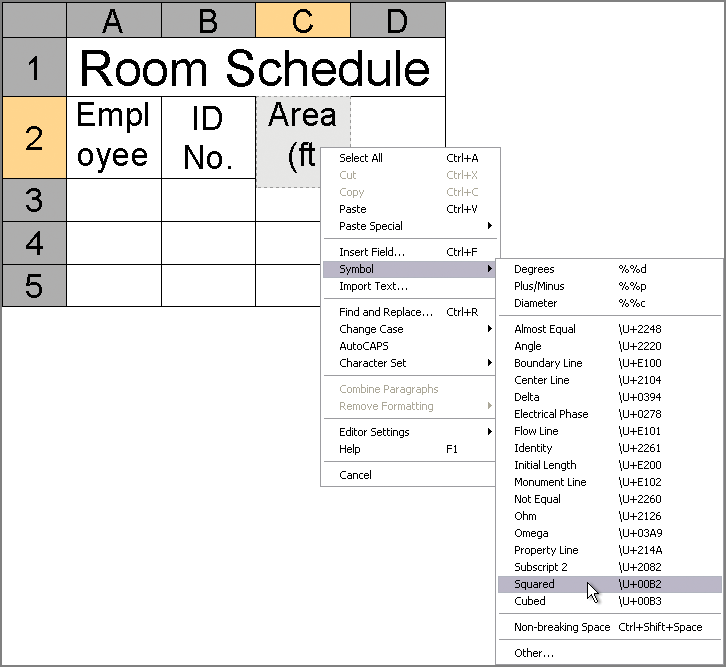
12. Type Area (ft in Imperial units) or Area (m in metric units).
13. Right-click to open the context menu. Select Symbol ⇒ Squared as shown in
Figure 15-20. Type
) and press Tab. Now the column header indicates an area in square feet (or square meters). Click outside the table on the layout to deactivate it.
You can insert or delete any number of rows and columns using tools on the Table Cell tab’s Rows and Columns panels.
14. Click in the table to highlight it, and then select cell D2 to highlight it for editing. Click the Delete Column tool in the Columns panel within the ribbon’s contextual Table Cell tab.
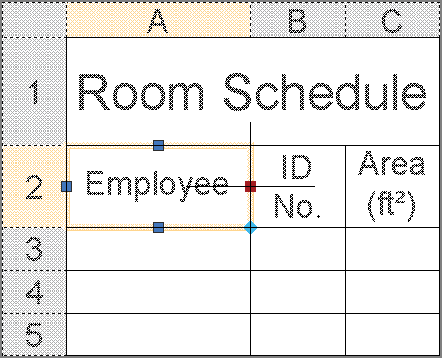
15. Use the arrow keys to move between cells in the table. Press the left arrow key twice to move to cell A2. Each cell has four grips. Click cell A2’s right grip, and move it to the right to stretch column A wider. Click a point a short distance to the right to set the column width approximately as shown in
Figure 15-21.
16. Press the right arrow key twice to move to cell B2. Click B2’s right grip, and stretch it to the right so that its entire header fits on one line. Repeat for cell C2. Press Esc to deselect.
Figure 15-22 shows the result.
17. Save your work as Ch15-E.dwg or Ch15-E-metric.dwg.
Using Fields in Table Cells
Fields are variables that are inserted into blocks of text that can change what they display over time. For example, you can insert a date field onto a title block that will update to show the current date every time the drawing is plotted. You can also link fields to objects in the drawing so that the field will display any one of the object properties. In the following steps, you’ll insert fields into cells within the table you designed in the previous section:
1. If the file is not already open, go to the book’s web page, browse to Chapter 15, get the file Ch15-E.dwg or Ch15-E-metric.dwg, and open it.
2. Select cell A3, which is the first data cell in the Employee column. Double-click within this cell to activate the Text Editor contextual tab on the ribbon. Click the Field tool on the Insert panel.
When selecting objects in the Field dialog box, you can select objects in floating viewports even when you are in paperspace.
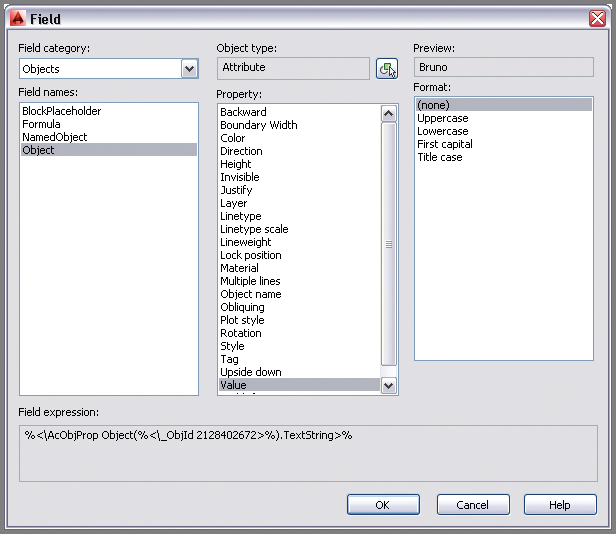
3. In the Field dialog box that appears, open the Field Category drop-down menu and select Objects. Select Object in the Field Names list. Click the Select Objects button, and select the attribute Bruno in the room on the right.
4. Select Value in the Property list that appeared after selecting the attribute in the previous step (see
Figure 15-23). Click OK. The word Bruno appears in table cell A3.
Fields are displayed against a gray background to identify them as fields on screen. The gray field background does not appear in plotted output.
5. Press the down arrow, and move to cell A4. Right-click and choose Insert Field from the context menu. Click the Select Objects button, and select the attribute Andreae in the room on the left. Choose Value from the Property list and click OK.
6. Repeat the previous step, selecting the attribute Dee in the room at the bottom.
7. Continue adding fields in the ID No column, selecting each attribute value as shown in
Figure 15-24.
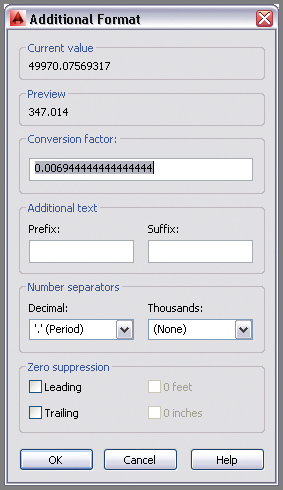
8. Double-click in cell C3 to activate the Text Editor. Press Ctrl+F to open the Field dialog box. Click the Select Objects button, and select the magenta line in the doorway of Bruno’s office. Choose Area from the Property list. The preview shows the area value as 347.014 SQ. FT. or 322388.23 (in units of square centimeters).
9. Click the Additional Format button. Then do the following:
- In Imperial units, remove the SQ. FT. text from the Suffix text box and type 1/144 in the Conversion Factor text box to convert from square inches to square feet. (This is converted to its decimal equivalent.) Click OK twice.
- In metric, type 1/10000 in the Conversion Factor text box in order to convert square centimeters to square meters manually (see Figure 15-25). Click OK twice.
AutoCAD automatically inserts a factor that converts from square inches to square feet in the Additional Format dialog box.
10. Press the down arrow to move to cell C4. Repeat the previous two steps, selecting the magenta line in Andreae’s office and displaying its area value in square feet (or square meters).
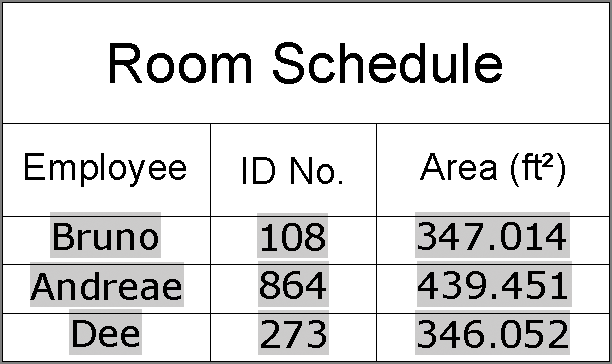
11. Press the down arrow to move to cell C5. Repeat steps 8 and 9, selecting the magenta line in Dee’s office and displaying its area value in square feet (or square meters). Click outside the table on the layout to deselect the table.
Figure 15-26 shows the result.
12. Save your work as Ch15-F.dwg or Ch15-F-metric.dwg.
Editing Table Data
Beyond filling in a table with all the relevant information, you can also format it to display the data in an aesthetically pleasing fashion. You can change justification, alter border color and/or lineweight, and even change the background color of chosen cells to highlight them. In the following steps, you’ll format cells, add an additional row and a formula, and finally change an attribute and regenerate the drawing to see the table update:
1. If the file is not already open, go to the book’s web page, browse to Chapter 15, get the file Ch15-F.dwg or Ch15-F-metric.dwg, and open it.
2. Click the word Dee (cell A5 in the table) to activate the ribbon’s Table Cell contextual tab. Click the Insert Below button in the Row panel.
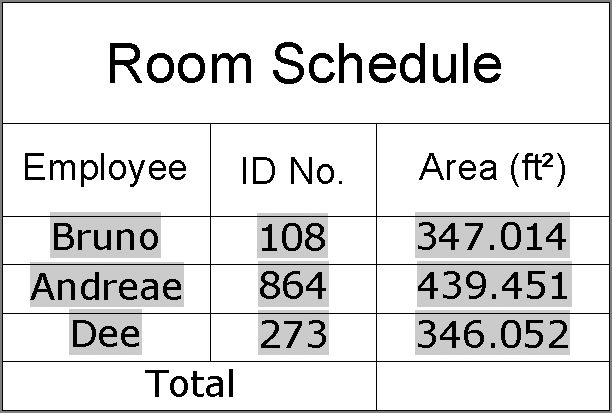
3. Press the down arrow, and move to cell A6. Hold down Shift, and click cell B6. Open the Merge Cells menu in the Merge panel, and select Merge By Row. Cells A6 and B6 are merged. Type
Total, and click outside the table on the layout to deactivate Text Editing mode (see
Figure 15-27).
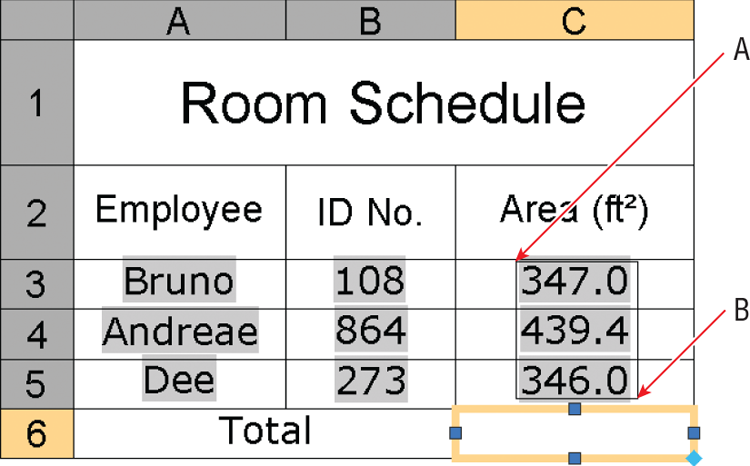
4. Click the cell to the right of the word Total to activate cell C6. Click the Formula button in the Insert panel and select Sum. Click points A and B, as shown in
Figure 15-28. Press Enter to accept the formula
=Sum(C3:C5).
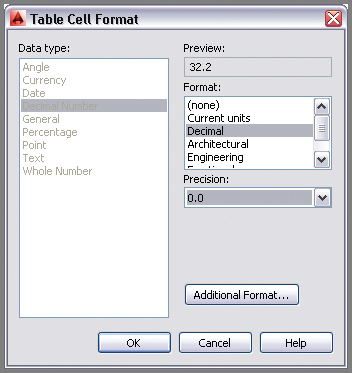
5. Select the number 163082.582 (or 1052147.80 in metric) that appears in cell C6 (total area in square inches or square centimeters). Hold down Shift, and select cell C3. Open the Data Format menu on the Cell Format panel, and select Custom Table Cell Format from the context menu.
6. Click the Additional Format button in the Table Cell Format dialog box that appears. Type 0.006944 (or 1/10000 in metric) in the Conversion Factor text box, and click OK to close the Additional Format dialog box.
Formatting applied to a range of cells affects all selected cells.
7. Select Decimal in the Format list in the Table Cell Format dialog box. Open the Precision drop-down menu, and select 0.0 (see
Figure 15-29). Click OK.
8. Open the text justification menu (currently set at Top Center) in the Cell Styles panel, and select Top Right. Cells C3 through C6 are right-justified.
9. Select cell B3, hold down Shift, and select cell B5. Change the justification to Top Right in the Cell Styles panel. Select cell A3, hold down Shift, and select cell A5. Change its justification to Top Left. Select merged cell AB6. Change its justification to Top Right. Click outside the table to deselect.
Figure 15-30 shows the result.
10. Type TABLESTYLE, press Enter, and click the Modify button in the Table Style dialog box. In the Modify Table Style: Standard dialog box that appears, select Data from the Cell Styles drop-down menu if it is not already selected. Select the General tab if it is not already selected, double-click the Horizontal text box in the Margins area, type 1/8″ (or 0.15 cm), and press Tab. Type 1/8″ (or 0.15 cm), and click OK and then Close. There is a bit more space around the data cells.
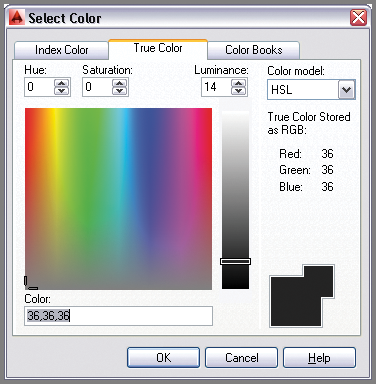
11. Click the words Room Schedule to select merged cell ABC1. Open the Table Cell Background Color menu in the Cell Styles panel, and choose Select Colors. Select the True Color tab in the Select Color dialog box that appears. Type
36,36,36 in the Color text box and press Tab (see
Figure 15-31). Click OK.
12. Double-click in cell ABC1 to activate the Text Editor contextual tab on the ribbon. Drag a selection encompassing the entire phrase Room Schedule. Open the Text Editor Color Gallery in the Formatting panel, and choose Select Colors. Select the True Color tab in the Select Color dialog box that appears. Type 255,255,255 in the Color text box, press Tab, and click OK. White text now appears on a black background. Click outside the table to exit Text Editor mode.
13. Toggle on Show/Hide Lineweight on the status bar if it is not already on.
14. Select cell ABC1, hold Shift, and select cell C6 to activate all the table’s cells. Click the Edit Borders icon in the Cell Styles panel. Open the Lineweight drop-down menu, and select 0.70 mm. Click the Outside Borders button to apply the properties and click OK (see
Figure 15-32). A thicker line appears around the outside borders of the table.
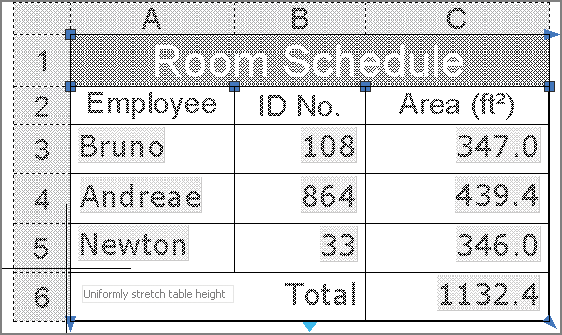
15. Click the border of the table to select the table itself. Click the Uniformly Stretch Table Height grip in the lower-left corner, and move it upward until the table reaches its maximum compactness (see
Figure 15-33). Press Esc to deselect the table.
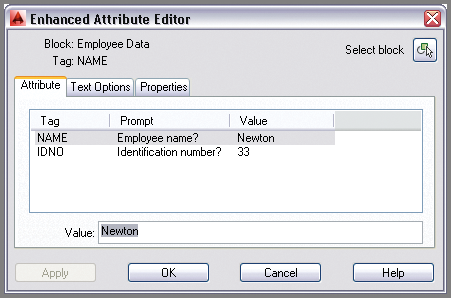
16. Now you’ll change an attribute value and observe that this change appears automatically in the table through the fields linked to the attribute values. Click the Maximize Viewport icon in the status bar. Double-click the Employee Data block in Dee’s office to open the Enhanced Attribute Editor. Type
Newton, press Enter, type
33, and press Enter again (see
Figure 15-34). Click OK to end the
EATTEDIT command.
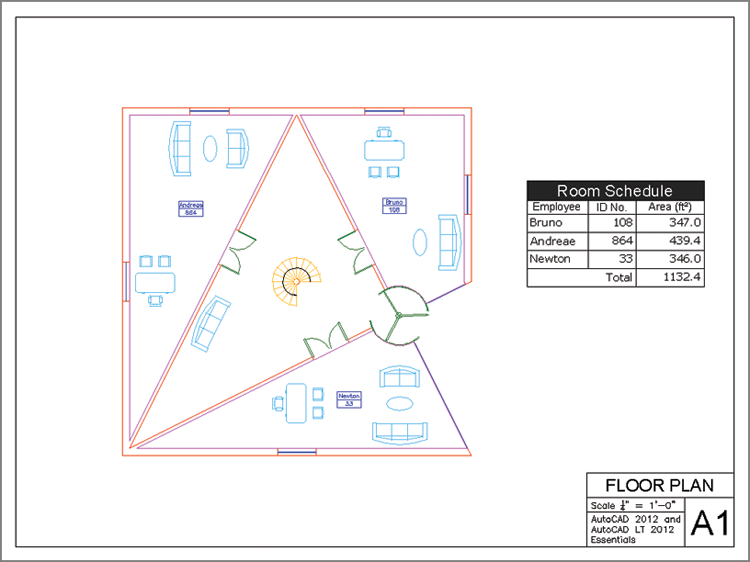
17. Click Minimize Viewport in the status bar. The table in Layout1 has automatically been updated, and it lists Newton and his newly entered identification number.
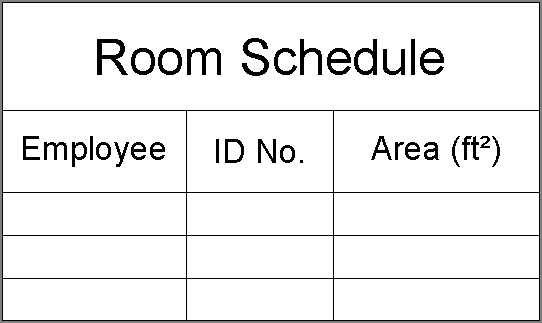
18. Select the Output tab, and click the Preview icon on the Plot panel. The gray background in the fields disappears and you see the table exactly as it would plot (see
Figure 15-35). Press Esc to exit preview mode.
19. Your drawing should now resemble Ch15-G.dwg or Ch15-G-metric.dwg, which are available for download at the book’s web page.
The Essentials and Beyond
In this chapter, you learned how to define attributes and embed them in block definitions. You also inserted attributed blocks and adjusted their values in a drawing. In addition, you created a table and adjusted its style to control the table’s appearance, and you wrote text and inserted fields within the table to link to nongraphical information associated with attribute values and object data. In short, you now have the skills to manipulate data within AutoCAD 2014 drawings.
Additional Exercise
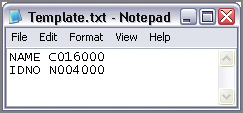
Use the ATTEXT command to extract attribute values from Ch15-F.dwg for analysis in an external spreadsheet program such as Microsoft Excel. To extract attribute values, you must first create a template text file containing attribute tags and formatting codes. The Template.txt file that has been supplied on this book’s web page (found in the Chapter 15 folder) is designed for this purpose. The letter C in the template indicates character format for words, and N indicates numerical data. The numbers 016000 and 004000 control how many characters/digits are in the output (16 and 4, respectively).
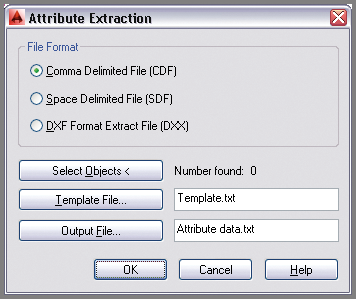
Type ATTEXT, and specify the location of both the template and output files. Click OK to create the CDF file. This standard file format can be imported into a spreadsheet program for analysis (or linking back into AutoCAD). In this simple example, there are only six values; however, in real-world projects, programmatically extracting hundreds of attributes’ values can be quite a time-saver.