Chapter 35
Development Tools
The Android SDK is more than a library of Java classes and API calls. It also includes a number of tools to assist in application development.
Much of the focus has been on the Eclipse plug-in, to integrate Android development with that IDE. Secondary emphasis has been placed on the plug-in's equivalents for use in other IDEs or without an IDE, such as adb for communicating with a running emulator.
This chapter will cover other tools beyond those two groups.
Hierarchical Management
Android comes with a Hierarchy Viewer tool, designed to help you visualize your layouts as they are seen in a running activity in a running emulator. So, for example, you can determine how much space a certain widget is taking up, or try to find where a widget that does not appear on the screen is hiding.
To use Hierarchy Viewer, you first need to fire up your emulator, install your application, launch your activity, and navigate to spot you wish to examine. Note that you cannot use Hierarchy Viewer with a production Android device (e.g., T-Mobile G1). For illustration purposes, we'll use the ReadWrite demo application introduced back in Chapter 23, as shown in Figure 35–1.
You can launch Hierarchy Viewer via the hierarchyviewer program, found in the tools/directory in your Android SDK installation. This brings up the main Hierarchy Viewer window, as shown in Figure 35–2.
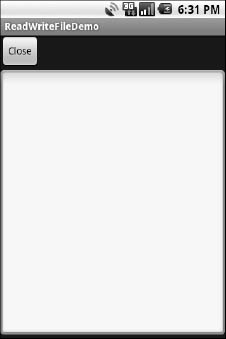
Figure 35–1. ReadWrite demo application
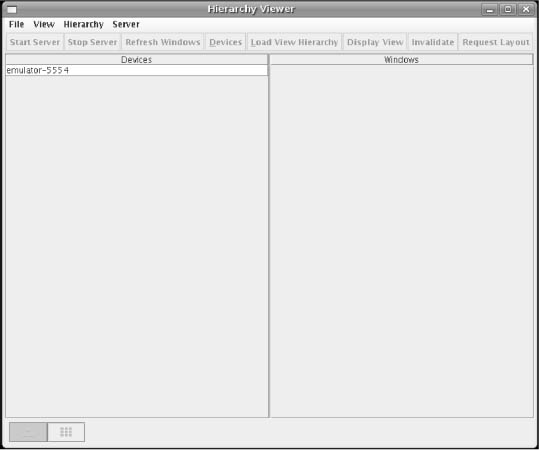
Figure 35–2. Hierarchy Viewer main window
The list on the left shows the various emulators you have opened. The number after the hyphen should line up with the number in parentheses in your emulator's title bar.
When you click an emulator, the list of windows available for examination appears on the right, as shown in Figure 35–3.
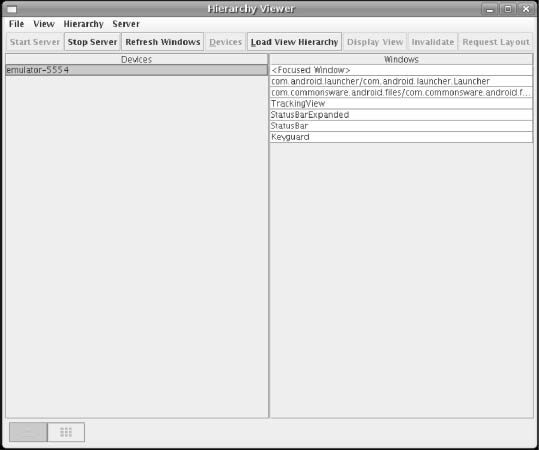
Figure 35–3. Hierarchy Viewer list of available windows
Notice how there are many other windows besides our open activity, including the Launcher window (i.e., the home screen), the Keyguard window (i.e., the “Press Menu to Unlock” black screen you get when first opening the emulator), and so on. Your activity will be identified by application package and class (e.g., com.commonsware.android.files/...).
Things get interesting when you choose a window and click Load View Hierarchy. After a few seconds, the details spring into view, in a perspective called the Layout view, as shown in Figure 35–4.
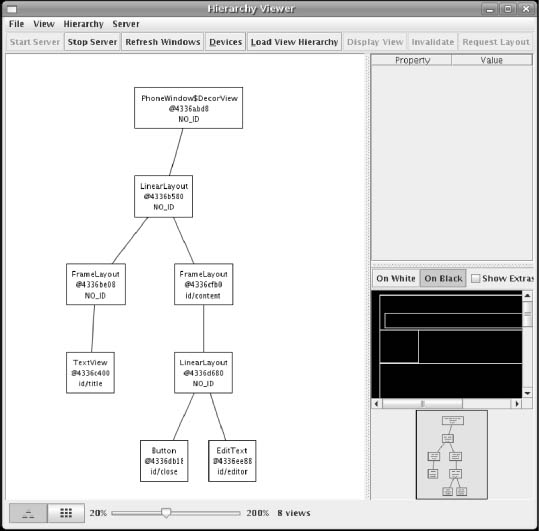
Figure 35–4. Hierarchy Viewer Layout view
The main area of the Layout view shows a tree of the various views that make up your activity, starting from the overall system window and driving down into the individual UI widgets. You will see, on the lower-right branch of the tree, the LinearLayout, Button, and EditText shown in the preceding code listing. All of the remaining views, including the title bar, are supplied by the system.
Clicking one of the views adds more information to this perspective, as shown in Figure 35–5.
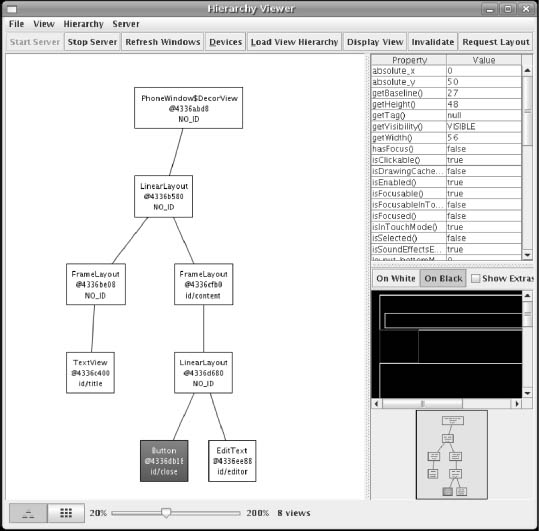
Figure 35–5. Hierarchy Viewer view properties
Now, in the upper-right region of the viewer, you see properties of the selected widget—in this case, the Button. Alas, these properties do not appear to be editable.
Also, the widget is highlighted in red in the wireframe of the activity, shown beneath the properties (by default, views are shown as white outlines on a black background). This can help you ensure you have selected the correct widget, if, say, you have several buttons and cannot readily tell from the tree what is what.
If you double-click a view in the tree, you will see a pop-up pane showing just that view (and its children), isolated from the rest of your activity.
Down in the lower-left corner, you will see two toggle buttons, with the tree button initially selected. Clicking the grid button puts the viewer in a whole new perspective, called the Pixel Perfect view, as shown in Figure 35–6.
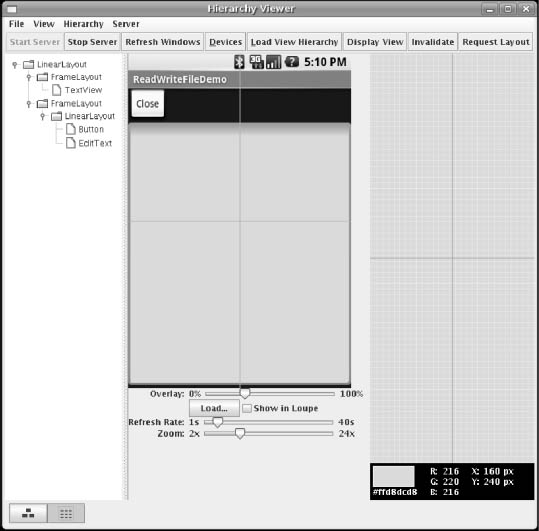
Figure 35–6. Hierarchy Viewer Pixel Perfect view
On the left, you see a tree representing the widgets and other views in your activity. In the middle, you see your activity (the Normal view), and on the right, you see a zoomed edition of your activity (the Loupe view).
What may not be initially obvious is that this imagery is live. Your activity is polled every so often, controlled by the Refresh Rate slider. Anything you do in the activity will then be reflected in the Pixel Perfect view's Normal and Loupe views.
The hairlines (cyan) overlaying the activity show the position being zoomed. Just click a new area to change where the Loupe view is inspecting. And, of course, there is another slider to adjust how much the Loupe view is zoomed.
Delightful Dalvik Debugging Detailed, Demoed
Another tool in the Android developer's arsenal is the Dalvik Debug Monitor Service (DDMS). This is like a Swiss army knife, allowing you to do everything from browse log files, update the GPS location provided by emulator, simulate incoming calls and messages, and browse the on-emulator storage to push and pull files.
DDMS has a wide range of uses. Here, I will introduce some of the most useful features.
To launch DDMS, run the ddms program inside the tools/directory in your Android SDK distribution. It will initially display just a tree of emulators and running programs on the left, as shown in Figure 35–7.
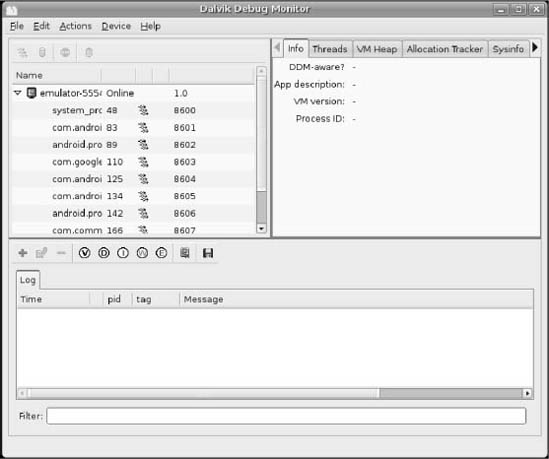
Figure 35–7. DDMS initial view
Clicking an emulator allows you to browse the event log on the bottom and manipulate the emulator via the tabs on the right, as shown in Figure 35–8.
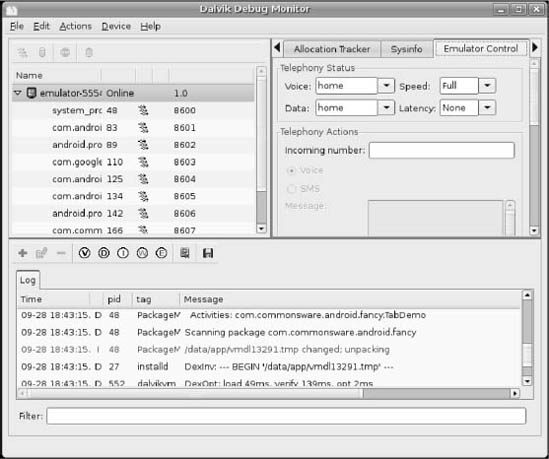
Figure 35–8. DDMS, with emulator selected
Logging
Rather than use adb logcat, DDMS lets you view your logging information in a scrollable table. Just highlight the emulator or device you want to monitor, and the bottom half of the screen shows the logs.
In addition, you can do the following:
- Filter the Log tab by any of the five logging levels, shown as the V through E toolbar buttons.
- Create a custom filter, so you can view only those entries tagged with your application's tag, by pressing the + toolbar button and completing the form (see Figure 35–9). The name you enter in the form will be used as the name of another logging output tab in the bottom portion of the DDMS main window.
- Save the log information to a text file for later perusal, or for searching.
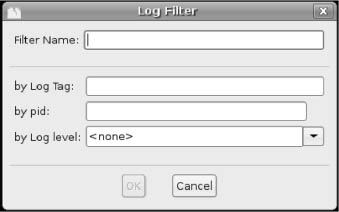
Figure 35–9. DDMS logging filter
File Push and Pull
While you can use adb pull and adb push to get files to and from an emulator or device, DDMS lets you do that visually. Just highlight the emulator or device you wish to work with, and then choose Device ![]() File Explorer from the main menu. That will bring up your typical directory browser, as shown in Figure 35–10.
File Explorer from the main menu. That will bring up your typical directory browser, as shown in Figure 35–10.
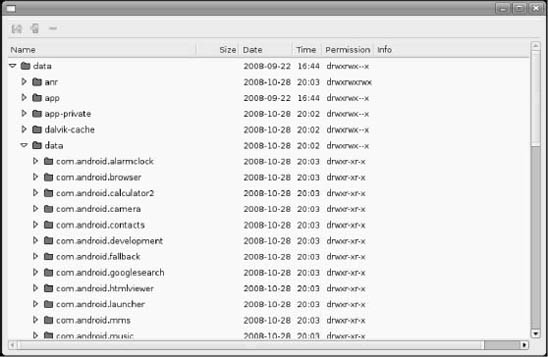
Figure 35–10. DDMS File Explorer
Just browse to the file you want and click either the pull (leftmost) or push (middle) toolbar button to transfer the file to or from your development machine. To delete a file, click the delete (rightmost) toolbar button.
There are a few caveats to using File Explorer:
- You cannot create directories through this tool. You will either need to use adb shell or create them from within your application.
- While you can putter through most of the files on an emulator, you can access very little outside
/sdcardon an actual device, due to Android security restrictions.
Screenshots
To take a screenshot of the Android emulator or device, simply press Ctrl+S or choose Device ![]() Screen Capture from the main menu. This will bring up a dialog box containing an image of the current screen, as shown in Figure 35–11.
Screen Capture from the main menu. This will bring up a dialog box containing an image of the current screen, as shown in Figure 35–11.
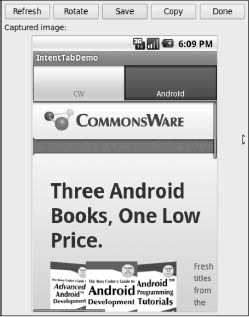
Figure 35–11. DDMS screen capture
From here, you can do the following:
- Click Save to save the image as a PNG file somewhere on your development machine.
- Click Refresh to update the image based on the current state of the emulator or device.
- Click Done to close the dialog box.
Location Updates
To use DDMS to supply location updates to your application, the first thing you must do is have your application use the gps LocationProvider, as that is the one that DDMS is set to update.
Next, click the Emulator Control tab and scroll down to the Location Controls section. Here, you will find a smaller tabbed pane with three options for specifying locations: Manual, GPX, and KML, as shown in Figure 35–12.
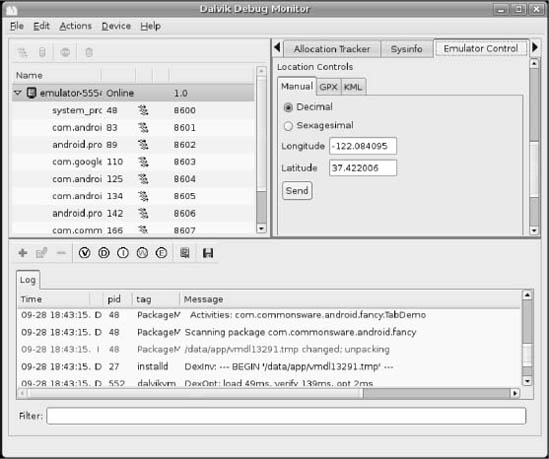
Figure 35–12. DDMS location controls
To use the Manual tab, provide a latitude and longitude and click the Send button to submit that location to the emulator. The emulator will notify any location listeners of the new position.
The other tabs allow you to specify locations using GPS Exchange (GPX) format or Keyhole Markup Language (KML) format.
Placing Calls and Messages
If you want to simulate incoming calls or SMS messages to the Android emulator, DDMS can handle that as well.
On the Emulator Control tab, above the Location Controls group, is the Telephony Actions group, as shown in Figure 35–13.
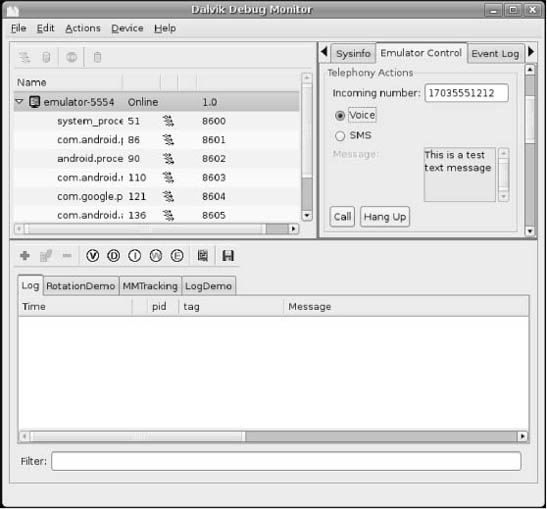
Figure 35–13. DDMS telephony controls
To simulate an incoming call, fill in a phone number, choose the Voice radio button, and click Call. At that point, the emulator will show the incoming call, allowing you to accept it (via the green phone button) or reject it (via the red phone button), as shown in Figure 35–14.
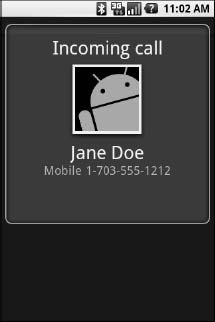
Figure 35–14. Simulated incoming call
To simulate an incoming text message, fill in a phone number, choose the SMS radio button, enter a message in the provided text area, and click Send. The text message will then appear as a notification, as shown in Figure 35–15.
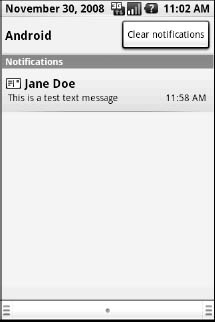
Figure 35–15. Simulated text message
And, of course, you can click the notification to view the message in the full-fledged messaging application, as shown in Figure 35–16.
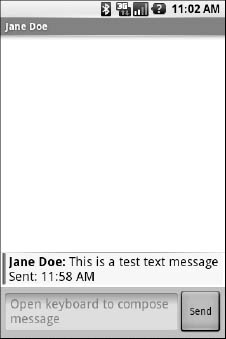
Figure 35–16. Simulated text message, in messaging application
Put It on My Card
The T-Mobile G1 has a microSD card slot. Many other Android devices are likely to have similar forms of removable storage, which the Android platform refers to generically as an SD card.
It's strongly recommended that developers use SD cards as the holding pen for large data sets: images, movie clips, audio files, and so on. The T-Mobile G1, in particular, has a relatively paltry amount of on-board flash memory, so the more you can store on an SD card, the better.
Of course, the challenge is that, while the G1 has an SD card by default, the emulator does not. To make the emulator work like the G1, you need to create and “insert” an SD card into the emulator.
Creating a Card Image
Rather than require emulators to somehow have access to an actual SD card reader and use actual SD cards, Android is set up to use card images. A card image is simply a file that the emulator will treat as if it were an SD card volume. If you are used to disk images used with virtualization tools (e.g., VirtualBox), the concept is the same. Android uses a disk image representing the SD card contents.
To create such an image, use the mksdcard utility, provided in the tools/ directory of your SDK installation. This takes two main parameters:
- The size of the image, and hence the size of the resulting “card.” If you just supply a number, it is interpreted as a size in bytes. Alternatively, you can append
KorMto the number to indicate a size in kilobytes or megabytes, respectively. - The filename under which to store the image.
So, for example, to create a 1GB SD card image, to simulate the G1's SD card in the emulator, you could run the following:
mksdcard 1024M sdcard.img
Inserting the Card
To have your emulator use this SD card image, start the emulator with the -sdcard switch, containing a fully qualified path to the image file you created using mksdcard. While there will be no visible impact—you won't see an icon or anything else in Android showing that you have a card mounted—the /sdcard path will now be available for reading and writing.
To put files on the /sdcard, either use File Explorer in DDMS or adb push and adb pull from the console.