Logstash is an open source tool designed to manage all of your server logs in a centralized location. This book includes detailed examples and insights that will help the novice install Logstash and use it like a pro. The book will also cover the other components of ELK Stack, such as Elasticsearch, Kibana, and Watcher and Shield. For this book, CentOS 7 and Ubuntu 16.0.4.1 LTS test server machines are Linode servers available from www.linode.com .
Why Use Logstash?
Log management is often a tedious task for server administrators. It’s a nightmare if you are managing multiple servers with many services and web apps running that are crucial for your business. The situation is even worse if you have hundreds of hosts and multiple log files with which you must work.
Imagine a situation in which on a Monday morning, you have reached your office and your boss immediately calls you in and says that there has been a major problem with your company’s web sites over the weekend. They are running very slow, or perhaps some of them went offline completely. Of course, you are upset, and you return to your workstation and start the long process of checking the logs, starting with GNU/Linux commands, such as grep or tail, or writing shell scripts to extract the information from the logs.
You begin by looking at secure logs, Apache logs, database logs, firewall logs, and so on, to locate the problem and investigate it. You might eventually find something, but the amount of time and effort this requires is just too much. Also, you may not have all of the necessary information.
There are tools available, such as syslog-ng, which are helpful but, again, require that you spend hours of your time finding everything, as the logs grow larger.
You need something that can parse your logs properly and efficiently. You need a tool with which you can search the strings and quickly find the results. Moreover, you need a tool that acts as a centralized logging system for your servers. Fortunately, Logstash is an excellent tool for doing just this.
Logstash is an open source tool developed by Jordan Sissel, who currently works for Elastic. Logstash acts as a data pipeline through which it processes the data from multiple servers and systems. Logstash can take inputs from TCP/UDP protocols, files, and log management systems, such as syslog-ng, rsyslog, and many more tools in the field that server administrators install to analyze server events. Like Puppet and CFEngine, or with monitoring systems like Nagios, Graphite & Zabbix.
For example, let’s say that you have a few servers running at different locations, and these are clusters or load-balancing servers for your web app. The beauty of Logstash is that it can be used in this scenario, as it allows you to have a master server wherein all of these nodes can send log data, and you can see and search the logs from this master machine. Isn’t that an amazing setup? Indeed, it is!
Logstash, Elasticsearch, and Kibana Setup
The servers that are running Logstash agents are called shippers. They send log events of your applications and services to the Logstash server.
The central Logstash server running services such as brokers, indexers, and storage interface with Kibana, which is a visualization tool.
Figure 1-1 illustrates how the Logstash, Elasticsearch, and Kibana setup works. We will explore the entire setup in greater depth in later chapters.
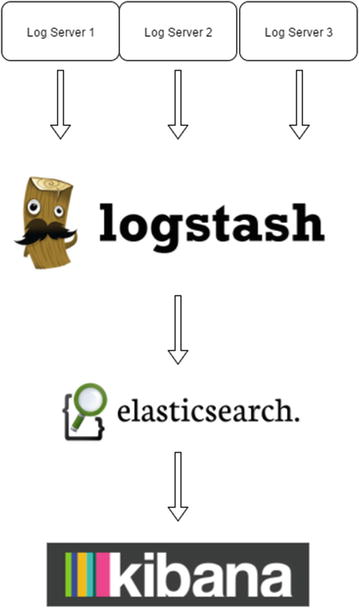
Figure 1-1. Logstash, Elasticsearch, and Kibana setup
Logstash collects data from the different sources defined by using the configuration file. Logstash can process any type of logs that are being maintained, including Apache logs, MySQL logs, firewall logs, and error logs. The best part is that one can store logs from different nodes and services in a centralized place and analyze them there.
Elasticsearch does real-time data analysis from different data sources. It is scalable, and it does full text search.
Kibana is a web application designed to visualize data in Elasticsearch. It allows you to search data (in our case, logs) and visualize it in various ways (such as bar graph, pie charts, and other graph types). Visualizations can be organized in dashboards for quick access to information.
Following are some of Logstash’s key features:
Logstash is open source and free to use.
Logstash is lightweight.
Logstash is highly customizable.
Logstash is easy to configure.
Input and output plug-ins are readily available for Logstash.
Preinstallation Setup
Now let’s start the process of installing Logstash. I will be covering the Linux distributions CentOS 7 and Ubuntu 16.04.1. Before you start installing Logstash on your machines, you have to install Java, as Logstash is written in JRuby, and you must have a Java Development Kit (JDK) installed. You can install OpenJDK 7 or later versions and can also use the official Oracle version. Here, I prefer working with OpenJDK, as you can install it easily using yum on CentOS and APT on Ubuntu.
Hardware Requirements
You might be setting up the ELK Stack for a production environment in which you are processing much data from different sources. Also, in later chapters, we will be installing more packages and processing more data. Following, therefore, are the minimum hardware requirements:
4GB RAM (8GB recommended)
SSD hard drive (storage amount can be anything depending on your usage)
Multiple core CPU
Fast and reliable network. Most data centers have good network speed these days.
Install a Fresh Server
Install a fresh server using CentOS or Ubuntu. Before we proceed with installing the packages, I assume that the user is installing the packages as user and not as root. It is always a good idea to use a GNU/Linux server as user and not as root.
To install the packages as user, you have to use a sudo command. The following link shows you how to configure sudo and how to add user into a sudoers file:
For Ubuntu
Installing OpenJDK 8 and JRE on CentOS 7
If you are installing OpenJDK 8 and JRE, do so as user. On a CentOS or Ubuntu machine, open the terminal from your KDE or Gnome window manager. You will see a screen similar to the one shown in Figure 1-2.

Figure 1-2. Connect remote server using SSH
If you are working remotely, SSH into the remote system, which is illustrated in Figure 1-3. Always check for updates on a freshly installed server, as follows:
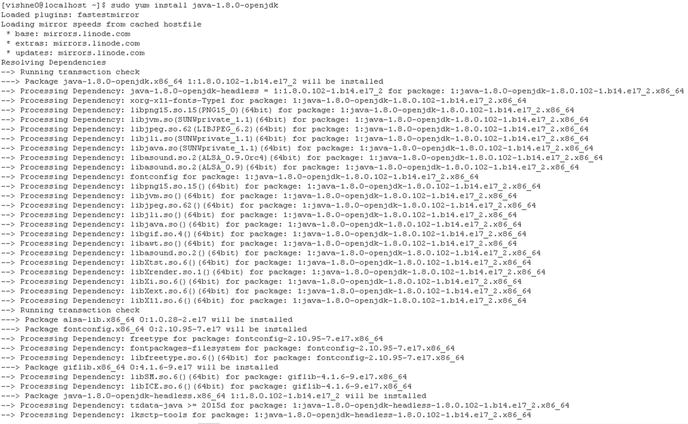
Figure 1-3. Installing Java
[vishne0@localhost ∼]$ sudo yum check-update[vishne0@localhost ∼]$ sudo yum update
Use the following commands in the terminal to install the packages.
[vishne0@localhost ∼]$ sudo yum install java-1.8.0-openjdk Press Enter, and then type Y to install all the dependencies, along with the OpenJDK JRE to be installed.
To install OpenJDK 8 JDK, run the following command:
[vishne0@localhost ∼]$ sudo yum install java-1.8.0-openjdk-develPress Enter, and sudo will ask for your password before proceeding further. Enter your password, then type Y. It will now install OpenJDK, as shown in Figure 1-4.
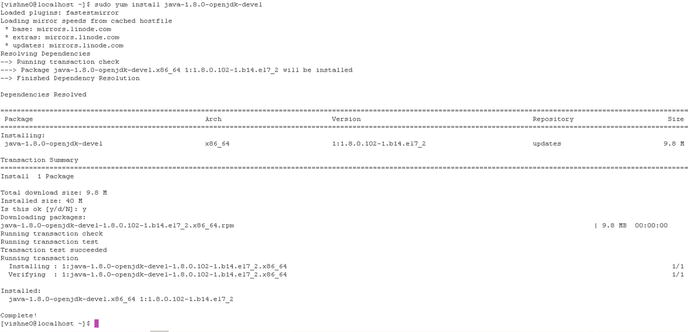
Figure 1-4. Installing OpenJDK 8 and JRE on CentOS 7
Installing OpenJDK 8 and JRE on Ubuntu 16.04.1 LTS
Always upgrade a freshly installed server. To upgrade Ubuntu 16.04.1 LTS, we will run following commands:
vishne0@snf-725572:∼$ sudo apt-get updatevishne0@snf-725572:∼$ sudo apt-get upgrade
On some servers, OpenJDK 8 comes preinstalled in Ubuntu 16.04.1 LTS, but you should still check it out to be sure. Open your terminal and issue the following commands:
vishne0@snf-725572:∼$ java -versionopenjdk version "xxxx"OpenJDK Runtime Environment (build 1.8.0_111-8u111-b14-2ubuntu0.16.04.2-b14)OpenJDK 64-Bit Server VM (build 25.111-b14, mixed mode)
For me, it’s already installed. However, if you do not see the preceding output, follow these instructions:
vishneo@:∼$ sudo apt-get install openjdk-8-jreThis command will show you all the dependencies that have to be installed with the package, as shown in Figure 1-5.
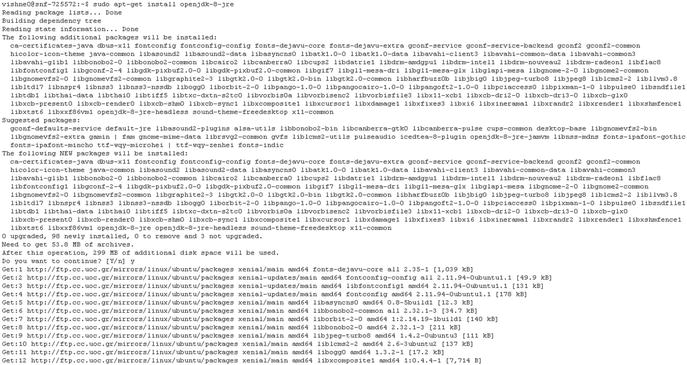
Figure 1-5. All the package OpenJDK dependencies
Press Enter and then press Y (see Figure 1-6).
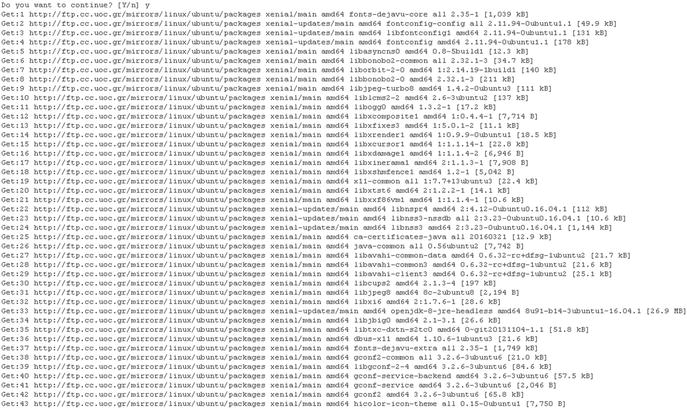
Figure 1-6. The number of packages that will be installed
It will take some time to install all of the packages. Once this is done, you will have Java installed, as required by Logstash, in order to work properly.
Installing Logstash
Now we will move forward and install Logstash on our server. You can install the Logstash source from the following address: https://www.elastic.co/downloads/past-releases/logstash-2-4-1 .
To begin simply, we will now explore how we can install Logstash from repositories on CentOS 7 and Ubuntu 16.04.1 LTS.
Installing Logstash on CentOS 7
First, we will download and install the public signing key (Figure 1-7). This is an important step to verify that the package is not corrupted or tampered with.
Figure 1-7. Installing a public signing key
[vishne0@localhost ∼]$ sudo rpm --import https://packages.elasticsearch.org/GPG-KEY-elasticsearchOnce complete, we will add the Logstash repository into our system, because the CentOS 7 default repository doesn’t contain Logstash.
We will add it below in the /etc/yum.repos.d/ directory. We will use the standard text editor, nano or vi, from the command line, to create the new repository , as shown in Figure 1-8.
Figure 1-8. Creating a repository using vi
Let’s name our repo logstash.repo. Issue the following command, to add the repository in your terminal window (see Figure 1-9).
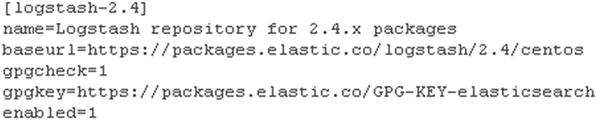
Figure 1-9. Code for Logstash repo using vi
[vishne0@localhost ∼]$ sudo vi /etc/yum.repos.d/logstash.repoPress i to insert text.[logstash-2.4]name=Logstash repository for 2.4.x packagesbaseurl=https://packages.elastic.co/logstash/2.4/centosgpgcheck=1gpgkey=https://packages.elastic.co/GPG-KEY-elasticsearchenabled=1
Once you have added the repo, press ESC, then :wq inside the vi editor, to save it and exit (see Figure 1-10).
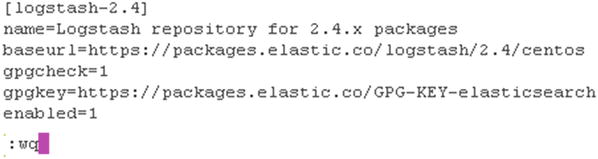
Figure 1-10. Exiting vi
If you are using nano, you have to issue the following commands in your terminal (see Figure 1-11):
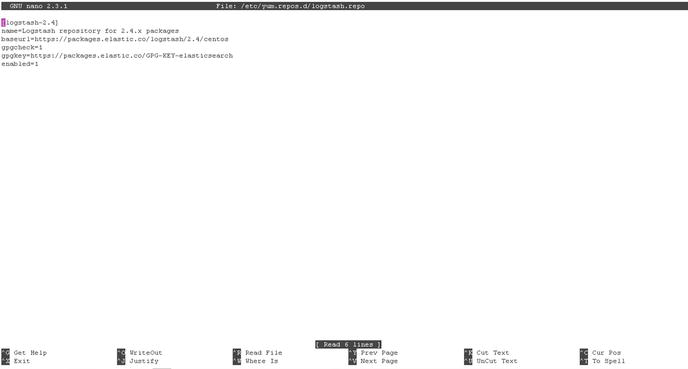
Figure 1-11. Creating a Logstash repo file using nano
[vishne0@centylog root]$ sudo nano /etc/yum.repos.d/logstash.repo To save the file in nano, press CTRL+X, and enter Y.
Now you are ready to install Logstash using yum (see Figure 1-12).
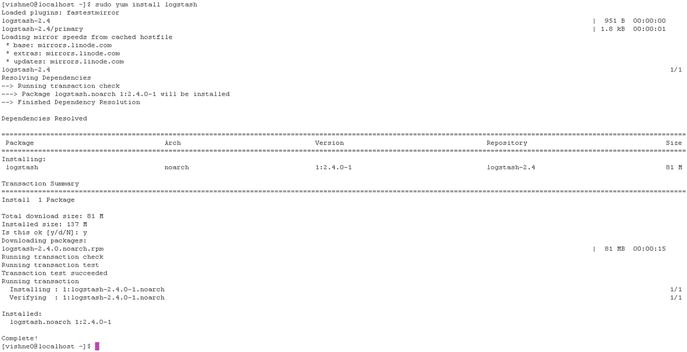
Figure 1-12. Installing Logstash using yum
[vishne0@localhost ∼]$ sudo yum install logstash Press Enter and then Y. Logstash is now installed on your server.
We will now check out the Logstash installation. By default, in CentOS 7, it will be installed in /opt. Enter the following command to change the directory to /opt/logstash (see Figure 1-13).
Figure 1-13. Changing the directory to Logstash
[vishne0@localhost ∼]$ cd /opt/logstash/Now we will run Logstash, in order to check if it’s working properly.
[vishne0@localhost logstash]$ sudo bin/logstash -e 'input { stdin { } } output { stdout {} }'Press Enter, and then wait for few seconds, until you see a message on your screen, such as the one shown in Figure 1-14.
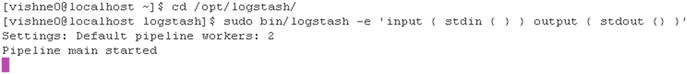
Figure 1-14. Running Logstash
When you see the message that the Logstash start-up has completed, type in the following text and press Enter.
It Works!!!You will see a message such as the following. It means that Logstash is working just fine (see Figure 1-15).
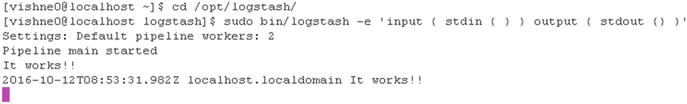
Figure 1-15. Logstash running successfully
Pipeline main startedIt works!!2016-10-12T08:53:31.982Z localhost.localdomain It works!!
Now let’s see what information Logstash is displaying. It shows us the date, timestamp, IP address or hostname (if you have configured one), and our message. In my case, the hostname is localhost.
There is one more thing that you may have noticed. It is a value 982Z, which is part of the timestamp; 982 is a fraction of a second; and Z represents UTC (a.k.a. Zulu), as Logstash normalizes all timestamps to UTC.
To stop running Logstash, press Ctrl+D.
Installing on Ubuntu 16.04.1 LTS
We installed OpenJDK 8 JRE earlier (see Figure 1-5). We will now install OpenJDK 8 JDK on Ubuntu 16.04.1 LTS. Open the terminal and issue the following commands (see Figure 1-16):
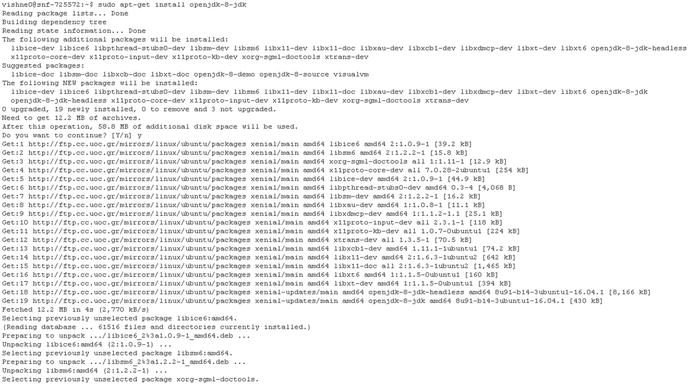
Figure 1-16. Installing OpenJDK 8 JDK
vishne0@snf-725572:∼$ sudo apt-get install openjdk-8-jdk Press Enter and then Y, apt-get will install all the dependencies required by the package.
Now we will install Logstash on our Ubuntu server. First, we will install the public signing key with following commands:
vishne0@snf-725572:∼$ sudo wget -qO - https://packages.elastic.co/GPG-KEY-elasticsearch | sudo apt-key add -Now we add the Logstash repository to the /etc/apt/source.list.d/ file, with the following commands:
vishne0@snf-725572:∼$ echo "deb http://packages.elastic.co/logstash/2.4/debian stable main" | sudo tee -a /etc/apt/sources.list.d/logstash.listNext, we will update our repository with the following command (see Figure 1-17):
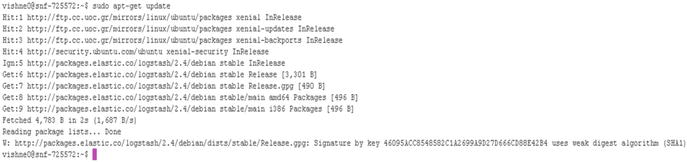
Figure 1-17. Updating repository using apt-get update
vishneo@:∼$ sudo apt-get update Once it has been updated, we will install Logstash, using the following command (see Figure 1-18):
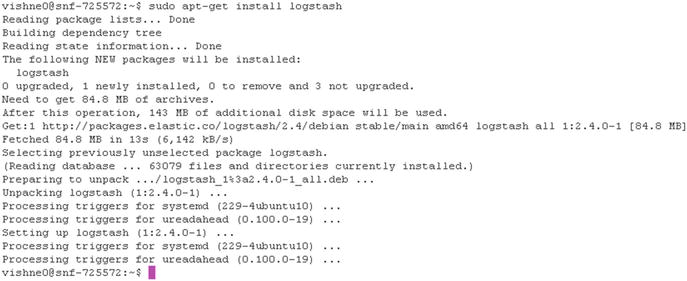
Figure 1-18. Installing Logstash on Ubuntu 16.04.1 LTS
vishne0@snf-725572:∼$ sudo apt-get install logstash The command will install Logstash in the /opt directory. Run the following command to go to the logstash/ directory (see Figure 1-19).

Figure 1-19. Changing the directory to /opt/logstash/bin
vishne0@snf-725572:/$ cd /opt/logstash/Now we are inside the bin directory. Enter the following command to test your installation on Ubuntu. We will run this command. Once you see that Pipeline main has started, type “It Works!!!”.
vishne0@snf-725572:/opt/logstash$ sudo bin/logstash -e 'input { stdin { } } output { stdout {} }'It Works!!!2016-10-12T09:56:58.057Z snf-725572 IIt Works!!!
As you can see, it is working just fine on Ubuntu too. As previously noted, here you are seeing the date, timestamp, IP address or hostname (if you have configured one), and our message. In my case, the hostname is snf-725572.
There is one more thing you that may have noticed. It is a value of 851Z. It is part of the timestamp. 851 is a fraction of a second, and Z represents UTC (a.k.a. Zulu), as Logstash normalizes all timestamps to UTC.
To stop running Logstash, press Ctrl+D.
Logstash CLI Flags
It’s always a good idea to familiarize yourself with the options an application provides. The following is a listing of all of the CLI flags that Logstash provides (see Table 1-1). You can use the --help option to see all this information.
Table 1-1. Logstash CLI Flags
Options | Summary |
|---|---|
-f, --config CONFIG_PATH | Load the Logstash config from a specific file or directory. If a directory is given, all of the files in that directory will be concatenated in lexicographical order and then parsed as a single config file. You can also specify wildcards (globs), and any matched files will be loaded in the order described previously. |
-e CONFIG_STRING | Use the given string as the configuration data. It has the same syntax as the config file. If no input is specified, then the following is used as the default input: "input { stdin { type => stdin } }". If no output is specified, the following is used as the default output: "output { stdout { codec => rubydebug } }". If you wish to use both defaults, use the empty string for the -e flag (default: ""). |
-w, --filterworkers COUNT | Sets the number of filter workers to run. (default: 0) |
-l, --log FILE | Writes Logstash internal logs to the given file. Without this flag, Logstash will transmit logs to standard output. |
-v | Increases verbosity of Logstash internal logs. Specifying this once will show “informational” logs. Specifying it twice will show “debug” logs. This flag is deprecated. You should use --verbose or --debug instead. |
--quiet | Quieter Logstash logging. This causes only errors to be transmitted. |
--verbose | More verbose logging. This causes “info”-level logs to be transmitted. |
--debug | Most verbose logging. This causes “debug”-level logs to be transmitted. |
-V, --version | Emit the version of Logstash and its friends and then exit. |
-p, --pluginpath PATH | A path to where plug-ins can be found. This flag can be issued multiple times to include multiple paths. Plug-ins are expected to be in a specific directory hierarchy: 'PATH/logstash/TYPE/NAME.rb' where TYPE is 'inputs', 'filters', 'outputs', or 'codecs' and NAME is the name of the plug-in. |
-t, --configtest | Check configuration for valid syntax and then exit. |
--[no-]allow-unsafe-shutdown | Force Logstash to exit during shutdown, even if there are still in-process events in memory. By default, Logstash will refuse to quit until all received events have been pushed to the outputs. (default: false) |
-h, --help | print help |
vishne0@snf-725572:/opt/logstash$ sudo bin/logstash --helpUsage:/bin/logstash agent [OPTIONS]
Logstash Configuration
Now that Logstash is installed and you have checked the CLI flags, it is time to configure it. We will do a very simple configuration here.
Create and save the file in the Logstash configuration directory in /etc/logstash/conf.d using vi or nano.
[vishne0@localhost logstash]$ sudo vi /etc/logstash/conf.d/logstash-sample.confIn our first sample, we will have a simple input and output, as follows:
## Sample Logstash Configinput {stdin {}}output {stdout {}}
We will now run Logstash, to see if this file works. Change the directory to /opt/logstash and issue the following command:
[vishne0@localhost logstash]$ sudo bin/logstash -f /etc/logstash/conf.d/logstash-sample.confPress Enter, then type Config Test. Press Enter again, and you will see the following output:
Pipeline main startedConfig Test2016-10-12T09:05:01.470Z localhost.localdomain Config Test
As you can see, the correct output is displayed, so our sample config file is working just fine, as shown in Figure 1-20.
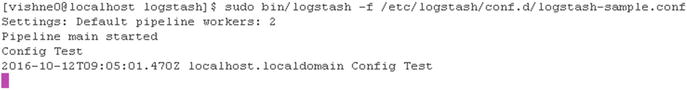
Figure 1-20. Running Logstash using our sample configuration
Logstash Logs
By default, Logstash stores all the logs in /var/log/logstash. You will not see any logs for now but will when in later chapters we configure Logstash to parse log files.
Upgrading Logstash
As we are using CentOS 7 and Ubuntu 16.04.1 LTS servers for our setup, we will always upgrade Logstash using such package managers as yum and apt. Before upgrading Logstash, shut down the Logstash pipeline
[vishne0@localhost /]$ sudo service logstash stopOn CentOS 7 server[vishne0@localhost /]$ sudo yum update logstashOn Ubuntu 16.04.1 LTS[vishne0@localhost /]$ sudo apt-get upgrade logstash
Once Logstash is upgraded, you can test your configuration files by changing the directory to /opt/logstash and running the following:
[vishne0@localhost logstash]$ sudo bin/logstash -f /etc/logstash/conf.d/nameofconfigurationfile.confIf any updates appear in your configuration file, then do the updates. Once done, start Logstash.
[vishne0@localhost logstash]$ sudo service logstash start Summary
In this chapter, we tested our Logstash installation on CentOS 7 and Ubuntu 16.04.1 LTS. I have also introduced you to what Logstash can be used for and how to do the following:
Install Logstash
Configure Logstash
Run Logstash using a simple configuration on our server
In next chapters, you will learn more about how to install Elasticsearch and Kibana and how to configure them in order to have our setup ready.