
In the previous chapter, you learned how to configure Filebeat to send events to a centralized log server. In Chapter 3, you learned how to get events from the Apache access_log to your ELK Stack setup.
Today, almost every company is running multiple servers for their web sites, databases, mobile apps, and so on. We configured the ELK Stack to analyze logs at a central place for our infrastructure, so we have to watch and search all of the events.
In this chapter, you will learn how to configure different types of logs for your ELK Stack setup. Furthermore, you will learn how to configure events from different log files on servers
To begin, first you will send the events from the Syslog to your ELK stack. Syslog is the standard for most Unix-based systems. It stores logs in /var/log/messages.
Syslog Configuration with Logstash CentOS 7
Syslog comes with CentOS 7 by default. Depending on the setup, Syslog can collect messages from various services or programs. You will now configure Logstash to get the events from /var/log/messages.
Create a configuration file in /etc/logstash/conf.d, using the name 05-syslog.conf. The content of the file will be similar to the code shown here:
input {file {path => "/var/log/messages"start_position => beginning}}output {elasticsearch {hosts => ["localhost:9200"]}stdout { codec => rubydebug }}
In Figure 5-1, we followed the same pattern as with other configuration files in earlier chapters. In the input section, we are using a file variable and the path for /var/log/messages. In the output section, we are sending it to Elasticsearch as a simple configuration. The most important thing to remember here is that /var/log/messages is owned by root, and it doesn’t allow permission for any other users to read the file. You must have Logstash user allow permission to read the /var/log/messages file. To do this, run the following simple command:
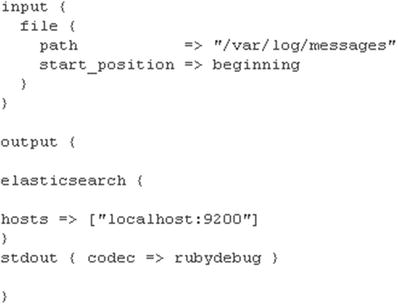
Figure 5-1. Configuring Logstash to receive events from /var/log/messages
[vishne0@snf-718079 log]$ sudo setfacl -m u:logstash:r /var/log/messagesAnd that’s it, really. As you have already configured Kibana, you can check if you are seeing the events from /var/log/messages.
As you can see in Figure 5-2, Kibana is now showing events from /var/log/messages. Thus, we now have our Syslog events configured on CentOS 7.
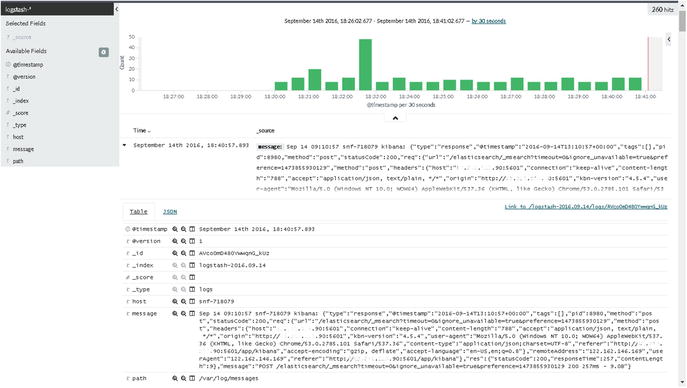
Figure 5-2. Logs in Kibana for /var/log/messages
Syslog Configuration with Logstash on Ubuntu 16.04.1 LTS
On Ubuntu minimal Syslog is not installed by default. Thus, first, you have to install the Syslog package on your Ubuntu machine (Figure 5-3). Remember, before installing anything on a freshly installed server, always check to see if any updates are available.
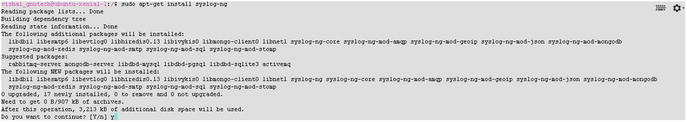
Figure 5-3. Installing syslog-ng on Ubuntu 16.04.1 LTS
vishal_gnutech@ubuntu-xenial-1:/$ sudo apt-get updatevishal_gnutech@ubuntu-xenial-1:/$ sudo apt-get upgradevishal_gnutech@ubuntu-xenial-1:/$ sudo apt-get install syslog-ngType 'Y'
Once installed, go to /var/log/ and run 'ls'. You will see the file messages (Figure 5-4):
Figure 5-4. syslog-ng installed and created the file messages in /var/log
vishal_gnutech@ubuntu-xenial-1:/var/log$ ls | grep messagesmessages
Now copy the content of the file from the previous section of 05-syslog.conf and create a new configuration file in /etc/logstash/conf.d. Note that I have named the file 05-syslog.conf. The reason for this is that when Logstash looks at a directory, in our case, /etc/logstash/conf.d, it loads files in alphabetic order. Thus, if you have too many configuration files, you should name them properly, to avoid any confusion.
Once that’s complete, restart Logstash, then log on to the Kibana dashboard, and you will see the incoming data.
Configuring Logstash for Mail Servers
Every company has its own mail servers. There are things that a server admin must monitor on a mail server daily, such as incoming spam, suspicious files sent as attachments, mail delivery failure, and so forth. You will be learning about two of the most commonly used e-mail solutions on GNU/Linux servers Exim and Postfix. You will learn, too, how to configure Logstash for these e-mail server programs.
To proceed, we must assume that at least one of the e-mail server software programs is already installed.
Exim Configuration
Exim is a mail transfer agent mostly used with cPanel and Mailman. Exim both logs and saves the logs in /var/log/exim/mainlog. If you have a server running cPanel, then the log files will be located at /var/log/. You will now see how to configure Exim logs with Logstash. I am assuming that the mail server is a remote server. To send the logs from a remote mail server to your ELK Stack, you will configure Filebeat, as explained in Chapter 4, and make the changes in /etc/filebeat.yml, as shown here (Figure 5-5):
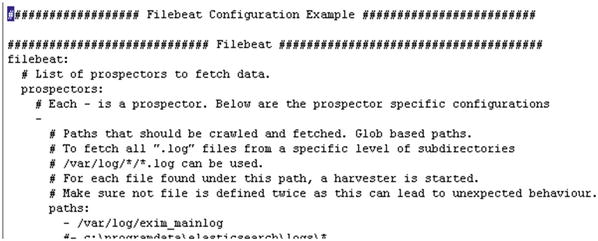
Figure 5-5. Configuring filebeat.yml to read Exim logs
# Make sure that no file is defined twice, as this can lead to unexpected behavior. paths:- /var/log/exim_mainlog
As shown in Figure 5-5, we have configured Filebeat to read Exim logs. In some cases, you might have logs located in /var/log/exim/. Make sure that you have opened port 5044 in the firewall.
Once that’s done, save it and restart Filebeat. Now let’s check Kibana, to see if we are getting the events. Open the Kibana dashboard and check logstash-* index.
Figure 5-6 reveals that your ELK Stack is getting events from the remote mail server, and it shows you the logs. Exim also produces a panic log and reject logs as well. You can also configure them in filebeat.yml. Set their path as /var/log/exim/*.log, or define them each in a single line, as follows:
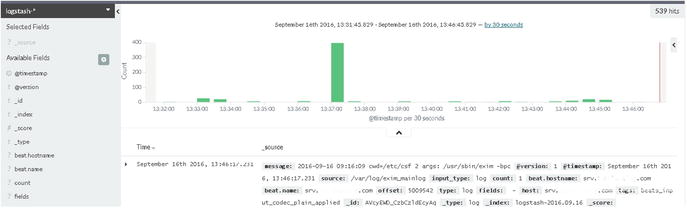
Figure 5-6. Kibana showing Exim logs from the remote server
# Make sure that no file is defined twice, as this can lead to unexpected behavior.paths:- /var/log/exim_mainlog- /var/log/exim_rejectlog- /var/log/exim_painclog
Postfix Configuration
Postfix is one of the most popular and widely used mail servers in the world. It runs on all available Unix systems. Postfix saves the log file at /var/log/maillog.
You will now configure your Postfix-based mail server to send events to the ELK Stack (Figure 5-7). As described in Chapter 4, install Filebeat on the mail server and change the filebeat.yml file as described here:
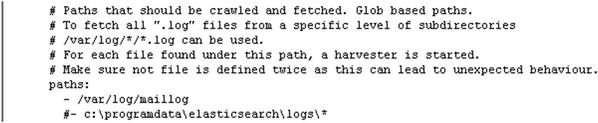
Figure 5-7. Configuring logs for Postfix in Filebeat
# Make sure that no file is defined twice, as this can lead to unexpected behavior.paths:- /var/log/maillog
Restart Filebeat. Now check your Kibana dashboard to see if you are getting the events.
As you can see in Figure 5-8, Postfix logs are now coming to the Kibana dashboard.
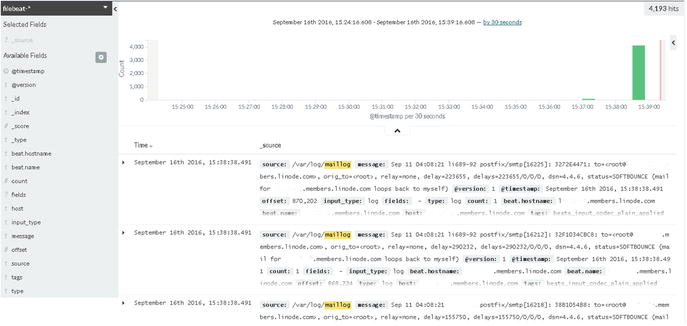
Figure 5-8. Postfix events in the Kibana dashboard
Configuring Secure Log
It’s very important for every server administrator to keep an eye on the logs, for authentication and authorization privileges. In GNU/Linux systems, you have a log file for that: /var/log/secure. The log file contains information about successful accesses as well as failed ones. You can analyze the log and block an attacker’s IP.
We will now configure secure logs. As you have seen in earlier sections, we will be using Filebeat to allow remote servers to send events to our ELK Stack. You have to install Filebeat on every remote server from which you want to receive events. (Refer to Chapter 4 for how to install and configure Filebeat.) Once Filebeat is installed, open /etc/filebeat/filebeat.yml and make the following changes:
-# Paths that should be crawled and fetched. Glob based paths.# To fetch all ".log" files from a specific level of subdirectories# /var/log/*/*.log can be used.# For each file found under this path, a harvester is started.# Make sure not file is defined twice as this can lead to unexpected behavior.paths:- /var/log/secure
As shown in Figure 5-9, you have configured Filebeat to read the /var/log/secure file. Now check Kibana for events coming in from /var/log/secure.
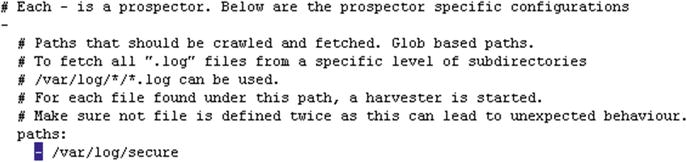
Figure 5-9. Configuring Filebeat for /var/log/secure
As shown in Figure 5-10, you can see such details as the IP address and the username of the failed authentication. This kind of information is very useful to server administrators. You can use this information to make your servers more secure, by blocking an attacker’s IP.
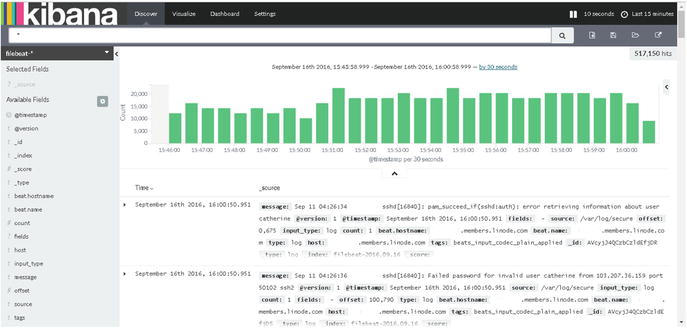
Figure 5-10. Secure log content from the remote server
MySQL Logs
MySQL is an open source relational database management system that is used worldwide. Database log monitoring is very important, as you can identify errors or queries that are slowing your application, and a lot more. Install Filebeat on a remote server, as explained in Chapter 4. Now, before you move forward and configure Filebeat, you must configure MySQL to generate a slow log. Open the MySQL configuration file, as follows (see also Figure 5-11):
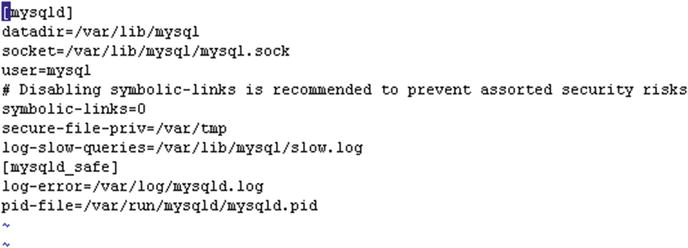
Figure 5-11. Configuring a MySQL slow log
[vishne0@centylog log]$ sudo vi /etc/my.cnf[mysqld]datadir=/var/lib/mysqlsocket=/var/lib/mysql/mysql.sockuser=mysql# Disabling symbolic-links is recommended to prevent assorted security riskssymbolic-links=0secure-file-priv=/var/tmplog-slow-queries=/var/lib/mysql/slow.log[mysqld_safe]log-error=/var/log/mysqld.logpid-file=/var/run/mysqld/mysqld.pid
As shown in Figure 5-11, a line is added to my.cnf to enable a slow-queries log. Now restart the MySQL server, as follows:
[vishne0@centylog log]$ sudo service mysql restartCheck to see if the file is created.
[vishne0@centylog log]$ cd /var/lib/mysql/[vishne0@centylog log]$ ls | grep slowslow.log
The file is created, so let’s move forward and configure Filebeat. Open the file /etc/filebeat/filebeat.yml in an editor.
[vishne0@centylog log]$ sudo vi /etc/filebeat/filebeat.yml# Make sure that no file is defined twice, as this can lead to unexpected behavior.paths:- /var/lib/mysql/slow.log
As shown in Figure 5-12, you have configured Filebeat to read the MySQL slow query log file. Save the file and restart Filebeat, as follows:
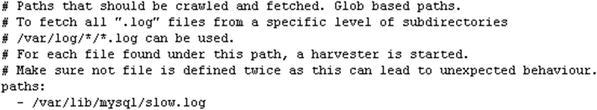
Figure 5-12. Configuring Filebeat to read the MySQL slow log
[vishne0@centylog log]$ sudo service filebeat restart Your job is done here. Open the Kibana dashboard and see if you are receiving the inputs. Always remember that you must open port 5044 on every server on which you are configuring Filebeat.
As shown in Figure 5-13, we are about to view a query that is taking a long time to execute.
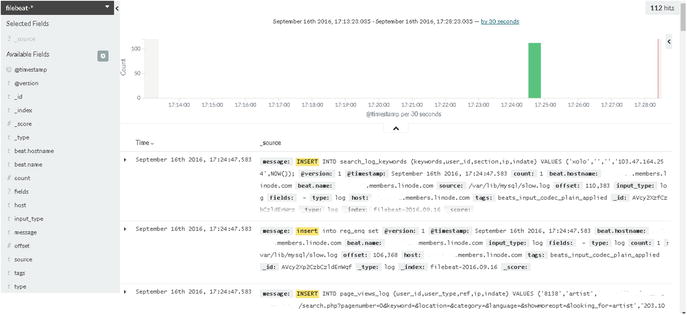
Figure 5-13. Logs of MySQL slow query
The preceding are just a few examples of logs that you can configure using Filebeat and Logstash. There are lots of other kinds of logs, such as audit.log, which can be configured, as well as any other application running on a remote server that you want to configure.
Summary
In this chapter, you learned how to configure system and services logs using Filebeat on your ELK Stack. You also learned the following:
How to allow permission to Logstash user to read files
How to configure mail logs from Exim and Postfix
How to configure a MySQL slow log query
Thus far, we have configured our ELK Stack and have also configured events from a remote server. With this and previous chapters, the most basic and important aspects of the ELK Stack have now been covered.
In next chapter, you will see how to configure Graphite with the ELK Stack, to monitor and analyze historical logs and data.