
Setting Up Logstash on a Remote Server
In previous chapters, we installed Logstash, Elasticsearch, and Kibana. We configured an ELK Stack on a single server and also tested it. Running an ELK Stack on a single server, however, is not very useful. Our goal is to set up a centralized logging system for all of our servers, running at different locations and hosting web sites, web applications, ERP, and CRM systems. By setting up a centralized logging system, we can monitor the performance of our servers and analyze the logs for any issue that arises. Thus, in this chapter, you will see how we can ship events from remote servers to our ELK Stack server.
To ship events from a remote server, we will use the Filebeat shipper. Filebeat is a data shipper based on the Logstash forwarder. It is installed as an agent on servers from which we want to send data to our centralized log system. The best part of Filebeat is that it monitors the logs, takes the files, and ships them to Logstash for parsing, or we can send the Filebeat events to Elasticsearch directly for indexing.
Figure 4-1 illustrates how Filebeat works with the ELK Stack :
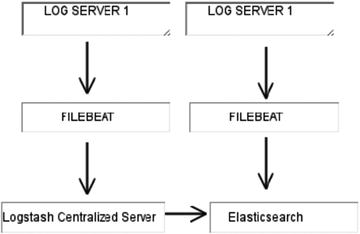
Figure 4-1. Filebeat sends events to Logstash, or it can send them directly to Elasticsearch
Installing Filebeat on a Remote CentOS 7 Server
Now let’s start by installing Filebeat on our CentOS 7 server. First, we will download and install the public signing key.
vishne0@srv [∼]# sudo rpm --import https://packages.elastic.co/GPG-KEY-elasticsearchNow let’s create the repo file in /etc/yum.repos.d/ with the name filebeat.repo.
vishne0@srv [∼]# sudo vi /etc/yum.repos.d/filebeat.repoPress i to insert the code into the file.
[Filebeat]name= Filebeat Repositorybaseurl=https://packages.elastic.co/beats/yum/el/$basearchenabled=1gpgkey=https://packages.elastic.co/GPG-KEY-elasticsearchgpgcheck=1
Press Esc and then :wq to exit the editor, as shown in Figure 4-2.
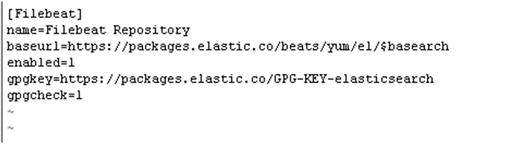
Figure 4-2. Creating Filebeat repo in CentOS 7 server
Now that our repository is ready, let’s install Filebeat (see Figure 4-3).
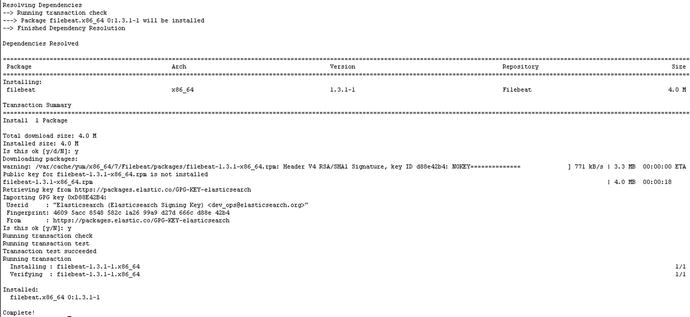
Figure 4-3. Installing Filebeat on a CentOS 7 server, using yum
Filebeat is now installed, so let’s configure it to run at boot up.
vishne0@srv [∼]# sudo chkconfig --add filebeatNow it’s added to boot up as well.
Next, let’s Install Filebeat on Ubuntu16.04.1 LTS.
Installing Filebeat on a Remote Ubuntu 16.04.1 LTS Server
To install Filebeat on our remote Ubuntu server, we will first download and install the public signing key, as follows:
vishne0@bckeventaa:/root$ curl https://packages.elasticsearch.org/GPG-KEY-elasticsearch | sudo apt-key add -Next, we will add a repository file to /etc/apt/sources.list.d/filebeat.list.
vishne0@bckeventaa:/$ echo "deb https://packages.elastic.co/beats/apt stable main" | sudo tee -a /etc/apt/sources.list.d/filebeat.listWe have now created the repository file. Next, let’s update our system by running the following command (see Figure 4-4):
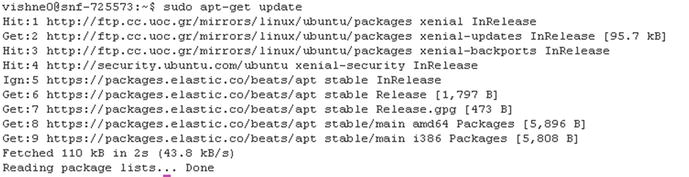
Figure 4-4. Running the apt-get update
vishne0@bckeventaa:/$ sudo apt-get updateOur repository is updated, so now let’s install Filebeat (see Figure 4-5).
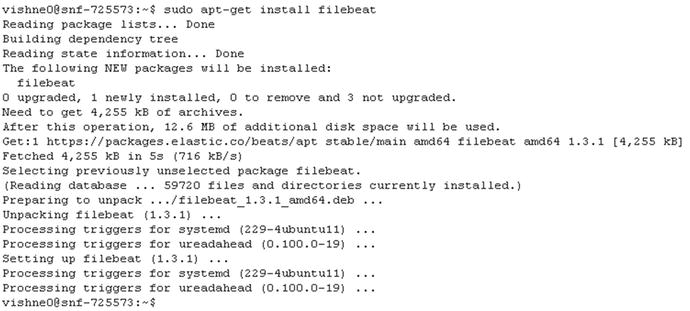
Figure 4-5. Installing Filebeat on a remote Ubuntu server
vishne0@bckeventaa:/$ sudo apt-get install filebeatWe now add Filebeat to /etc/init.d, so that it starts automatically during boot up (see Figure 4-6).
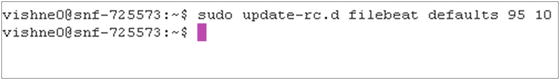
Figure 4-6. Adding Filebeat to start automatically at boot up
vishne0@bckeventaa:/$ sudo update-rc.d filebeat defaults 95 10Configuring Filebeat on CentOS 7 and Ubuntu 16.04.1 LTS
We are now ready to configure Filebeat for both CentOS 7 and Ubuntu 16.04.1 LTS. The configuration file is placed at /etc/filebeat/filebeat.yml.
Let’s configure Filebeat on CentOS 7 first. Open the /etc/filebeat/filebeat.yml file (see Figure 4-7).
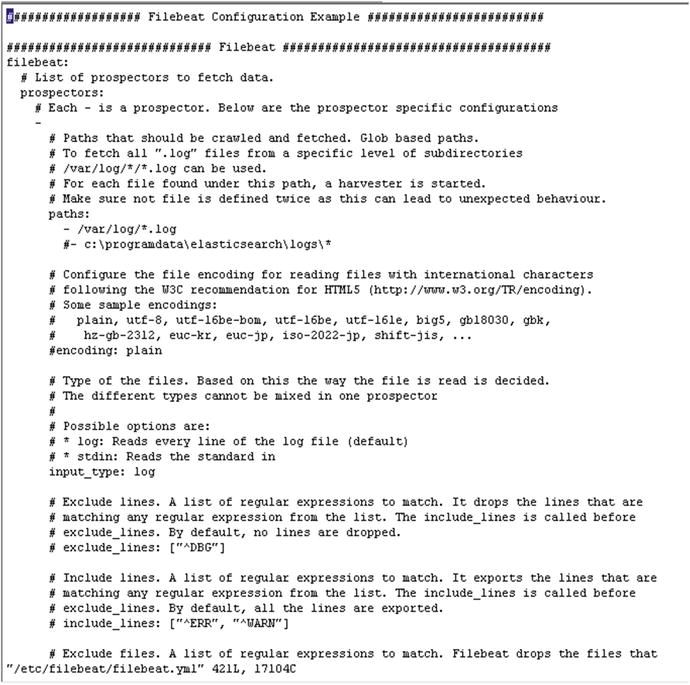
Figure 4-7. Editing the filebeat.yml file
vishne0@srv [/home]# sudo vi /etc/filebeat/filebeat.yml Let me explain the configuration parameters just a bit, as shown in the following code snippet:
filebeat:# List of prospectors to fetch data.prospectors:# Each - is a prospector. Below are the prospector specific configurations-# Paths that should be crawled and fetched. Glob based paths.# To fetch all ".log" files from a specific level of subdirectories# /var/log/*/*.log can be used.# For each file found under this path, a harvester is started.# Make sure not file is defined twice as this can lead to unexpected behaviour.paths:- /var/log/*.log#- c:programdataelasticsearchlogs*
Here, the line -/var/log/*.log, '-' is a prospector for a single path, which means that Filebeat will harvest all of the files with an extension .log within this path.
Now let’s send the output to our centralized log server. We can send our output to Logstash or to Elasticsearch directly. Next, we will see how we can send the output to both Logstash and Elasticsearch.
Sending Output to Logstash Using Filebeat
First, go to the Logstash as output section in our filebeat.yml configuration file (see Figure 4-8).
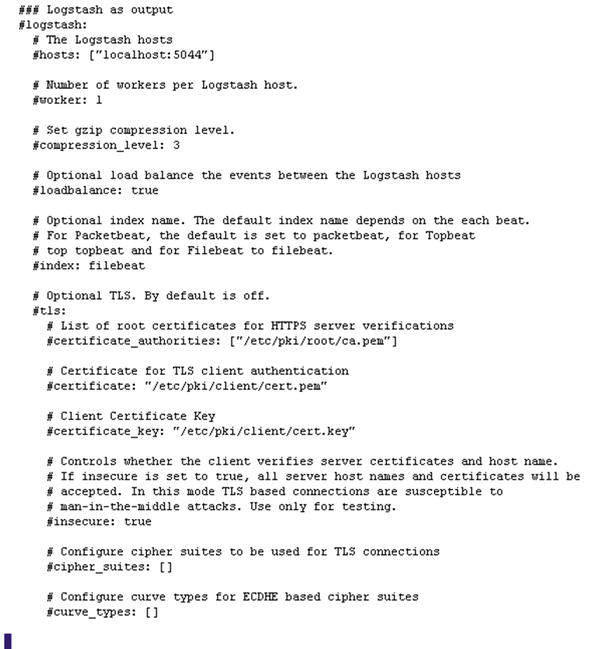
Figure 4-8. Logstash as output section in filebeat.yml
In the Logstash as output section, please uncomment the following line:
### Logstash as outputlogstash:# The Logstash hostshosts: ["XXX.XXX.XX.XXX:5044"]
Here, I have removed # from the front of Logstash: and from hosts: and entered the IP address of the remote Logstash server we have set up. The port number, 5044, is written by default into the configuration file.
To receive inputs from Filebeat, we have to configure Logstash. So, let’s go back to our centralized Logstash server and install the plug-in called logstash-input-beats (see Figure 4-9). Once logged in to the server, change the directory to /opt/logstash/bin. Inside bin, run the following command:
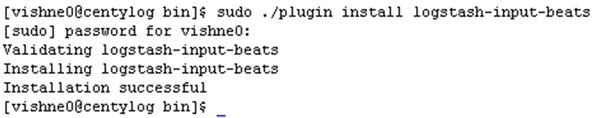
Figure 4-9. Installing the beats plug-in for Logstash to accept incoming beats connections
[vishne0@centylog bin]$ sudo ./plugin install logstash-input-beatsNow that the plug-in is installed, let’s configure Logstash to receive the connection at port 5044. Let’s create a configuration file for Logstash to receive the input from Filebeat.
We will name the file 02-srv1.conf. Change the directory to /etc/logstash/conf.d.
[vishne0@centylog /]$ cd /etc/logstash/conf.d/Now let’s create the file:
[vishne0@centylog /]$ sudo vi /etc/logstash/conf.d/02-srv1.confPress I and put below code inside the file:
input {beats {port => 5044}}output {elasticsearch {hosts => "localhost:9200"index => "%{[@metadata][beat]}-%{+YYYY.MM.dd}"document_type => "%{[@metadata][type]}"}}
If you examine the preceding input section, you will see the code regarding port 5044 and then the code that sends the output to Elasticsearch at port 9200.
Now restart Logstash on our centralized server. We also start Filebeat on our remote server.
To restart Logstash on our centralized server, issue the following command:
[vishne0@centylog /]$ sudo /etc/init.d/logstash restartTo start Filebeat on our remote server, issue the following command:
vishne0@srv [/etc/filebeat]# sudo /etc/init.d/filebeat startNow it’s time to check if we are receiving inputs, and Kibana comes handy here, as we already installed it in a previous chapter. Open your browser and type the following command:
http://yourip:5601
When I access Kibana, I see the screen shown in Figure 4-10.
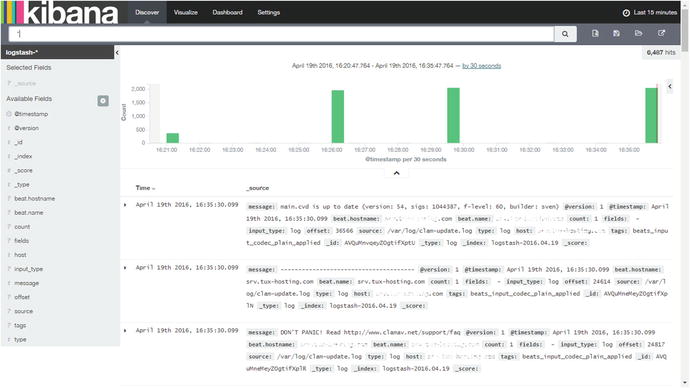
Figure 4-10. Filebeat input from the remote host to the centralized Logstash server on Kibana
If you look at the output section in Figure 4-10, you will see that it displays beat.hostname, which comes from the remote server on which we have configured Filebeat. We have successfully sent the inputs using Filebeat to our Logstash server at our centralized logging server.
Now let’s configure Filebeat to send the data to Elasticsearch directly.
Sending Data to Elasticsearch Using Filebeat
We have already seen how to send data from the remote server to our Logstash server. Sending data to Logstash works in such a way that Logstash receives the input and then forwards it to Elasticsearch, which indexes the data and sends the output to Kibana. Now we will configure Filebeat to send data to Elasticsearch only, which will remove Logstash from the chain of events.
To configure Filebeat, we first have to go to our remote server and comment out the Logstash configuration in filebeat.yml(also see Figure 4-11).
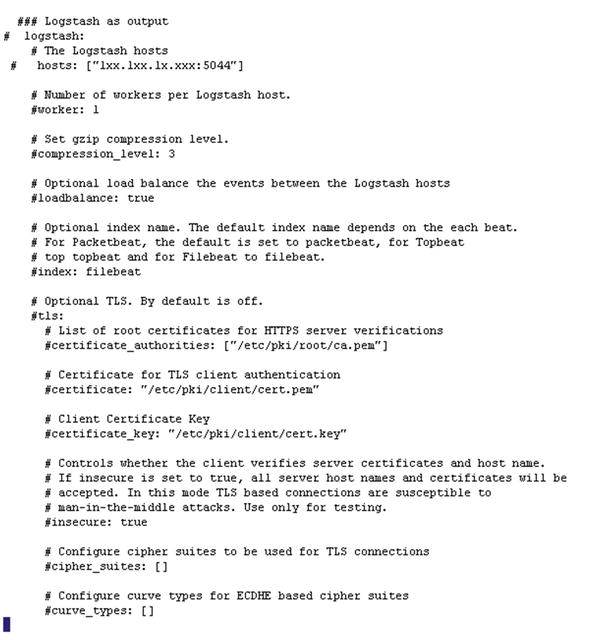
Figure 4-11. Disabling the Logstash section in filebeat.yml on remote host
### Logstash as output# logstash:# The Logstash hosts# hosts: ["1xx.1xx.1x.2xx:5044"]
Now let’s move forward and configure Filebeat to send beats to Elasticsearch. Open the Filebeat configuration file at /etc/filebeat/filebeat.yml.
vishne0@srv [/etc/filebeat]# sudo vi filebeat.yml### Elasticsearch as outputelasticsearch:# Array of hosts to connect to.# Scheme and port can be left out and will be set to the default (http and 9200)# In case you specify and additional path, the scheme is required: http://localhost:9200/path# IPv6 addresses should always be defined as: https://[2001:db8::1]:9200hosts: ["youripaddress:9200"]
In the preceding code snippet in filebeat.yml, we have the field elasticsearch: and hosts:. In the hosts section, add the IP address of your remote server.
Now we have to load the index template for Elasticsearch, in order to know what fields it’s going to analyze and how. Fortunately, the Filebeat package installs a template for us to use. So, we will now configure the filebeat.yml file to load the template, as shown in Figure 4-12.
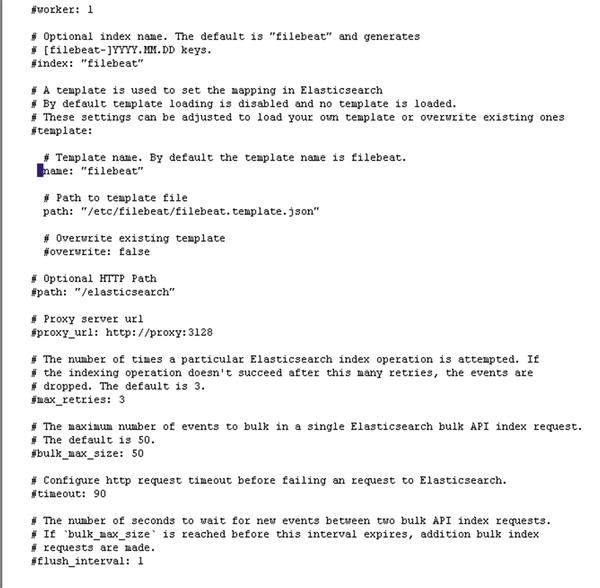
Figure 4-12. Configuring filebeat.yml to load the Filebeat template
The filebeat.template.json file resides in /etc/filebeat/. In our filebeat.yml file, we will include the path, so that Filebeat can load the template.
# A template is used to set the mapping in Elasticsearch# By default template loading is disabled and no template is loaded.# These settings can be adjusted to load your own template or overwrite existing ones template:# Template name. By default the template name is filebeat.name: "filebeat"# Path to template filepath: "filebeat.template.json"
We will keep the default name of the template as filebeat. Next, press Esc and then :wq, to save and exit from the vi editor. Let’s restart Filebeat to apply changes with the following command:
vishne0@srv [/etc/filebeat]# sudo service filebeat restartNext, we have to make some changes in the Elasticsearch configuration on our centralized logging server. In Chapter 2, we configured Elasticsearch to run on our localhost. However, for Filebeat to send inputs to Elasticsearch from a remote server, we have to run Elasticsearch on a public IP , as shown in Figure 4-13.
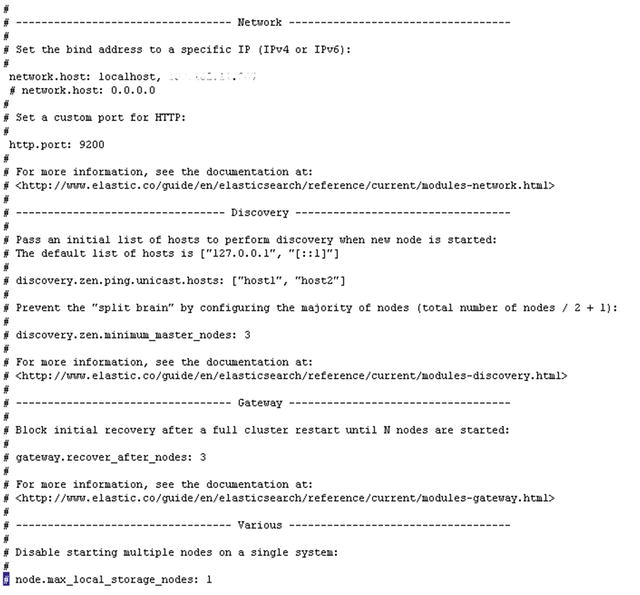
Figure 4-13. Configuring Elasticsearch to run on a public IP
First, let’s make a small change in our Elasticsearch configuration. Open /etc/elasticsearch/elasticsearch.yml.
[vishne0@centylog /]$ sudo vi /etc/elasticsearch/elasticsearch.ymlNext, we will go to the Network section of the configuration file.
We will now add our public IP to the network host, with the following command:
network.host: localhost, 0.0.0.0Press Esc and then :wq to save the file. Once you have exited, restart Elasticsearch as follows:
[vishne0@centylog /]$ sudo /etc/init.d/elasticsearch restartNext, let’s check to see if Elasticsearch is running on our public IP (see Figure 4-14).
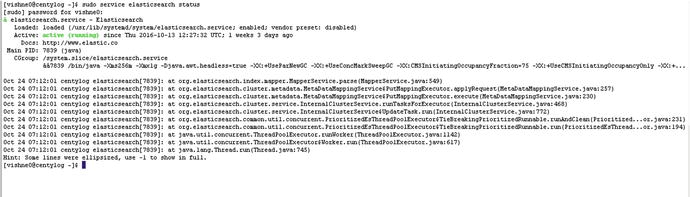
Figure 4-14. Elasticsearch is running on the public IP as well as on localhost
[vishne0@centylog elasticsearch]$ netstat -lntp | grep 9200We can see in Figure 4-14 that Elasticsearch is running on port 9200, both on our public IP and localhost. Now let’s see if the input is coming to Elasticsearch from Filebeat (see Figure 4-15).
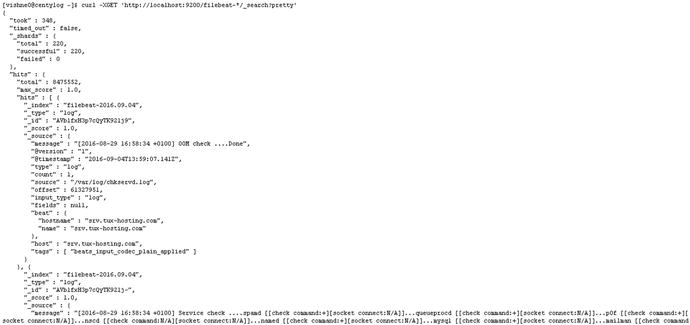
Figure 4-15. Elasticsearch indexing the input from a remote server using Filebeat
[vishne0@centylog elasticsearch]$ curl -XGET 'http://yourpublicip:9200/filebeat-*/_search?pretty'There we go. It’s working and indexing the input from the remote server, using Filebeat. Now it’s time to see the details in Kibana. Open your browser and run the Kibana console, by typing http://yourip.5601. Once the console is open, go to Settings ➤ Indices and create a new filebeat-* index pattern , as shown in Figure 4-16.
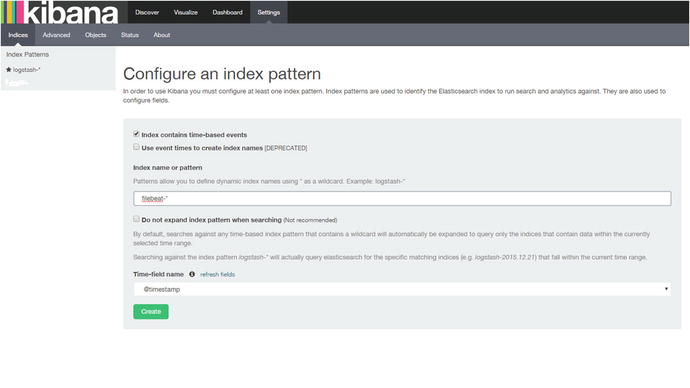
Figure 4-16. Creating new filebeat-* index pattern
Once we type filebeat-* and press Enter, it will display @timestamp in the Time-field name field. Now just click Create. After that, it will show all the fields of the filebeat-* index (see Figure 4-17).
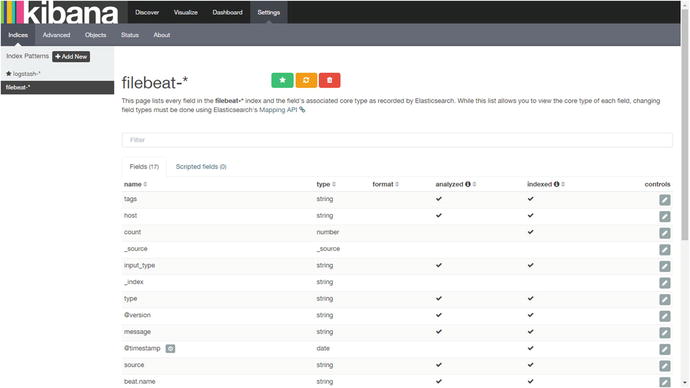
Figure 4-17. Showing fields in the filebeat-* index
Now click Discover at the top left. You will go to the dashboard where you can see below the search box the index pattern we have created in Chapter 2, with the name logstash-*. Click the drop-down icon next to it, and you will see our new filebeat-* index pattern (see Figure 4-18).
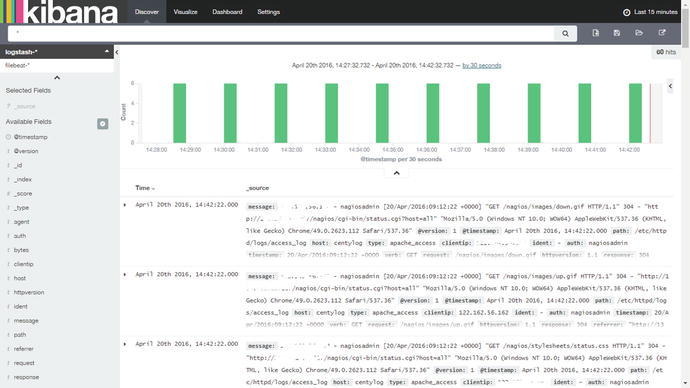
Figure 4-18. Index patterns displayed
Click filebeat-*, and you will see the screen shown in Figure 4-19.
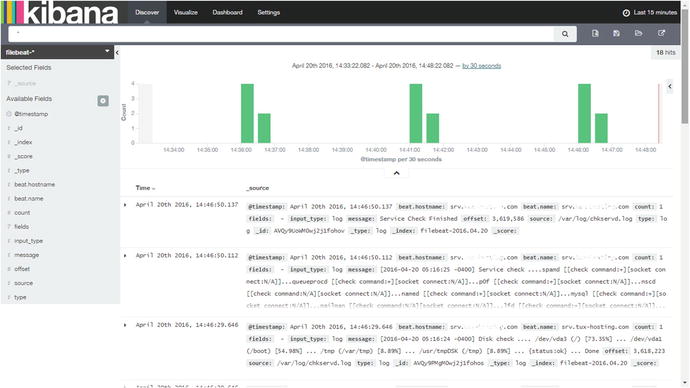
Figure 4-19. Output of filebeat-*
We have now configured the ELK Stack to receive input from remote servers using Filebeat. We can also send the input to Logstash first and then have Logstash send it to Elasticsearch for indexing, or we can send the input directly to Elasticsearch.
Filebeat CLI Flags
You should always check the options that an application provides. Table 4-1 provides a list of all the command-line interface (CLI) flags that Filebeat provides. You can use the --help option, as shown here, to view the CLI flags.
Table 4-1. Filebeat CLI Flags
Options | Summary |
|---|---|
-N | Disable actual publishing for testing |
-c string | Configuration file (default /root/filebeat.yml) |
-configtest | Test configuration and exit |
-cpuprofile string | Write CPU profile to file |
-d string | Enable certain debug selectors |
-e | Log to stderr and disable syslog/file output |
-httpprof string | Start pprof HTTP server |
-memprofile string | Write memory profile to this file |
-v | Log at INFO level |
-version | Print version and exit |
vishne0@srv [/root]# sudo filebeat --helpSummary
In this chapter, you learned how to install Filebeat on CentOS 7 and Ubuntu servers. I have also taught you how Filebeat can be configured with Logstash and Elasticsearch. You also learned how to do the following:
Install Filebeat on remote server
Configure Filebeat to send inputs to Logstash
Configure Filebeat to send inputs to Elsticsearch
Configure Kibana to show the indexes from a remote server
In next chapter, you will see how to send inputs from different services, such as Apache, MySQL, e-mail server, Syslog, SSH log, and so on, from a remote server to an ELK Stack.