
In the previous chapter, you configured Graphite with Logstash to access time-based data and graphs to compare results. It’s also a good configuration for server admins to use to view and analyze the performance of services and applications.
Over the last few years, however, server admins had to work toward making servers and applications more secure. To accomplish this, they often looked for new ways to receive notifications or alerts. Configuring the ELK Stack makes server admins’ lives a lot easier, because they can monitor logs from different servers at a centralized location and analyze them as well.
However, if more information is required, you’ll want to trace the incidents on your servers. You’ll want to have notifications and alerts sent to you for any suspicious activity. In addition, you may also want to see notifications and alerts about the health of your server, server load, storage space left on the device, and so forth. To achieve this, an excellent plug-in for Elasticsearch is available: Elasticsearch Watcher. With the Watcher API, you can create, manage, and check your “watches.”
Watcher is a commercial product, and you can get a 30-day trial license. It’s recommended that you use it on your production servers, to implement a proper alerting system.
We will now install and configure Watcher.
Installing Watcher on CentOS 7
As you have already installed Elasticsearch on the server, you only have to install the plug-in now. By default, the Elasticsearch installation directory is /usr/share/elasticsearch/. Let’s change the directory.
[vishne0@centylog /]$ cd /usr/share/elasticsearch/Next, you will install the license and plug-in.
[vishne0@centylog elasticsearch]$ sudo bin/plugin install license-> Installing license...Trying https://download.elastic.co/elasticsearch/release/org/elasticsearch/plugin/license/2.4.0/license-2.4.0.zip ...Downloading .......DONEVerifying https://download.elastic.co/elasticsearch/release/org/elasticsearch/plugin/license/2.4.0/license-2.4.0.zip checksums if available ...Downloading .DONE
The license is now installed. Next, let’s install the Watcher plug-in.
[vishne0@centylog elasticsearch]$ sudo bin/plugin install watcher-> Installing watcher...Trying https://download.elastic.co/elasticsearch/release/org/elasticsearch/plugin/watcher/2.4.0/watcher-2.4.0.zip ...Downloading ...............................................................................................DONEVerifying https://download.elastic.co/elasticsearch/release/org/elasticsearch/plugin/watcher/2.4.0/watcher-2.4.0.zip checksums if available ...Downloading. DONE@@@@@@@@@@@@@@@@@@@@@@@@@@@@@@@@@@@@@@@@@@@@@@@@@@@@@@@@@@@@ WARNING: plugin requires additional permissions @@@@@@@@@@@@@@@@@@@@@@@@@@@@@@@@@@@@@@@@@@@@@@@@@@@@@@@@@@@@* java.lang.RuntimePermission getClassLoader* java.lang.RuntimePermission setContextClassLoader* java.lang.RuntimePermission setFactorySee http://docs.oracle.com/javase/8/docs/technotes/guides/security/permissions.htmlfor descriptions of what these permissions allow and the associated risks.
You must answer “yes” to the preceding warning, as the Watcher plug-in requires these permissions in order to work properly.
Continue with installation? [y/N]yInstalled watcher into /usr/share/elasticsearch/plugins/watcher
The Watcher plug-in is now installed on your server. Restart Elasticsearch.
[vishne0@centylog elasticsearch]$ sudo service elasticsearch restartTo test if Watcher is working, run the following commands:
[vishne0@centylog elasticsearch]$ curl -XGET 'http://localhost:9200/_watcher/stats?pretty'{"watcher_state" : "started","watch_count" : 0,"execution_thread_pool" : {"queue_size" : 0,"max_size" : 0},"manually_stopped" : false}
As shown in Figure 7-1, the plug-in is working and showing you the output as well. Let’s view the output.
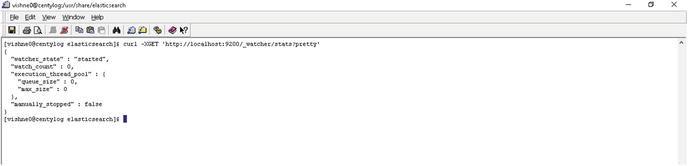
Figure 7-1. Testing Watcher installation
There are two things on which you need to focus: watch_count and execution_thread_pool. watch_count has a value of 0, and execution_thread_pool is empty, because we didn’t set up any watches yet, but that’s OK.
Remember: The trial version of Watcher is valid for 30 days, and you can use all the features. After 30 days, you must buy a subscription in order to use it.
Installing Watcher on Ubuntu 16.04.1 LTS
Installing Watcher on an Ubuntu 16.04.1 LTS machine is similar to installing Watcher on CentOS 7. You have to run the following commands:
vishne0@Ubuntu:∼# cd /usr/share/elasticsearch/vishne0@Ubuntu:∼# /usr/share/elasticsearch$ sudo bin/plugin install license-> Installing license...Trying https://download.elastic.co/elasticsearch/release/org/elasticsearch/plugin/license/2.4.0/license-2.4.0.zip ...Downloading .......DONEVerifying https://download.elastic.co/elasticsearch/release/org/elasticsearch/plugin/license/2.4.0 /license-2.4.0.zip checksums if available ...Downloading .DONEInstalled license into /usr/share/elasticsearch/plugins/licenseInstalling Watcher plugin:vishne0@Ubuntu:∼ # /usr/share/elasticsearch$ sudo bin/plugin install watcher-> Installing watcher...Trying https://download.elastic.co/elasticsearch/release/org/elasticsearch/plugin/watcher/2.4.0/watcher-2.4.0.zip ...Downloading ...............................................................................................DONEVerifying https://download.elastic.co/elasticsearch/release/org/elasticsearch/plugin/watcher/2.4.0/watcher-2.4.0.zip checksums if available ...Downloading .DONE@@@@@@@@@@@@@@@@@@@@@@@@@@@@@@@@@@@@@@@@@@@@@@@@@@@@@@@@@@@@ WARNING: plugin requires additional permissions @@@@@@@@@@@@@@@@@@@@@@@@@@@@@@@@@@@@@@@@@@@@@@@@@@@@@@@@@@@@* java.lang.RuntimePermission getClassLoader* java.lang.RuntimePermission setContextClassLoader* java.lang.RuntimePermission setFactorySee http://docs.oracle.com/javase/8/docs/technotes/guides/security/permissions.htmlfor descriptions of what these permissions allow and the associated risks.Continue with installation? [y/N]yInstalled watcher into /usr/share/elasticsearch/plugins/watcher
Watcher is now installed. Next, restart Elasticsearch and test Watcher.
vishne0@Ubuntu:∼# /usr/share/elasticsearch$ sudo service elasticsearch restartTo test whether Watcher is working, run the following commands:
vishne0@Ubuntu:∼# curl -XGET 'http://localhost:9200/_watcher/stats?pretty'{"watcher_state" : "started","watch_count" : 0,"execution_thread_pool" : {"queue_size" : 0,"max_size" : 0},"manually_stopped" : false}
Watcher is installed properly on our Ubuntu 16.04.1 LTS server. As explained previously, the watch_count has a value of 0, and execution_thread_pool is empty, as you haven’t configured any watches yet.
Configuring Watches for Logs
Configuring a watch to check logs in a given time period is easy. The main components that you should have in your watch are scheduling, condition, and action. Scheduling is important for checking logs periodically for events. Condition is added to see if there are any alerts. If your watch finds an alert, you should have defined an action to be taken, such as sending an e-mail, and so forth.
Let’s configure a watch using these three components. In Chapter 1, we created an index named Logstash. Let’s use that index in our watch. The following watch will search the Logstash index for errors every 15 seconds. Use curl to call the Watcher API.
[vishne0@centylog]$curl -XPUT 'http://localhost:9200/_watcher/watch/logstash_watch' -d '{"trigger" : {"schedule" : { "interval" : "15s" }},"input" : {"search" : {"request" : {"indices" : [ "logstash" ],"body" : {"query" : {"match" : { "message": "error" }}}}}}},"condition" : {"compare" : { "ctx.payload.hits.total" : { "gt" : 0 }}}},"actions" : {"log_error" : {"logging" : {"text" : "Found {{ctx.payload.hits.total}} errors in the logs"}}}}'
When you run this code, it should produce the following message:
{"_id":"logstash_watch","_version":1,"created":true}This means that your watch is created and running. Now let’s see what the preceding code is actually doing.
You can schedule a control to check how often a watch should be triggered. The code "schedule" : {"interval" : "15s"}" is a trigger that will execute every 15 seconds. The input will get the data to evaluate and use search, so that a watch can search for the data in your logs.
You have added a condition to see if any error is found in the logs. The code "condition" : {"compare" : {"ctx.payload.hits.total" : {"gt" : 0 }} is added to check it. The parameter compare lets us compare the values.
Another important step is to add an action. You have configured a watch to make sure that you receive alerts or notifications of events. The parameter "actions" defines what action is needed once the condition is met. You can send an e-mail or write the error into a file. The code "actions" : { "log_error" : { "logging" : { "text" : "Found {{ctx.payload.hits.total}} errors in the logs" is sending the message to Elasticsearch whenever it finds an error.
To check it, let’s run another command that was run in an earlier section:
[vishne0@centylog]$ curl -XGET 'http://localhost:9200/_watcher/stats?pretty'And the output is:{"watcher_state" : "started","watch_count" : 1,"execution_thread_pool" : {"queue_size" : 0,"max_size" : 5},"manually_stopped" : false}
As you can see clearly, the watch_count is now 1, which means that the watch has been created and will be monitoring the Logstash index every 15 seconds. All three conditions are included in the preceding code. You will see more examples in upcoming sections, which will help you understand more about defining actions when an error is detected.
Now delete the watch that you’ve created that checks the index every 15 seconds, as we will do a more realistic configuration next, and it will create more issues. To delete a watch, issue the following command:
[vishne0@centylog]$ curl -XDELETE 'http://localhost:9200/_watcher/watch/logstash_watch'This will delete the watch that you had created for our experiment.
Configuring Kibana for Watches
In the previous section, you learned how to create and delete watches in Elasticsearch. You will now see how we can integrate the watches with Kibana. Let’s use the same example as in the previous section, to create a watch to monitor the errors in the logs.
[vishne0@centylog /]$ curl -XPUT 'http://localhost:9200/_watcher/watch/logstash_watch' -d '{"trigger" : {"schedule" : { "interval" : "15s" }},"input" : {"search" : {"request" : {"indices" : [ "logstash" ],"body" : {"query" : {"match" : { "message": "error" }}}}}}},"condition" : {"compare" : { "ctx.payload.hits.total" : { "gt" : 0 }}}},"actions" : {"log_error" : {"logging" : {"text" : "Found {{ctx.payload.hits.total}} errors in the logs"}}}}'
Watcher maintains a full history of all watches, and a new history index is created daily with .watch_history-YYYY-MM.DD. Search for the index with .watch_history*.
Once you run the preceding code, open a browser and point it to http://yourip:5601. Then open Kibana, go to settings, and in the index name or pattern field, type .watch_history*. In the Time-field name, select trigger_event.triggered_time. You will see a screen similar to the one shown in Figure 7-2.
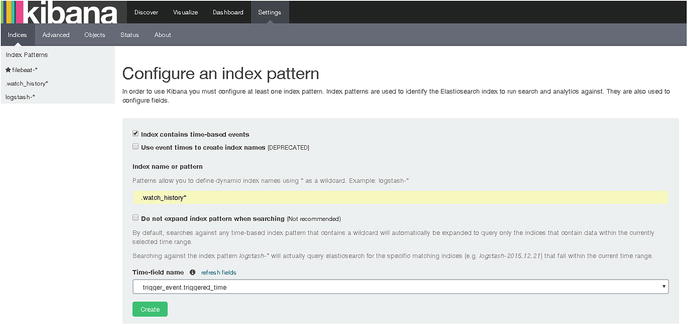
Figure 7-2. Creating an index pattern for watches in Kibana
As you can see in Figure 7-2, click the Create button, and it’s done. Click the Discover tab at the top left of the screen, select the newly created Index Pattern, .watch_history*, and you will see a screen similar to the one shown in Figure 7-3.
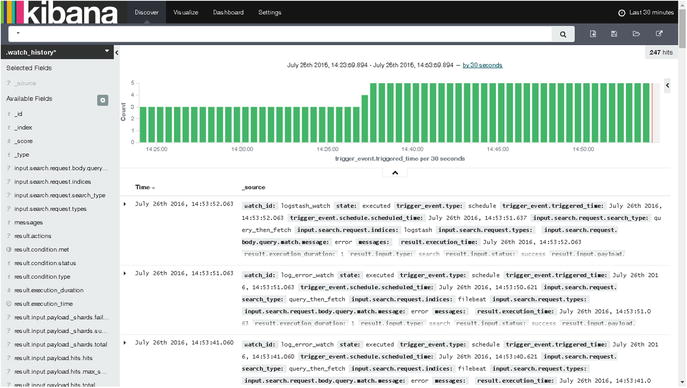
Figure 7-3. Configured watch data
Figure 7-3 shows us the result of all the configured watches on the system.
Sending Alerts to E-mail
You can configure Watcher to send alerts to an e-mail ID. Here, I am going to talk about configuring a Gmail account only. In your Watcher JSON, you have to add the following code:
"actions": {"email_admin": {"email": {"to": "'Admin <[email protected] >'","subject": "{{ctx.watch_id}} executed","body": "{{ctx.watch_id}} executed with {{ctx.payload.hits.total}} hits"}}}}
Now you have to add the following code to elasticsearch.yml. Add it to the end of the file.
watcher.actions.email.service.account:work:profile: gmailemail_defaults:from: 'Admin <[email protected]>'bcc: [email protected]smtp:auth: truestarttls.enable: truehost: smtp.gmail.comport: 587user: <username>password: <password>
That’s it. Now you can receive notifications in your Gmail account.
Configuring Sense Editor
Thus far, you have been creating watches using the command line. Though it’s OK to create watches from the command line, it would be better if you had an editor to write your code and run it simultaneously. To achieve this, install Sense Editor, with which you can type and submit requests to Elasticsearch and also run it using the Sense Editor console.
Installing Sense Editor
Sense Editor is a Kibana app. As you already have Kibana installed, all you have to do is to go to the bin directory of Kibana and install the plug-in. The installation process is the same both for CentOS 7 and Ubuntu 16.04.1 LTS.
[vishne0@centylog /]$ cd /opt/kibana/[vishne0@centylog kibana]$ sudo ./bin/kibana plugin --install elastic/sense
As shown in Figure 7-4, the Sense Editor is installed properly.
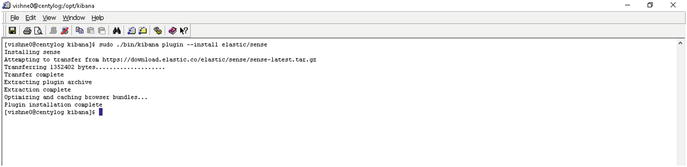
Figure 7-4. Installing the Sense Editor for Kibana
To open the Sense Editor, open a browser and point it to http://yourip:5601/app/sense. You will be greeted with a screen similar to that shown in Figure 7-5.

Figure 7-5. Sense Editor opening screen
Next, click the Get to work button, and you will see a screen similar to that shown in Figure 7-6.
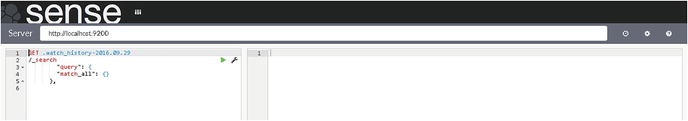
Figure 7-6. Sense Editor showing two panes
As you can see in Figure 7-6, the Sense Editor shows two panes. The pane on the left is the editor in which you will enter your code to submit to Elasticsearch and to create the watches. The right pane displays the responses from Elasticsearch. In previous sections, you have submitted your code to Elasticsearch from the command line. Next, you will submit your code to Elasticsearch using Sense app, and you will see the response as well.
Here, I have written the code to search the .watch_history index with the date:
GET .watch_history-2016.09.29/_search"query": {"match_all": {}},
Just click the green button next to _search on the right side. Once you click the button, you will see the following response from Elasticsearch. As you can see in Figure 7-7, Elasticsearch shows the response to the code you have written in Sense. The output pane is showing us the result of the .watch_history-YYYY-MM-DD search.

Figure 7-7. The reponse from Elasticsearch
You can write watches in the Sense Editor and see the response as well. Sense takes the commands in curl-like syntax, as we ran the watches code using the Linux command line.
Creating an Index Using Sense
You can easily create an index using Sense. For example, see the following:
PUT /apache_error?pretty=true{"acknowledged": true}
When you run this code from the Sense Editor, Elasticsearch will create an index.
Listing Watches
You can list all of your watches stored in .watches index. Using Sense Editor, you can search all the configured watches (Figure 7-8).
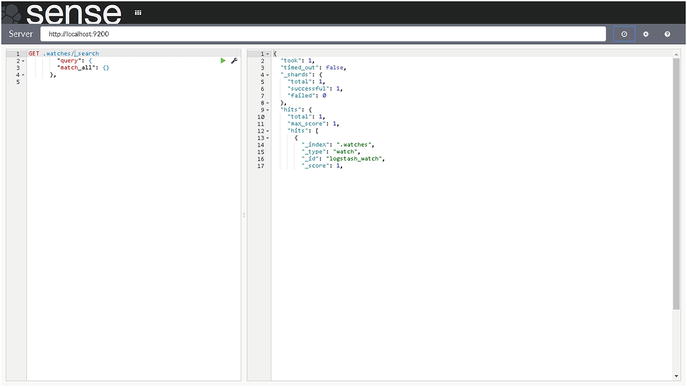
Figure 7-8. A search for configured watches
As you can see in Figure 7-8, the watches that you have configured are shown. Thus far, only watch is configured.
Deleting Watches
You can delete watches permanently, using Sense or from the command line, as follows:
[vishne0@centylog /]$curl -XDELETE 'http://localhost:9200/_watcher/watch/logstash_watch'From SenseDELETE _watcher/watch/logstash_watch
Sense Editor History
You can check history with the Sense Editor UI, by clicking the Clock button next to the server field in the upper-right corner of the screen. Once you click the Clock button, we will see a screen similar to that shown in Figure 7-9.
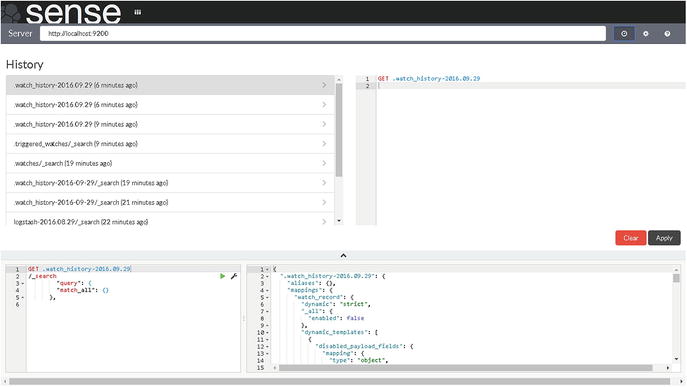
Figure 7-9. Sense Editor history
Sense can show as many as the last 500 requests made to Elasticsearch.
Sense Editor Settings
Next to history, you will see a Settings button. From there, you can check and apply the Settings options provided by Sense. Once you click the Settings button, you will see a screen similar to that shown in Figure 7-10.

Figure 7-10. Settings section of the Sense UI
The Settings screen provides a few options. They are:
Font Size: You can adjust font size with this option.
Wrap long lines: Use this to wrap long outputs.
Autocomplete: This is an interesting option, and you should enable both the Fields and Indexes and the Aliases options. When you write your code in Sense Editor, autocomplete helps to see which Fields are there. Autocomplete for Indexes and Aliases helps you to quickly select the correct ones, as many might be saved.
Sense Editor Help
Help appears next to the Settings button. Click it, and you will see a screen similar to that shown in Figure 7-11. There are two tabs on this screen:
Request format: This shows how you can write the code in Sense Editor.
Keyboard tips: These are keys that you can use in the editor.
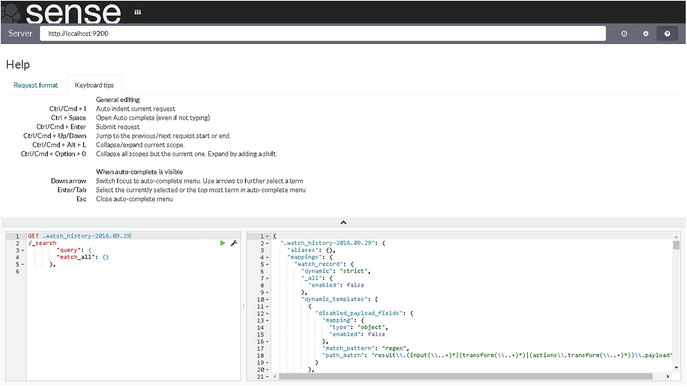
Figure 7-11. Sense Editor Help screen
Summary
In this chapter, you installed the Watcher and Sense Editor plug-ins on CentOS 7 and Ubuntu 16.04.1 TLS. You successfully configured Watcher, and you were able to see the output using Kibana. You also installed a Kibana app called Sense Editor, to run inside Kibana and to send code inputs to Elasticsearch. You also learned about Sense UI and how to do following:
Check history in the Sense UI
Adjust Settings in the Sense UI
View the Help section in the Sense UI
In next chapter, you will learn how to secure a cluster, using the Shield plug-in for Elasticsearch. I will be covering the following topics:
How to prevent unauthorized access
How to protect the integrity of the data
How to audit your data