
In earlier chapters, we installed Logstash and Elasticsearch successfully. Searching logs manually in Logstash can be a bit of a tedious process for beginners. We need something with which we can search our logs easily and quickly. And now we have a tool that works with Elasticsearch to allow us to do just that—Kibana.
Kibana is an open source web interface tool for Elasticsearch. We can access it with your browser. Kibana is an excellent tool for visualizing data in the form of charts, graphs, maps, and tables. So, when all we need is something that is pleasing to the eye and simple to understand as well, Kibana is the perfect choice.
We can search logs to check screens for, say, high loads on some of our nodes, or perhaps failed login attempts on SSH. Kibana provides various screens on which we can search, filter, and submit queries as well as view visual aspects, such as traffic peaks on a web site at a given time of day.
Installing Kibana is very simple. It doesn’t require any coding or too many changes to configuration files to make it work.
Now let’s move on and install Kibana on CentOS 7 and Ubuntu 16.04.1 LTS machines. For now, we do not require anything other than Elasticsearch, which we have already installed.
Installing Kibana on CentOS 7
Let’s now install Kibana on CentOS 7, using yum. First, we will create a repo for Kibana, as shown in Figure 3-1.
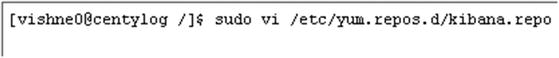
Figure 3-1. Creating a repository in CentOS 7
[vishne0@centylog /]$ sudo vi /etc/yum.repos.d/kibana.repoNext, we will write the following code in our new repo to get the package, using yum (see Figure 3-2).
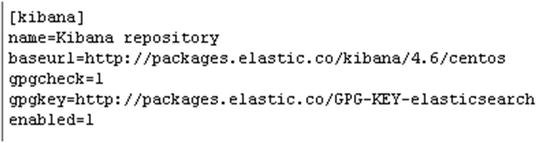
Figure 3-2. Writing code for our new Kibana repository
[kibana]name=Kibana Repobaseurl=http://packages.elastic.co/kibana/4.6/centosgpgcheck=1gpgkey=http://packages.elastic.co/GPG-KEY-elasticsearchenabled=1
As we have now created our repo, we will install Kibana using yum. Type the following command into your terminal window and press Enter (see Figure 3-3).
Figure 3-3. Installing Kibana
[vishne0@centylog /]$ sudo yum install kibanaOnce you press Enter, yum will install Kibana (see Figure 3-4).
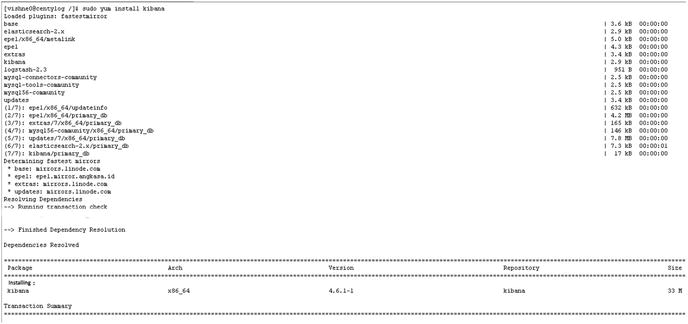
Figure 3-4. Kibana installed, using yum on CentOS 7
As you see in Figure 3-4, Kibana is now installed on our CentOS 7 machine, and we will add the following code, so that it starts automatically on booting up.
On the CentOS 7 terminal window, type the following command and press Enter.
[vishne0@centylog]$ sudo chkconfig --add kibanaKibana is now added to our init system. Now let’s check our installation, to make sure that we start Kibana (see Figure 3-5).
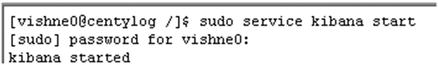
Figure 3-5. Starting Kibana
[vishne0@centylog /]$ sudo service kibana start[sudo] password for vishne0:kibana started
Kibana is now running. By default, it listens on localhost only on port 5601. To access the dashboard on port 5601, add the port to the firewall.
[vishne0@centylog /]$ firewall-cmd --zone=dmz --add-port=5601/tcpWe have opened port 5601. Start the web browser and open the following URL:
http://localhost:5601
In my case, I have set it up so that I will access it using my public IP (see Figure 3-6).
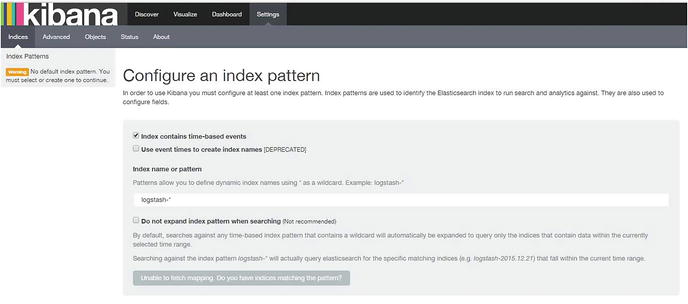
Figure 3-6. Accessing the Kibana interface
http://myip:5601
Hurray! Our installation is successful, and Kibana is running. We will configure it and make it work in a subsequent section of this chapter.
Installing Kibana on Ubuntu 16.04.1 LTS
Let’s now install Kibana on Ubuntu 16.04.1. We will add the repository for Kibana to our Ubuntu system, as follows (see also Figure 3-7):
Figure 3-7. Creating a repository for Kibana in Ubuntu 16.04.1
vishne0@Ubuntu:∼$ echo "deb http://packages.elastic.co/kibana/4.6/debian stable main" | sudo tee -a /etc/apt/sources.list.d/kibana.listAs we have now added the Kibana repo, we will install it using apt-get on Ubuntu. First, we will update the repository with the following command (see Figure 3-8):

Figure 3-8. Updating the Ubuntu 16.04.1 repository
vishne0@Ubuntu:∼$ sudo apt-get updateOur repository is updated, and now it’s the time to install Kibana on our Ubuntu machine, using the following command (see Figure 3-9):
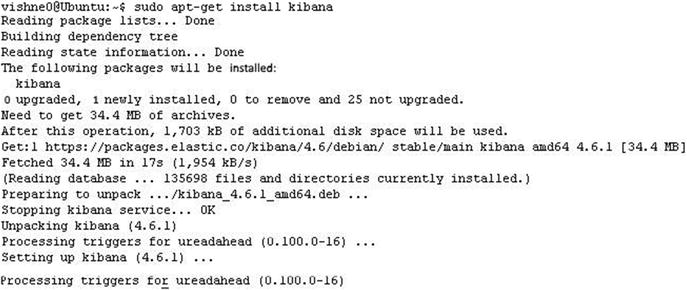
Figure 3-9. Installing Kibana on Ubuntu 16.04.1
vishne0@Ubuntu:∼$ sudo apt-get install kibanaNow that Kibana is installed on your machine, you have to add the following command, so that it starts automatically on booting up (see Figure 3-10):
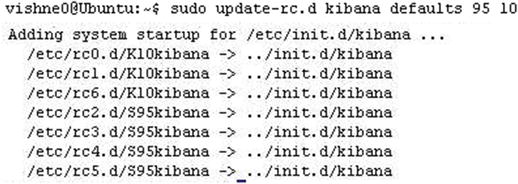
Figure 3-10. Adding Kibana to boot
vishne0@Ubuntu:∼$ sudo update-rc.d kibana defaults 95 10OK. It’s time to test our installation, as we did previously for our CentOS 7 machine. Again, by default, Kibana is accessible from localhost on port 5601 by typing the following command into your web browser:
http://localhost:5601 In my case, I will access it using my public IP (see Figure 3-11).
Figure 3-11. Starting Kibana on Ubuntu 16.04.1
http://myip:5601
Before accessing it from your browser, you have to start it on your system, so type the following command into your terminal (see Figure 3-11):
vishne0@Ubuntu:∼$ sudo service kibana startIt has started and is now running on default port 5601. Open your browser and type http://localhost:5601 or, on your IP, http://myip:5601.
On my Ubuntu system, I see the screen shown in Figure 3-12, as we saw earlier on the CentOS 7 system.
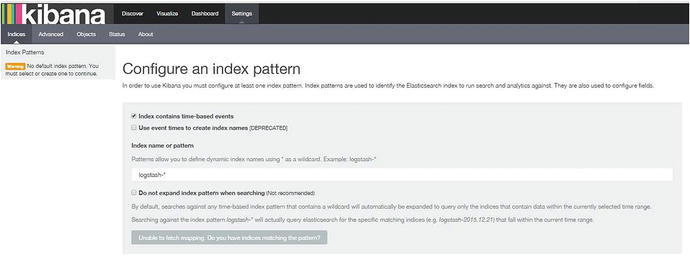
Figure 3-12. Accessing the Kibana interface on Ubuntu 16.04.1
One important thing to note here is that we have opened port 5601 on our firewall. If we are on a public IP, this will result in a security issue. Kibana itself doesn’t come with an authentication method. To secure Kibana, you have to use a reverse proxy such as Nginx or skip to Chapter 8 to read more about how to secure the ELK Stack.
Configuring Kibana with Logstash and Elasticsearch
Now that Kibana is installed, let’s move forward to see what screens it provides. Let’s also configure it with Elasticsearch, to see some demo data.
I have Apache installed on my server, and I will get some sample data from the Apache log to show you how Kibana works. Make sure that Logstash, Elasticsearch, and Kibana are all running.
First, I will create a sample configuration file for Apache logs with the following command (see Figure 3-13):
Figure 3-13. Creating a sample configuration file for Kibana
[vishne0@centylog /]$ sudo vi /etc/logstash/conf.d/01-webserver.confI will then include the following code in our configuration file (see Figure 3-14). (I will not explain the configuration file here, as you will learn about it in the next chapter.)
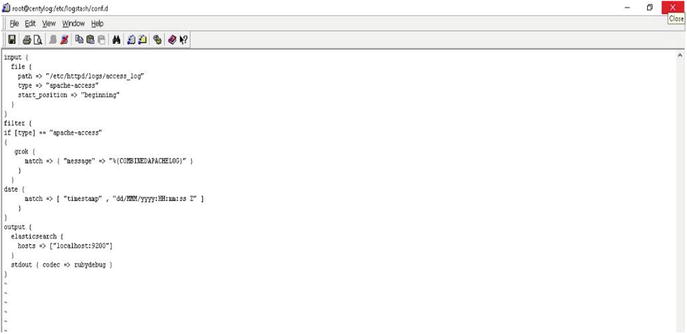
Figure 3-14. Logstash configuration file for Apache access log
input {file {path => "/var/httpd/logs/access_log"start_position => "beginning"}}filter {if [type] == "apache-access"{grok {match => { "message" => "%{COMBINEDAPACHELOG}" }}}date {match => [ "timestamp" , "dd/MMM/yyyy:HH:mm:ss Z" ]}}output {elasticsearch {hosts => ["localhost:9200"]}stdout { codec => rubydebug }}
Now I will run Logstash to generate the index (see Figure 3-15).
Figure 3-15. Restarting Logstash to generate the index
[vishne0@centylog /]$sudo service logstash startNow I open another terminal screen, and issue the following command (see Figure 3-16).
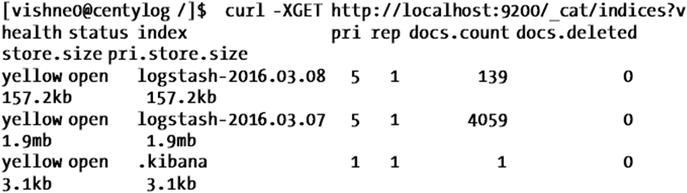
Figure 3-16.
[vishne0@centylog /]$ curl -XGET http://localhost:9200/_cat/indices?vhealth status index pri rep docs.count docs.deleted store.size pri.store.sizeyellow open logstash-2016.03.08 5 1 139 0 157.2kb 157.2kbyellow open logstash-2016.03.07 5 1 4059 0 1.9mb 1.9mbyellow open .kibana 1 1 1 0 3.1kb 3.1kb
You will see the preceding output shown in Figure 3-16. You can see the two indexes that I created with Logstash. You will see that the Logstash indexes are in the format of YYY-MM-DD. After the indexes are created, go to your browser with Kibana open and type logstash-* to match your index pattern. Keep it that way, and press Enter once it’s done. In the other dialog box, you will see the Time-field name, where it will show @timestamp (see Figure 3-17).
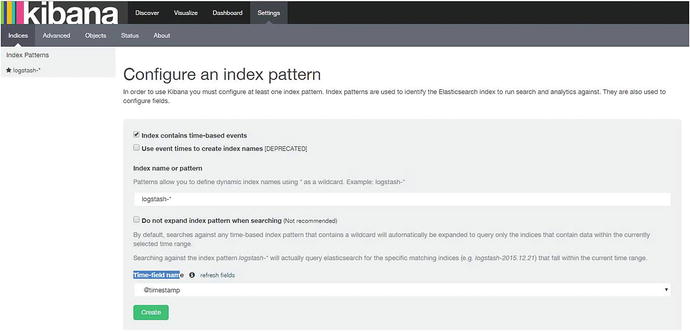
Figure 3-17. Creating an index pattern on the Kibana interface
Now click Create, and the screen shown in Figure 3-18 will appear.
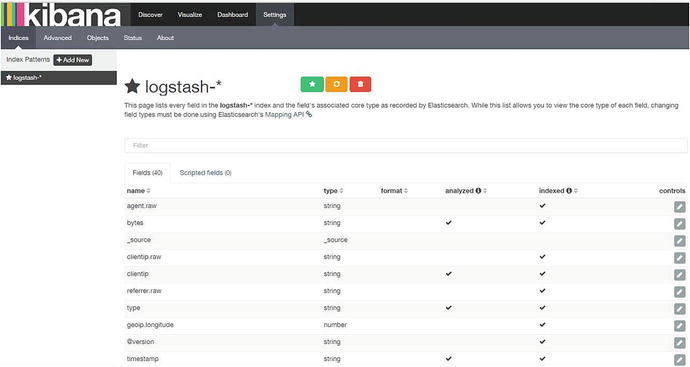
Figure 3-18. Indexed fields and associated core type , as recorded by Elasticsearch
Now all of the fields of the index file are displayed.
Next, let’s see what Kibana screens are available. If you click Discover at the top left, you will see a screen similar to the one shown in Figure 3-19.
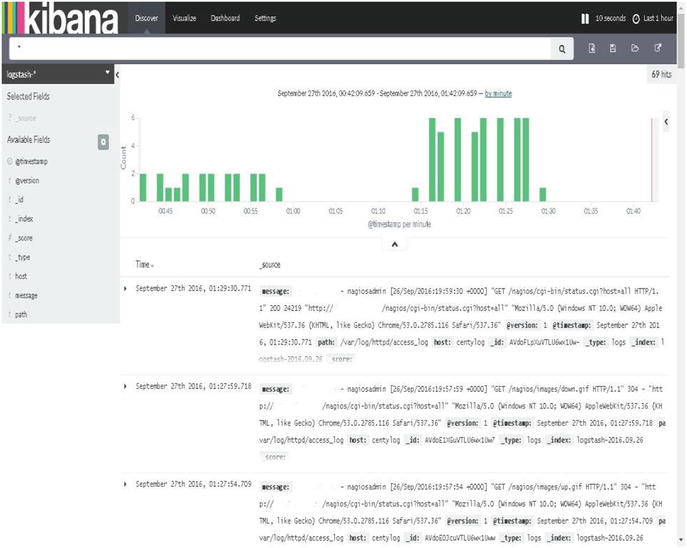
Figure 3-19. Kibana interface showing a data graph
You see the histograms here and the data from the access_log, as configured in 01-webserver.conf.
You can submit your search here and see the results. For example, you are looking at the data of the Apache access_log, so you can search for the code 200. In the Search box, type 200 and press Enter, and you will see the result.
At right side of the Search box, you have a few options, such as New search, Save search, Load a saved search, and Share a search.
Kibana Visualize
Once you are logged into the Kibana dashboard, just after the Discover tab, there is a tab for Visualize. Kibana supports different types of visualization methods (see Table 3-1), which you can use for your data. Click the Visualize tab, and a screen similar to the one shown in Figure 3-20 will open.
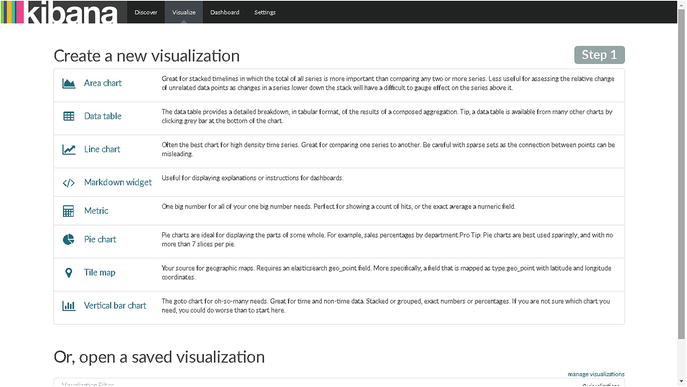
Figure 3-20. Kibana Visualize
Table 3-1. Kibana Visualization Types
Area chart | Use area charts to visualize the total contribution of several different series. |
Data table | Use data tables to display the raw data of a composed aggregation. You can display the data table for several other visualizations by clicking at the bottom of the visualization. |
Line chart | Use line charts to compare different series. |
Markdown widget | Use the markdown widget to display free-form information or instructions about your dashboard. |
Metric | Use the metric visualization to display a single number on your dashboard. |
Pie chart | Use pie charts to display each source’s contribution to a total. |
Tile map | Use tile maps to associate the results of an aggregation with geographic points. |
Vertical bar chart | Use vertical bar charts as a general-purpose chart. |
You can also enable auto-refresh for the page with the latest data. To enable auto-refresh, click the clock icon at the top right, and you will see a screen with time intervals similar to those seen in Figure 3-21.

Figure 3-21. Options for timed intervals
Here, at the top right, you can see the auto-refresh option. If you click that, you will see the auto-refresh timed intervals. I have selected the option of 10 seconds (Figure 3-22). So now, my page will auto-refresh every 10 seconds, with a new set of data coming from the indexes I have created.

Figure 3-22. Timed intervals for auto-refresh option
Kibana Plug-ins
Kibana has a lot of plug-ins for additional functionality. To see the list of the installed plug-ins, change the directory to /opt/kibana.
[vishne0@centylog /]$ cd /opt/kibana/Once you are inside the directory, issue the following command:
[vishne0@centylog kibana]$ sudo bin/kibana plugin –listIn this case, no plug-ins were installed, so there is no list. To add plug-ins, simply run the following command:
[vishne0@centylog kibana]$ [vishne0@centylog kibana]$ bin/kibana plugin -i <org>/<package>/<version>Here, org refers to organization, so if you want to install all the plug-ins from Elasticsearch, you install these with the following command (see Figure 3-23):
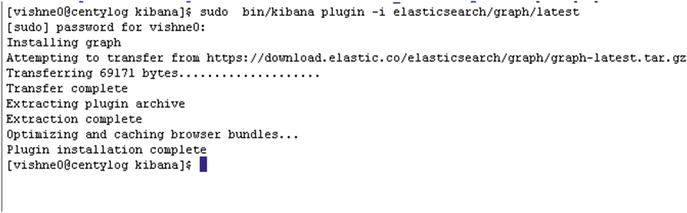
Figure 3-23. Installing plug-ins for Kibana
[vishne0@centylog kibana]$ sudo bin/kibana plugin -i elasticsearch/graph/latestAs shown in Figure 3-23, the plug-in Graphs from Elasticsearch is installed. We can install the plug-in from a URL as well:
[vishne0@centylog kibana]$ sudo bin/kibana plugin -i pluginname -u urlWe can check a list of all available plug-ins at: https://github.com/elastic/kibana/wiki/Known-Plugins .
Removing Plug-ins
We can remove a plug-in by running the following command:
[vishne0@centylog kibana]$ sudo bin/kibana plugin --remove graphRemoving graph...
It’s so simple isn’t it?
Updating a Plug-in
To update a plug-in in Kibana, we have to remove the existing version of plug-in first and then install the latest one.
Kibana Server Configuration
The Kibana server reads its server properties from the kibana.yml configuration file. By default, Kibana runs on port 5601, so you do not have to make many changes to the configuration file. The configuration file contents are shown in Table 3-2.
Table 3-2. Kibana Configuration Properties
server.port: | Default: 5601 Kibana is served by a back-end server. This setting specifies the port to use. |
server.host: | Default: "0.0.0.0". This setting specifies the IP address of the back-end server. |
server.basePath: | Use to specify a path to mount Kibana, if you are running behind a proxy. This setting cannot end in a slash (/). |
server.maxPayloadBytes: | Default: 1048576. The maximum payload size in bytes for incoming server requests. |
elasticsearch.url: | Default: http://localhost:9200. The URL of the Elasticsearch instance to use for all your queries. |
kibana.index: | Default: .kibana. Kibana uses an index in Elasticsearch to store saved searches, visualizations, and dashboards. Kibana creates a new index, if the index doesn’t already exist. |
kibana.defaultAppId: | Default: discover. The default application to load. |
tilemap.url: | Default: https://tiles.elastic.co/v1/default/{z}/{x}/{y}.png?elastic_tile_service_tos=agree&my_app_name=kibana . The URL to the tile service that Kibana uses to display map tiles in tilemap visualizations. |
tilemap.options.minZoom: | Default: 1. The minimum zoom level. |
tilemap.options.maxZoom: | Default: 10. The maximum zoom level. |
tilemap.options.attribution: | Default: © [Elastic Tile Service]( https://www.elastic.co/elastic-tile-service ). The map attribution string. |
tilemap.options.subdomains: | An array of subdomains used by the tile service. Specifies the position of the subdomain in the URL with the token {s}. |
elasticsearch.username: and elasticsearch.password: | If Elasticsearch is protected with basic authentication, these settings provide the username and password that the Kibana server uses to perform maintenance on the Kibana index at startup. Kibana users must still authenticate with Elasticsearch, which is proxied through the Kibana server. |
server.ssl.cert: and server.ssl.key: | Paths to the PEM-format SSL certificate and SSL key files, respectively. These files enable SSL for outgoing requests from the Kibana server to the browser. |
elasticsearch.ssl.cert: and elasticsearch.ssl.key: | Optional settings that provide the paths to the PEM-format SSL certificate and key files. These files validate that your Elasticsearch back end uses the same key files. |
elasticsearch.ssl.ca: | Optional setting that enables you to specify a path to the PEM file for the certificate authority for your Elasticsearch instance |
elasticsearch.ssl.verify: | Default: true.To disregard the validity of SSL certificates, change this setting’s value to false. |
elasticsearch.pingTimeout: | Default: The value of the elasticsearch.requestTimeout setting. Time in milliseconds to wait for Elasticsearch to respond to pings |
elasticsearch.requestTimeout: | Default: 30000. Time in milliseconds to wait for responses from the back end or Elasticsearch. This value must be a positive integer. |
elasticsearch.shardTimeout: | Default: 0. Time in milliseconds for Elasticsearch to wait for responses from shards. Set this to 0 to disable. |
pid.file: | This specifies the path where Kibana creates the process ID file. |
logging.dest: | Default: stdout. This enables you specify a file where Kibana stores log output. |
logging.filter.<key>: | Default: authorization Replace <key> with the string to filter. Set the value of this setting to remove to remove matching keys from all logged objects. Set the value of this setting sensor to replace each character in the key’s value with an X character. |
logging.silent: | Default: false. Set the value of this setting to true to suppress all logging output. |
logging.quiet: | Default: false. Set the value of this setting to true to suppress all logging output other than error messages. |
logging.verbose | Default: false. Set the value of this setting to true to log all events, including system usage information and all requests. |
status.allowAnonymous | Default: false. If authentication is enabled, setting this to true allows unauthenticated users to access the Kibana server status API and status page. |
Summary
In this chapter, you learned how to configure Kibana with Logstash and Elasticsearch. You also learned how to configure index patterns, as well as the following:
The Kibana dashboard
Kibana Visualize
How to add, remove, and update Kibana plug-ins
Kibana configuration properties
In the next chapter, you will see how to configure remote servers, to send inputs to our ELK Stack server, using Filebeat.