Even a JavaScript guru makes mistakes, even if they are just annoying typos. In particular, when code expands to hundreds of lines, the chance of something going wrong becomes much greater. In proportion, the difficulty in finding these mistakes, or bugs, also increases. In this chapter you will look at various techniques that will help you minimize the problems that arise from this situation.
You'll start by taking a look at the top seven JavaScript coding mistakes. After you know what they are, you'll be able to look out for them when writing code, hopefully, so that you won't make them so often!
Then you'll look at how you can cope with errors when they do happen, so that you prevent users from seeing your coding mistakes.
Finally, you'll look at the debugging tools in Microsoft's Internet Explorer (IE8), Firebug (an add-on for Firefox), Safari's and Chrome's Web Inspector, and Opera's Dragonfly. You'll see how you can use these tools to step through your code and check the contents of variables while the code is running, a process that enables us to hunt for difficult bugs. You'll also take a briefer look at the debugging tools available for Firefox.
There are seven common mistakes made by programmers. Some of these you'll learn to avoid as you become more experienced, but others may haunt you forever!
You'll find it very useful in this chapter if your browser is set up to show errors. You did this in Chapter 2 in the section "Setting Up Your Browser for Errors." So if you don't already have error display set up, now would be a good time to do so.
JavaScript is actually very easygoing when it comes to defining your variables before assigning values to them. For example, the following will implicitly create the new global variable abc and assign it to the value 23:
abc = 23;
Although strictly speaking, you should define the variable explicitly with the var keyword like this:
var abc = 23;
Whether or not you use the var keyword to declare a variable has a consequence of what scope the variable has; so it is always best to use the var keyword. If a variable is used before it has been defined, an error will arise. For example, the following code will cause the error shown in Figure 4-1 in IE8 if the variable abc has not been previously defined (explicitly or implicitly):
alert(abc);

In Firefox you'll need to look in the JavaScript console, which you can view by choosing Tools
In addition, you must remember that function definitions also have parameters, which if not declared correctly can lead to the same type of error.
Take a look at the following code:
function foo(parametrOne)
{
    alert(parameterOne);
}
If you call this function, you get an error message similar to the one shown in Figure 4-2.

The error here is actually a simple typo in the function definition. The first parameter has the typo: it should read parameterOne, not parametrOne. What can be confusing with this type of error is that although the browser tells us the error is on one line, the source of the error is on another line.
This is a major source of errors, particularly because it can be difficult to spot at times.
For example, spot the three case errors in the following code:
var myName = "Jeremy";
If (myName == "jeremy")
   alert(myName.toUppercase());
The first error is the if keyword; the code above has If rather than if. However, JavaScript won't tell us that the error is an incorrect use of case, but instead IE will tell us Object expected and Firefox will tell us that If is not defined. Although error messages give us some idea of what's gone wrong, they often do so in an oblique way. In this case IE thinks you are trying to use an object called an If object and Firefox thinks you are trying to use an undefined function called If.
Okay, with that error cleared up, you come to the next error, not one of JavaScript syntax, but a logic error. Remember that Jeremy does not equal jeremy in JavaScript, so myName == "jeremy" is false, even though it's quite likely that you didn't care whether the word is jeremy or jeremy. This type of error will result in no error message at all, just the code not executing as you'd planned.
The third fault is with the toUpperCase() method of the String object contained in myName. The previous code uses toUppercase, with the C in lowercase. IE will give us the message Object doesn't support this property or method and Firefox will report that myName.toUppercase is not a function. On first glance it would be easy to miss such a small mistake and start checking your JavaScript reference guide for that method. You might wonder why it's there, but your code is not working. Again, you always need to be aware of case, something that even experts get wrong from time to time.
In the following code, you define a function and then call it. However, there's a deliberate mistake. See if you can spot where it is.
function myFunction()
{
x = 1;
y = 2;
if (x <= y)
{
if (x == y)
{
alert("x equals y");
}
}
myFunction();
This is why formatting your code is important — you'll have a much easier time spotting errors such as this:
function myFunction()
{
    x = 1;
    y = 2;
    if (x <= y)
    {
       if (x == y)
       {
          alert("x equals y");
       }
    }
    myFunction();
Now you can see that the ending curly brace of the function is missing. When there are a lot of if, for, or do while statements, it's easy to have too many or too few closing braces. This type of problem is much easier to spot with formatted code.
Take a look at the following code:
if (myVariable + 12) / myOtherVariable < myString.length)
Spot the mistake? The problem is the missing parenthesis at the beginning of the condition. You want myVariable + 12 to be calculated before the division by myOtherVariable is calculated, so quite rightly you know you need to put it in parentheses.
(myVariable + 12) / myOtherVariable
However, the if statement's condition must also be in parentheses. Not only is the initial parenthesis missing, but there is one more closing parenthesis than opening parentheses. Like curly braces, each opening parenthesis must have a closing parenthesis. The following code is correct:
if ((myVariable + 12) / myOtherVariable < myString.length)
It's very easy to miss a parenthesis or have one too many when you have many opening and closing parentheses.
Consider the following code:
var myNumber = 99;
if (myNumber = 101)
{
   alert("myNumber is 101");
}
else
{
   alert("myNumber is " + myNumber);
}
You'd expect, at first glance, that the alert() method in the else part of the if statement would execute, telling us that the number in myNumber is 99, but it won't. This code makes the classic mistake of using the assignment operator (=) instead of the equality operator (==). Hence, instead of comparing myNumber with 101, this code sets myNumber to equal 101. If you program in Visual Basic, or languages like it that use only one equals sign for both comparison and assignment, you'll find that every so often this mistake crops up. It's just so easy to make.
What makes things even trickier is that no error message is raised; it is just your data and logic that will suffer. Assigning a variable a value in an if statement may be perverse, but it's perfectly legal, so there will be no complaints from JavaScript. When embedded in a large chunk of code, a mistake like this is easily overlooked. Just remember it's worth checking for this error the next time your program's logic seems crazy.
Another common error is where either you forget to put parentheses after a method with no parameters, or you use a property and do put parentheses after it.
When calling a method, you must always have parentheses following its name; otherwise, JavaScript thinks that it must be a pointer to the method or a property. For example, examine the following code:
var nowDate = new Date();
alert(nowDate.getMonth);
The first line creates an instance of the Date reference type. The second line attempts to call the getMonth() method of the newly created Date object, except the parentheses are missing. The following is the corrected code:
var nowDate = new Date();
alert(nowDate.getMonth());
Just as you should always have parentheses after a method, you should never have parentheses after a property; otherwise, JavaScript thinks you are trying to use a method of that object:
var myString = "Hello, World!";
alert(myString.length());
The second line adds parentheses after the length property, making JavaScript think it is a method. This code should have been written like the following code:
var myString = new String("Hello");
alert(myString.length);
To compound the issue, it's common for a function to be passed as a parameter to another function (or a property as you'll see in Chapter 6 when working with events). In these situations, you pass the function without the opening and closing parentheses () at the end of the function name. Take a look at the following code:
function foo()
{
    alert("I'm in foo()!").
}

function bar(fpToCall)
{
    alert("Calling passed function").
    fpToCall();
}

bar(foo);
This code defines two functions: foo() and bar(). The foo() function simply displays a message box telling the user the foo() function is currently executing. The second function, bar(), accepts one argument that is a function. It displays a message saying it's calling the passed function, and then it executes that function. The final line calls the bar() function and passes a pointer of the foo() function. A pointer is a reference to a location in memory (we'll discuss memory references in the next chapter).
As a rule of thumb, use parentheses at the end of the function name when you want to execute the function, and leave the parentheses off when passing the function to another function or property.
In the following code, there's a deliberate concatenation mistake:
var myName = "Jeremy";
var myString = "Hello";
var myOtherString = "World";
myString = myName + " said " + myString + " " myOtherString;
alert(myString);
There should be a + operator between " " and myOtherString in the fourth line of code.
Although easy to spot in just a few lines, this kind of mistake can be harder to spot in large chunks of code. Also, the error message this type of mistake causes can be misleading. Load this code into a browser and you'll be told Error : Expected by IE and Missing; before statement by Firefox. It's surprising how often this error crops up.
These most common mistakes are errors caused by the programmer. There are other types of errors, called run-time errors, that occur when your code executes in the browser, and they aren't necessarily caused by a typo, missing curly brace, parenthesis, or other pitfalls discussed. These types of errors can still be planned for, as you'll see in the next section.
When writing your programs, you want to be informed of every error. However, the last thing you want the user to see are error messages when you finally deploy the code to a web server for the whole world to access. Of course, writing bug-free code would be a good start, but keep the following points in mind:
Occasions arise when conditions beyond your control lead to errors. A good example of this is when you are relying on something, such as a Java applet, that isn't on the user's computer and that you have no way of checking for.
Murphy's Law states that anything that can go wrong will go wrong!
The best way to handle errors is to stop them from occurring in the first place. That seems like stating the obvious, but there are a number of things you should do if you want error-free pages.
Thoroughly check pages in as many browsers as possible. This is easier said than done on some operating systems. The alternative is for you to decide which browsers you want to support for your web page, and then verify that your code works in them. Use the browser checking code found earlier in the book to send unsupported users to a nice, safe, and probably boring web page with reduced functionality, or maybe just supply them with a message that their browser and/or platform is not supported.
Validate your data. If users can enter dud data that will cause your program to fail, then they will. Make sure that a textbox has data entered into it if your code fails if the text box is empty. If you need a whole number, you must make sure the user entered one. Is the date the user just entered valid? Is the e-mail address
mind your own businessthe user just entered likely to be valid? No, so you must check that it is in the format[email protected].
Okay, so let's say you carefully checked your pages and there is not a syntax or logic error in sight. You added data validation that confirms that everything the user enters is in a valid format. Things can still go wrong, and problems may arise that you can do nothing about. Here's a real-world example of something that can still go wrong.
One of your authors, Paul, created an online message board that relies on a small Java applet to enable the transfer of data to and from the server without reloading the page. Paul checked the code and everything was fine, and it continued to work fine after launching the board, except that in about five percent of cases the Java applet initialized but then caused an error due to the user being behind a particular type of firewall (a firewall is a means of stopping hackers from getting into a local computer network). There is no way of determining whether a user is behind a certain type of firewall, so there is nothing that can be done in that sort of exceptional circumstance. Or is there?
In fact, JavaScript includes something called the try. . .catch statement. This enables you to try to run your code; if it fails, the error is caught by the catch clause and can be dealt with as you wish. For the message board, Paul used a try. . .catch clause to catch the Java applet's failure and redirected the user to a more basic page that still displayed messages, but without using the applet.
The try. . .catch statements work as a pair; you can't have one without the other. You use the try statement to define a block of code that you want to try to execute, and use the catch statement to define a block of code that will execute if an exception to the normal running of the code occurs in the block of code defined by the try statement. The term exception is key here; it means a circumstance that is extraordinary and unpredictable. Compare that with an error, which is something in the code that has been written incorrectly. If no exception occurs, the code inside the catch statement is never executed. The catch statement also enables you to get the contents of the exception message that would have been shown to the user had you not caught it first.
Let's create a simple example of a try. . .catch clause.
<!DOCTYPE html PUBLIC "-//W3C//DTD XHTML 1.0 Transitional//EN"
    "http://www.w3.org/TR/xhtml1/DTD/xhtml1-transitional.dtd">

<html xmlns="http://www.w3.org/1999/xhtml">
<head>
    <title>Try/Catch</title>
</head>
<body>
<script type="text/javascript">
try
{
    alert('This is code inside the try clause'),
    alert('No Errors so catch code will not execute'),
}
catch(exception)
{
    alert("The error is " + exception.message);
}
</script>
</body>
</html>
Save this as trycatch.htm.
This code first defines the try statement; as with all other blocks of code, you mark out the try block by enclosing it in curly braces.
Next comes the catch statement. The code included exception in parentheses right after the catch statement. This exception is simply a variable name. It will store an object, of type Error, containing information about any exception thrown during code execution inside the try code block. We'll call this object the exception object. Although the word exception is used here, you can use any valid variable name. For example, catch(exceptionObject) would be fine and certainly more descriptive.
The exception object contains several properties that provide information about the exception that occurred. The bad news is the exception object in IE differs somewhat from the exception object in other browsers (and even Firefox, Opera, Safari, and Chrome have differing properties from each other!). The good news is there are similarities, and you don't have to worry about writing cross-browser code if you're only concerned with the exception's message and the type of exception.
All major browsers support the name and message properties. The name property contains the name of the error type, and the message property contains the error message the user would normally see. These properties are part of the ECMAScript 3 standard.
Back to the code at hand, within the curly braces after the catch statement is the code block that will execute if and only if an exception occurs. In this case, the code within the try code block is fine, and so the alert() method inside the catch block won't execute.
Insert a deliberate error.
try
{
    alert('This is code inside the try clause'),
    ablert ('Exception will be thrown by this code'),
}
catch(exception)
{
    alert("The error is " + exception.message);
}
Resave the document and reload the page in your browser. The first alert() method in the try block of code executes fine and the alert box will be displayed to the user. However, the second ablert() statement will cause an error and code execution will start at the first statement in the catch block.
If you're using Internet Explorer, the error description displayed will be Object expected. If you're using another browser, the same error is interpreted differently and reported as ablert is not defined.
If you change the code again, so that it has a different error, you'll see something important.
try
{
    alert('This is code inside the try clause'),
    alert('This code won't work'),
}
catch(exception)
{
    alert("The error is " + exception.message)
}
Loading this revised code in a browser results in a normal browser error message telling you Expected ')' instead of displaying the alert box in the catch block. This happens because this code contains a syntax error; the functions and methods are valid, but you have an invalid character. The single quote in the word won't has ended the string parameter being passed to the alert() method. At that point JavaScript's syntax rules specify that a closing parenthesis should appear, which is not the case in this code. Before executing any code, the browser's JavaScript engine goes through all the code and checks for syntax errors, or code that breaches JavaScript's rules. If the engine finds a syntax error, the browser deals with it as usual; your try clause never runs and therefore cannot handle syntax errors.
The throw statement can be used within a try block of code to create your own run-time errors. Why create a statement to generate errors, when a bit of bad coding will do the same?
Throwing errors can be very useful for indicating problems such as invalid user input. Rather than using lots of if. . .else statements, you can check the validity of user input, then use throw to stop code execution in its tracks and cause the error-catching code in the catch block of code to take over. In the catch clause, you can determine whether the error is based on user input, in which case you can notify the user what went wrong and how to correct it. Alternatively, if it's an unexpected error, you can handle it more gracefully than with lots of JavaScript errors.
To use throw, type throw and include the error message after it.
throw "This is my error message";
Remember that when you catch the exception object in the catch statement, you can get hold of the error message that you have thrown. Although there's a string in this example throw statement, you can actually throw any type of data, including numbers and objects.
Try It Out: try . . . catch and Throwing Errors
In this example you'll be creating a simple factorial calculator. The important parts of this example are the try. . .catch clause and the throw statements. It's a frameset page to enable you to demonstrate that things can go wrong that you can't do anything about. In this case, the page relies on a function defined within a frameset page, so if the page is loaded on its own, a problem will occur.
First let's create the page that will define the frameset and that also contains an important function.
<!DOCTYPE html PUBLIC "-//W3C//DTD XHTML 1.0 Frameset//EN"
    "http://www.w3.org/TR/xhtml1/DTD/xhtml1-frameset.dtd">

<html xmlns="http://www.w3.org/1999/xhtml">
<head>
<title>Example</title>
<script type="text/javascript">
function calcFactorial(factorialNumber)
{
    var factorialResult = 1;
    for (; factorialNumber > 0; factorialNumber--)
    {
        factorialResult = factorialResult * factorialNumber;
    }
return factorialResult; } </script> </head> <frameset cols="100%,*"> <frame name="fraCalcFactorial" src="calcfactorial.htm" /> </frameset> </html>
Save this page as calcfactorialtopframe.htm.
<!DOCTYPE html PUBLIC "-//W3C//DTD XHTML 1.0 Transitional//EN"
    "http://www.w3.org/TR/xhtml1/DTD/xhtml1-transitional.dtd">

<html xmlns="http://www.w3.org/1999/xhtml">
<head>
<title>Example</title>
<script type="text/javascript">
function butCalculate_onclick()
{
    try
    {
        if (window.top.calcFactorial == null)
            throw "This page is not loaded within the correct frameset";
        if (document.form1.txtNum1.value == "")
            throw "!Please enter a value before you calculate its factorial";
        if (isNaN(document.form1.txtNum1.value))
            throw "!Please enter a valid number";
        if (document.form1.txtNum1.value < 0)
            throw "!Please enter a positive number";

        document.form1.txtResult.value =
         window.parent.calcFactorial(document.form1.txtNum1.value);
    }
    catch(exception)
    {
        if (typeof(exception) == "string")
        {
            if (exception.charAt(0) == "!")
            {
                alert(exception.substr(1));
                document.form1.txtNum1.focus();
                document.form1.txtNum1.select();
            }
            else
            {
                alert(exception);
            }
        }
        else
        {
            alert("The following error occurred " + exception.message);
        }
    }
}
</script>
</head>
<body>
<form action="" name="form1">
<input type="text" name="txtNum1" size="3" /> factorial is
<input type="text" name="txtResult" size="25" /><br />
<input type="button" value="Calculate Factorial"
name="butCalculate" onclick="butCalculate_onclick()" />
</form>
</body>
</html>Save this page as calcfactorial.htm. Then load the first page, calcfactorialtopframe.htm, into your browser.
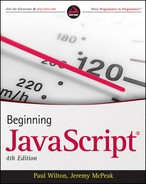
The page consists of a simple form with two text boxes and a button. Enter the number 4 into the first box and click the Calculate Factorial button. The factorial of 4, which is 24, will be calculated and put in the second text box (see Figure 4-3.)
The factorial of a number is the product of all the positive integers less than or equal to that number. For example, the factorial of 4 (written 4!) is 1 * 2 * 3 * 4 = 24. Factorials are used in various branches of mathematics, including statistics. Here, you want only to create a function that does something complex enough to be worthy of a function, but not so complex as to distract you from the main purpose of this example: the try. . .catch and throw statements.
If you clear the first text box and click the Calculate Factorial button, you'll be told that a value needs to be entered. If you enter an invalid non-numeric value into the first text box, you'll be told to enter a valid value. If you enter a negative value, you'll be told to enter a positive value.
Also, if you try loading the page calcfactorial.htm into your browser and enter a value in the text box and click the Calculate Factorial button, you'll be told that the page is not loaded into the correct frameset.
As you'll see, all of these error messages are created using the try. . .catch and throw statements.
Because this example is all about try. . .catch and throw, you'll concentrate just on the calcfactorial.htm page, in particular the butCalculate_onclick() function, which is connected to the onclick event handler of the form's only button.
Start by looking at the try clause and the code inside it. The code consists of four if statements and another line of code that puts the calculated factorial into the second text box. Each of the if statements checks for a condition that, if true, would cause problems for your code.
The first if statement checks that the calcFactorial() function, in the top frameset window, actually exists. If not, it throws an error, which is caught by the catch block. If the user loads the calcfactorial.htm page rather than the frameset page calcfactorialtopframe.htm, then without this throw statement your code will fail.
try
   {
       if (window.top.calcFactorial == null)
           throw "This page is not loaded within the correct frameset";
The next three if statements check the validity of the data entered into the text box by the user. First make sure the user entered something into the text box; then make sure the user entered a number, and then finally check that the value is not negative. Again if any of the if conditions is true, you throw an error, will be caught by the catch block. Each of the error messages you define starts with an exclamation mark, the purpose of which is to mark the error as a user input error, rather than an error such as not being in a frameset.
if (document.form1.txtNum1.value == "")
    throw "!Please enter a value before you calculate its factorial";
if (isNaN(document.form1.txtNum1.value))
    throw "!Please enter a valid number";
if (document.form1.txtNum1.value < 0)
    throw "!Please enter a positive number";
If everything is fine, the calcFactorial() function will be executed and the results text box will be filled with the factorial of the number entered by the user.
document.form1.txtResult.value =
        window.parent.calcFactorial(document.form1.txtNum1.value);
   }
Finally, turn your attention to the catch part of the try. . .catch statement. First, any message thrown by the try code will be caught by the exception variable.
catch(exception)
   {
The type of data contained in exception will depend on how the error was thrown. If it was thrown by the browser and not by your code, exception will be an object, the exception object. If it's thrown by your code, then in this instance you've thrown only primitive strings. So the first thing you need to do is decide what type of data exception contains. If it's a string, you know it was thrown by your code and can deal with it accordingly. If it's an object, and given that you know none of your code throws objects, you assume it must be the browser that has generated this exception and that exception is an Exception object.
if (typeof(exception) == "string")
      {
If it was code that generated the exception using a throw (and so exception is a string), you now need to determine whether the error is a user input error, such as the text box not containing a value to calculate, or whether it was another type of error, such as the page not being loaded in your frameset. All the user input exception messages had an exclamation mark at the beginning, so you use an if statement to check the first character. If it is a !, you notify the user of the error and then return focus to your control. If it's not, you just display an error message.
if (exception.charAt(0) == "!")
         {
             alert(exception.substr(1));
             document.form1.txtNum1.focus();
             document.form1.txtNum1.select();
         }
         else
         {
             alert(exception);
         }
      }
If exception was not a string, you know you have an exception object and need to display the message property:
else
      {
          alert("The following error occurred " + exception.message);
      }
}So far you've been using just one try. . .catch statement, but it's possible to include a try. . .catch statement inside another try statement. Indeed, you can go further and have a try. . .catch inside the try statement of this inner try. . .catch, or even another inside that, the limit being what it's actually sensible to do.
So why would you use nested try. . .catch statements? Well, you can deal with certain errors inside the inner try. . .catch statement. If, however, you're dealing with a more serious error, the inner catch clause could pass that error to the outer catch clause by throwing the error to it.
Here's an example:
try
{
    try
    {
       ablurt("This code has an error");
}
catch(exception)
{
var eName = exception.name;
if (eName == "TypeError" || eName == "ReferenceError")
{
alert("Inner try. . .catch can deal with this error");
}
else
{
throw exception;
}
}
}
catch(exception)
{
alert("Error the inner try. . .catch could not handle occurred");
}In this code you have two try. . .catch pairs, one nested inside the other.
The inner try statement contains a line of code that contains an error. The catch statement of the inner try. . .catch checks the value of the error's name. If the exception's name is either TypeError or ReferenceError, the inner try. . .catch deals with it by way of an alert box (see Appendix B for a full list of error types and their descriptions). Unfortunately, and unsurprisingly, the type of error thrown by the browser depends on the browser itself. In the preceding example, IE reports the error as a TypeError whereas the other browsers report it as a ReferenceError.
If the error caught by the inner catch statement is any other type of error, it is thrown up in the air again for the catch statement of the outer try. . .catch to deal with.
Let's change the butCalculate_onclick() function from the previous example, calcfactorial.htm, so that it has both an inner and an outer try. . .catch.
function butCalculate_onclick()
{
    try
    {
       try
       {
          if (window.top.calcFactorial == null)
             throw ("This page is not loaded within the correct frameset");
          if (document.form1.txtNum1.value == "")
             throw("!Please enter a value before you calculate its factorial");
          if (isNaN(document.form1.txtNum1.value))
             throw("!Please enter a valid number");
          if (document.form1.txtNum1.value < 0)
             throw("!Please enter a positive number");
          document.form1.txtResult.value =
            window.parent.calcFactorial(document.form1.txtNum1.value);
       }
catch(exception)
{
if (typeof(exception) == "string" && exception.charAt(0) == "!")
{
alert(exception.substr(1));
document.form1.txtNum1.focus();
document.form1.txtNum1.select();
}
else
{
throw exception;
}
}
}
catch(exception)
{
switch (exception)
{
case "This page is not loaded within the correct frameset":
alert(exception);
break;
default :
alert("The following critical error has occurred
" + exception);
}
}
}The inner try. . .catch deals with user input errors. However, if the error is not a user input error thrown by us, it is thrown for the outer catch statement to deal with. The outer catch statement has a switch statement that checks the value of the error message thrown. If it's the error message thrown by us because the calcfactorialtopframe.htm is not loaded, the switch statement deals with it in the first case statement. Any other error is dealt with in the default statement. However, there may well be occasions when there are lots of different errors you want to deal with in case statements.
The try. . .catch statement has a finally clause that defines a block of code that will execute whether or not an exception was thrown. The finally clause can't appear on its own; it must be after a try block, which the following code demonstrates:
try
{
    ablurt("An exception will occur");
}
catch(exception)
{
    alert("Exception occurred");
}
finally
{
    alert("Whatever happens this line will execute");
}
The finally part is a good place to put any cleanup code that needs to be executed regardless of any errors that occurred previously.
You've seen the top mistakes made by developers, and you've also seen how to handle errors in your code. Unfortunately, errors will still occur in your code, so let's take a look at one way to make remedying them easier by using a debugger.
JavaScript is traditionally looked upon as a difficult language to write and debug due to the lack of decent development tools. This is not the case now, however, thanks to many tools made available to developers. Most notably are the debugging tools available for Internet Explorer, Firefox, Safari, and Opera. With these tools, you can halt the execution of your script with breakpoints and then step through code line by line to see exactly what is happening.
You can also find out what data is being held in variables and execute statements on the fly. Without debuggers, the best you can do is use the alert() method in your code to show the state of variables at various points.
Debugging is generally universal across all browsers, and even languages. Some debugging tools may offer more features than others, but for the most part, the following concepts can be applied to any debugger:
Breakpoints tell the debugger it should break, or pause code execution, at a certain point. You can set a breakpoint anywhere in your JavaScript code, and the debugger will halt code execution when it reaches the breakpoint.
Watches allow you to specify variables that you want to inspect when your code pauses at a breakpoint.
The call stack is a record of what functions and methods have been executed to the breakpoint.
The console allows you to execute JavaScript commands in the context of the page and within the scope of the breakpoint. In addition, it catalogs all JavaScript errors found in the page.
Stepping is the most common procedure in debugging. It allows you to execute one line of code at a time. There are three ways to step through code.
Step Into executes the next line of code. If that line is a function call, the debugger executes the function and halts at the first line of the function.
Step Over, like Step Into, executes the next line of code. If that line is a function, Step Over executes the entire function and halts at the first line outside the function.
Step Out returns to the calling function when you are inside a called function. Step Out resumes the execution of code until the function returns. It then breaks at the return point of the function.
Before delving into the various debuggers, let's create a page you can debug. Note the deliberate typo in line 16. Be sure to include this typo if creating the page from scratch.
<!DOCTYPE html PUBLIC "-//W3C//DTD XHTML 1.0 Transitional//EN"
    "http://www.w3.org/TR/xhtml1/DTD/xhtml1-transitional.dtd">
<html xmlns="http://www.w3.org/1999/xhtml">
<head>
    <title>Debug: Times Table</title>
    <script type="text/javascript">
        function writeTimesTable(timesTable)
        {
            var counter;
            var writeString;
            for (counter = 1; counter < 12; counter++)
            {
                writeString = counter + " * " + timesTable + " = ";
                writeString = writeString + (timesTable * counter);
                writeString = writeString + "<br />";
                documents.write(writeString);
            }
        }
    </script>

</head>
<body>
        <script type="text/javascript">
            writeTimesTable(2);
        </script>
</body>
</html>
Save this as debug_timestable.htm.
The next section walks you through the features and functionality of the Firebug add-on for Firefox. Because of the universal nature of debugging and debuggers, the sections for Internet Explorer, Safari, and Opera will merely familiarize you with the UI for each browser's debugger and point out any differences.
For years, the only JavaScript debugger for Firefox was a Mozilla project codenamed Venkman. Its feature-set resembled that of Microsoft's Script Editor, but many developers felt Venkman wasn't user-friendly. One such developer, Joe Hewitt, decided to write his own debugger using the built-in debugging API (application programming interface) in Firefox. He christened his creation Firebug, and the rest, as they say, is history. Today, Firebug is the defacto JavaScript debugger (and much more!) for Firefox, and all other JavaScript (and web development) tools for other browsers are based, in principle, on Firebug.
Unfortunately, Firebug does not come with Firefox by default. Instead, you have to install the Firebug addon. You can download the latest version of Firebug from http://www.getfirebug.com, from Joe Hewitt's website at http://www.joehewitt.com/software/firebug/, or from Mozilla's add-on site at https://addons.mozilla.org/en-US/firefox/addon/1843.
To install Firebug, open Firefox and go to either of the provided URLs. Click the Install button on the web page, and follow the instructions. Be sure to restart Firefox after Firebug's installation.
You can access Firebug a couple of ways. You can click the Firebug icon in the status bar in the lower-right corner of the Firefox window. If you do not have Firefox's status bar visible, you can open Firebug by selecting Firebug

You can pop it out to its own window by clicking the up arrow next to the Close button.
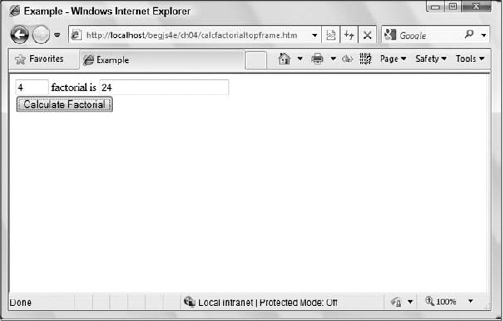
Open debug_timestable.htm in Firefox. If the status bar is visible, you should see red text in the lower-right corner of the Firefox window stating "1 Error." Click that message (or go through the Tools menu to open Firebug), and Firebug will open to the console. The console serves multiple purposes in Firebug; it lists JavaScript errors, and it also allows you to execute JavaScript code on the fly. We'll play with the console later.
The JavaScript debugger is contained in the Script tab, and it is made up of two panels. The left panel contains the source code, and the right panel contains three different views to choose from: Breakpoints, Watch, and Stack.
Breakpoints: Lists all breakpoints that you've created for the code in the current page.
Watch: Lists the variables in scope and their values at the breakpoint. You can also add other variables to watch.
Stack: Displays the call stack.
The source code in the left panel is read-only; if you want to change it, you have to edit the file in your text editor. Let's do so and change the offending documents in line 16 to document. Save it, and reload the web page.
Having corrected the mistake and reloaded the page, you should see the times table in your web page, as shown in Figure 4-5.
Also notice that the source code in Firebug's left panel updated to reflect your changes.
As mentioned earlier, breakpoints tell the debugger to pause code execution at a specific point in your code. This is handy when you want to inspect your code while it executes. Creating breakpoints in Firebug is straightforward; simply left-click in the gray area to the left of the source code's line numbers (the gutter). Breakpoints are denoted by a red circle in the gutter where you clicked.
You can also create a breakpoint when writing your code by using the debugger keyword (we'll use this a bit later).
Keeping the corrected debug_timestable.htm loaded in Firefox, create a breakpoint on line 14.
writeString = writeString + (timesTable * counter);
Reload the page, and notice Firebug stopped code execution at the breakpoint you just created. Firebug highlights the current line of code in light yellow and puts a yellow arrow in the gutter. This line hasn't been executed yet.
Click the Breakpoints tab in the right panel; it shows you the list of breakpoints (only one in this case). Each entry in the list consists of a checkbox to enable/disable the breakpoint, the containing function's name, the file name and line number of the source file, the source text of the breakpoint, and a Delete button.
Now click the Watch tab.
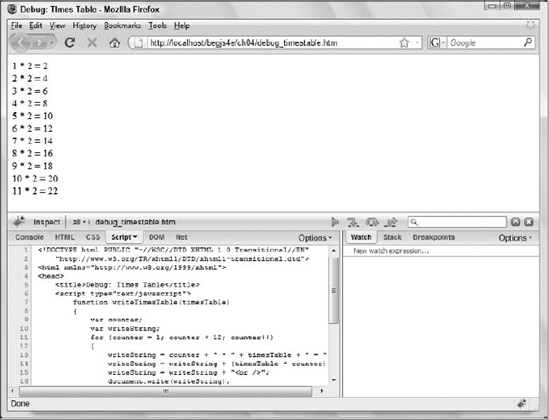
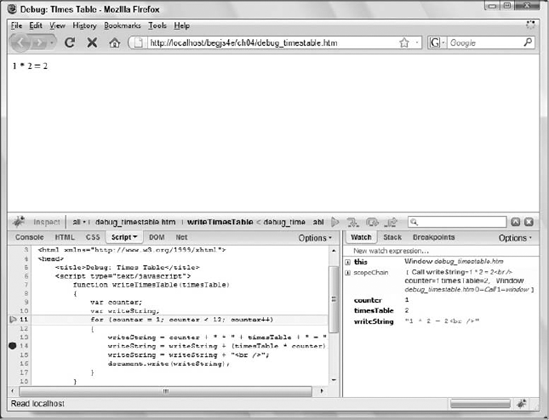
The Watch tab displays variables and their values currently in scope at the current line while code execution is paused. Figure 4-6 shows the contents of the Watch tab at this breakpoint.
Notice that the counter, timesTable, and writeString variables are visible (as is this).
You can also add your own variables to watch, inspecting their values as you step through code. To add a watch, simply click "New watch expression. . .," type the variable name you want to watch, and press the Enter key. Watches that you add have a gray background, and moving your mouse over them reveals a red Delete button.
You can watch any variable you want. If the variable is in scope, the variable's value is displayed. If the variable is out of scope, a ReferenceError is displayed as its value.
Although this information is helpful when you want to see what exactly is going on in your code, it's not very helpful if you can't control code execution. It's impractical to set a breakpoint and reload the page multiple times just to advance to the next line, so we use a process called stepping.
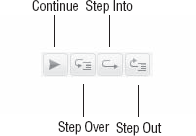
Code stepping is controlled by four buttons in the upper-right of the window, next to the source code search box (see Figure 4-7).

Continue (shortcut key is F8): Its function is to continue code execution until either the next breakpoint or the end of all code is reached.
Step Into (shortcut key is F11): Executes the current line of code and moves to the next statement. If the current line is a function, then it steps to the first line of the function.
Step Over (F10): Like Step Into, this executes the current line of code and moves to the next statement. However, if the statement is a function, it executes the function and steps to the next line after the function call.
Step Out: Returns to the calling function.
Let's do some stepping; follow these steps:
Step Into the code by clicking the icon or pressing F11. The debugger executes the currently highlighted line of code and moves to the next line.
Look in the Watch tab and at the value of
writeString; it is"1 * 2 = 2". As you can see, the values displayed in the Watch tab are updated in real time.One nice feature of Firebug is the page updates, if necessary, as you step through code. Click Step Into two more times to see this in action. Figure 4-8 shows the page updated while stepping through code.
You may find that the function you stepped into is not the source of the bug and want to execute the remaining lines of code in the function to continue step by step from the point at which the function was called. Do so by clicking the Step Out icon to step out of the code. However, if you're in a loop and the breakpoint is set inside the loop, you will not step out of the function until you iterate through the loop.
There may also be times when you have some code with a bug in it that calls a number of functions. If you know that some of the functions are bug-free, then you may want to just execute those functions instead of stepping into them and seeing them executed line by line. Use Step Over in these situations to execute the code within a function but without going through it line by line.
Alter your times-table code in debug_timestable.htm as follows so you can use it for the three kinds of stepping:
<!DOCTYPE html PUBLIC "-//W3C//DTD XHTML 1.0 Transitional//EN"
    "http://www.w3.org/TR/xhtml1/DTD/xhtml1-transitional.dtd">
<html xmlns="http://www.w3.org/1999/xhtml">
<head>Av
    <title>Debug: Times Table 2</title>

    <script type="text/javascript">
function writeTimesTable(timesTable)
{
var counter;
var writeString;
for (counter = 1; counter < 12; counter++)
{
writeString = counter + " * " + timesTable + " = ";
writeString = writeString + (timesTable * counter);
writeString = writeString + "<br />";
document.write(writeString);
}
}
</script>
</head>
<body>
<script type="text/javascript">
var timesTable;
for (timesTable = 1; timesTable <= 12; timesTable++)
{
document.write("<p>")
writeTimesTable(timesTable)
document.write("</p>")
}
</script>
</body>
</html>Save this as debug_timestable2.htm. Note that there are no errors in this HTML file.
The following instructions will walk you through the process of stepping through code.
Set a breakpoint in line 26, the
forloop in the body of the page, and reload the page.Click the Step Into icon and code execution will move to the next statement. Now the first statement inside the
forloop,document.write("<p>"), is up for execution.When you click the Step Into icon again, it will take you to the first calling of the
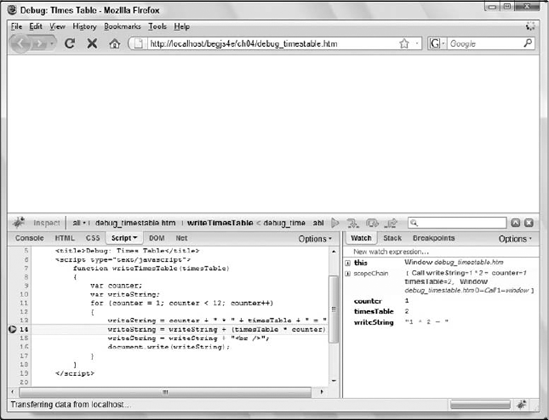
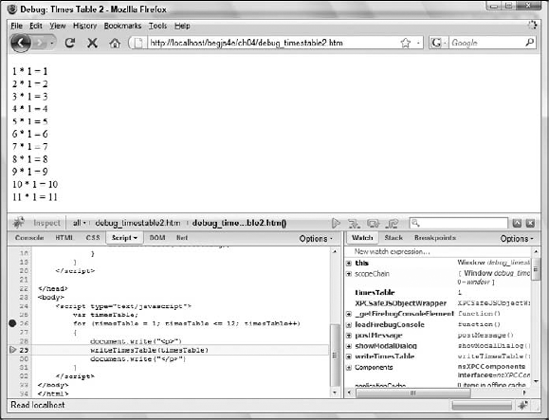
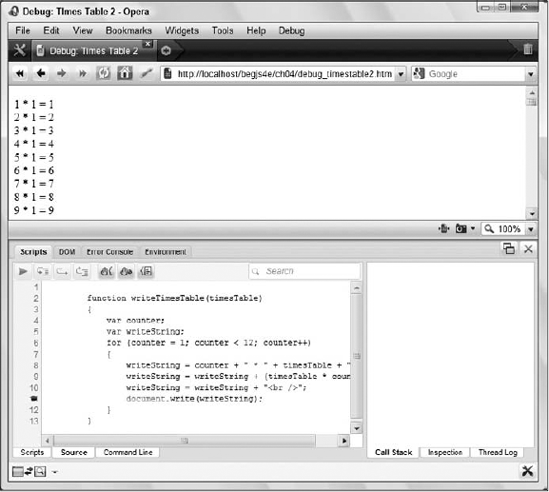
writeTimesTable()function.You want to see what's happening inside that function, so click Step Into again and you'll step into the function. Your screen should look like the one shown in Figure 4-9.
Click the Step Into icon a few times to get the gist of the flow of execution of the function. In fact, stepping through code line by line can get a little tedious. So let's imagine you're happy with this function and want to run the rest of it.
Use Step Out to run the rest of the code. The function has been fully executed, and you're back the calling line, as you can see from Figure 4-10.
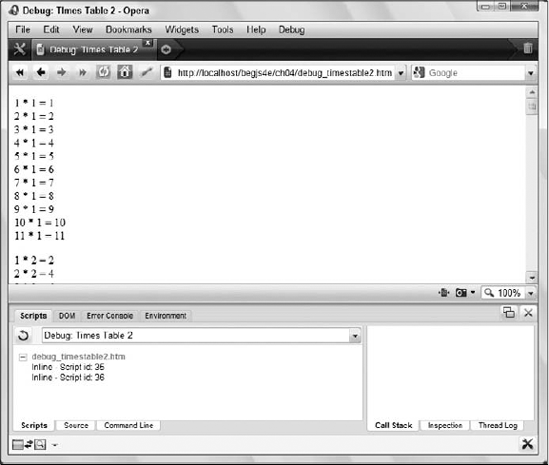
Click the Step Into icon twice to execute
document.write()(it won't be visible because it's a closing tag).Click Step Into four more times. Execution will continue through the condition and incrementing parts of the
forloop, ending back at the line that calls thewriteTimesTable()function.You've already seen this in action, so really you want to step over it and go to the next line. Well, no prizes for guessing that Step Over is what you need to do. Click the Step Over icon (or press the F10 key) and the function will be executed, but without stepping through it statement by statement. You should find yourself back at the
document.write("</p>")line.

If you've finished debugging, you can run the rest of the code without stepping through each line by clicking the Continue icon (or pressing F8) on the toolbar. You should see a page of times tables from 1*1=1 to 11*12=132 in the browser.
While you're stepping through code and checking its flow of execution, what would be really useful is the ability to evaluate conditions and even to change things on the fly. You can do these things using the console.
Follow these steps:
Remove the previously set breakpoint by clicking the red circle in the source code panel and set a new breakpoint at line 17:
document.write(writeString);
Let's see how you can find out the value currently contained in the variable
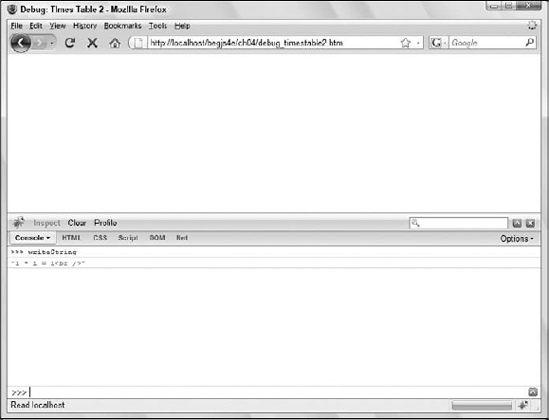
writeString. Reload the page. When the debugger stops at the breakpoint, click the Console tab, click in the ">>>" field, and type the name of the variable you want to examine, in this casewriteString. Press the Enter key. This will cause the value contained in the variable to be printed below your command in the command window, as shown in Figure 4-11.If you want to change a variable, you can write a line of JavaScript into the command window and press Enter. Try it with the following code:
writeString = "Changed on the Fly<br />"
Click the Script tab, and remove the breakpoint by clicking the red circle and then clicking the Continue icon. You see the results of your actions: where the
1*1times table result should be, the text you changed on the fly has been inserted.
This alteration does not change your actual HTML source file, just the page currently loaded in the browser.
The console can also evaluate conditions. Recreate the breakpoint on line 26 and reload the page. Leave execution stopped at the breakpoint, and Step Into the for loop's condition.
Type the following into the command window and press Enter:
timesTable >= 12
Because this is the first time the loop has been run, as shown in Figure 4-12, timesTable is equal to 1 so the condition timesTable <= 12 evaluates to true.

You can also use the console to access properties of the Browser Object Model (something we'll cover in Chapter 6). For example, if you type window.location.href into the command window and press Enter, it will tell you the web page's URL.
The console isn't limited to single lines of JavaScript. Click the up arrow on the right side of the screen and you can enter multiple statements to execute.
When you are single-stepping through the code, the call stack window keeps a running list of which functions have been called to get to the current point of execution in the code.
Let's create an example web page that demonstrates the call stack very nicely.
Enter this code:
<!DOCTYPE html PUBLIC "-//W3C//DTD XHTML 1.0 Transitional//EN"
    "http://www.w3.org/TR/xhtml1/DTD/xhtml1-transitional.dtd">
<html xmlns="http://www.w3.org/1999/xhtml">
<head>
    <title>Debugging: Callstack</title>
    <script type="text/javascript">
        function firstCall()
        {
            secondCall();
        }

        function secondCall()
        {
            thirdCall();
        }

        function thirdCall()
        {
            //
        }

        function button1_onclick()
        {
            debugger
            firstCall();
        }
    </script>
</head>
<body>
    <input type="button" value="Button" name="button1"
        onclick="return button1_onclick()" />
</body>
</html>
Save this page as
debug_callstack.htm, and load it into Firefox. All you'll see is a blank web page with a button.Click the button and the debugger will open at the
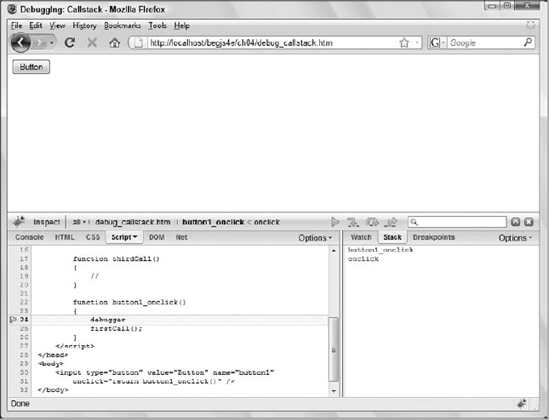
debuggerstatement in thebutton1_onclick()function, which is connected to the button'sonclickevent handler.Click the Call Stack tab in the right panel. Your debugger now looks like what is shown in Figure 4-13.
Firebug adds the function to the top of the call stack for every function call. You can already see that the first function called was actually the code attached to the
onclickevent handler of your button. Next, added to the call stack is the function called by theonclickevent handler, which is the functionbutton1_onclick()shown at the top of the call stack.If you want to see where each function was first entered, just click the function name in the call stack window. Click
onclickand the calling code (that is, the code connected to theonclickattribute of the<input/>element) will be shown. Now click the top line,button1_onclick, and that will take you back to the current execution point.Now Step Into twice. The first step is to the line that calls the
firstCall()function. The second step takes you into that function itself. The function is immediately added to the call stack, as shown in Figure 4-14.Step Into again to enter the second function,
secondCall(). Again this is added to the call stack. One more step takes you into the third function,thirdCall(), again with its name being added to the top of the call stack.Step Into again, and as you leave the function
thirdCall()you will see that its name is removed from the top of the call stack. Yet another step takes you out of the second functionsecondCall(), whose name is also now removed from the stack. Each additional click takes you out of a function, and removes its name from the call stack, until eventually all the code has been executed and you're back to the browser again.

This demo page was very simple to follow, but with complex pages, especially multi-frame pages, the call stack can prove very useful for tracking where you are, where you have been, and how you got there.
As mentioned earlier, most other developer tools for other browsers are based upon Firebug, and you'll soon see this with IE8's built-in tools.
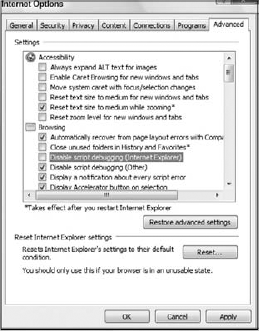
Before version 8, developers had to download and install the Microsoft Script Debugger for any type of script debugging. Thankfully, Microsoft built a debugger into IE8, but it is turned off by default. To enable it, follow these steps:
Click Tools

Click the Advanced tab, and uncheck the box next to "Disable script debugging (Internet Explorer)" under the Browsing section (see Figure 4-15).
Click OK to save the settings and exit the Internet Options dialog box.
You can access the debugger in a couple of ways now that it is enabled:
You can bring up the debugger by clicking Tools
This method is probably the easiest way to begin debugging. Simply navigate to the desired page. If any errors occur, a dialog box appears asking if you want to debug (see Figure 4-17).

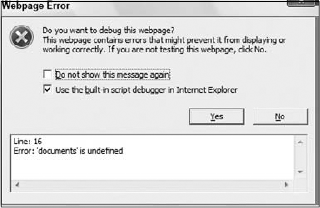
Click the Yes button, and the Developer Tools window appears with the Script tab already selected. The debugger stops on the line where the error is and highlights it in yellow, although this may not be obvious from the black-and-white screenshot in Figure 4-18. Go ahead and load the original version of debug_timestable.htm in IE8 (the one with the error) to see this in action. Click Yes to start debugging.

One of the primary differences in IE8's debugger is it must be in debugging mode if you want to debug. This may seem obvious, but if you recall, Firebug didn't have a debugging mode.
As you can see in Figure 4-18, the debugger is made up of two panels. The left displays the source code of the file that contains the error. If multiple files contain JavaScript, you can select those files by using the pull-down menu next to the Stop Debugging button.
The right panel contains five tabs:
Console: Consists of an upper and lower panel. The lower panel allows you to enter and run JavaScript code. It has a single-line mode and a multi-line mode for larger blocks of code. The upper panel is a log of commands you entered along with their results.
Breakpoints: Lists all breakpoints that you've created for the code in the current page.
Locals: Lists the variables and their values in scope of the breakpoint.
Watches: Lists the variables and their values you specify to watch at the breakpoint.
Call Stack: Displays the call stack.
Another difference in IE8's Developer Tools is the additional Locals tab. Microsoft took Firebug's Watch tab and broke it into the Locals and Watches tabs.
The source code in the left panel is read-only, so changing it requires editing the file in your text editor. Do so, and change the offending documents in line 16 to document. Save it and try to reload the web page. Notice you cannot do so. This is because the debugger is currently running and stopped at an error. In order to reload the page, you must click the Stop Debugging button. With the debugger now stopped, you can reload the page.
Having corrected the mistake and reloaded the page, you should see the times table in your web page.
Creating a breakpoint in IE8 is as simple and straightforward as it is in Firebug; simply click in the gutter on the line you want the debugger to break at. After creating a breakpoint, you'll notice a red circle next to the line number.
Upon creating a breakpoint, an entry is added in the list of breakpoints found by clicking the Breakpoints tab. Each entry consists of a checkbox to enable/disable the breakpoint, the file name of the source file, and the line number the breakpoint is on. Figure 4-19 shows a breakpoint on line 17 of debug_timestable2.htm.

IE8's JavaScript debugger also supports the debugger keyword. However, you must be in debugging mode in order for IE8's debugger to pause on that line. Otherwise, you'll be greeted with the old selection screen. If you use the debugger keyword in your code and see Figure 4-20, then you need to turn on debugging mode.

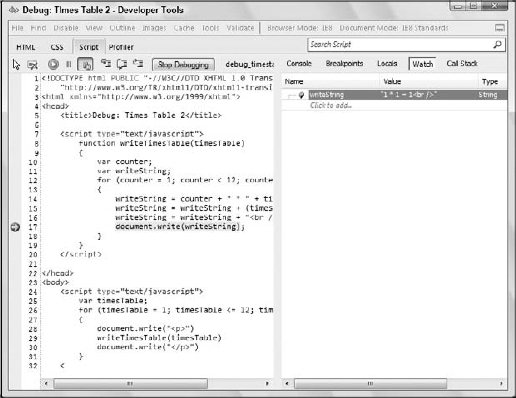
The Watch tab's sole purpose is to list the variables you want to watch and display their values and type. Adding a watch is slightly different in IE8 than it is in Firebug: You must be in debugging mode and stopped at a breakpoint to add a watch.
If you are in debugging mode and stopped at a breakpoint, simply click "Click to Add. . .," type the variable you want to watch, and press the Enter key (see Figure 4-21).
At the top of the debugger window, and to the left of the Debugging button, are six buttons that control code execution (see Figure 4-22).

The Continue option (shortcut key F5) continues code execution until either the next breakpoint or the end of all code. The second option, Break All, ensures that the debugger breaks before the execution of the next statement. Break on Error tells the debugger to break whenever an error occurs. Step Into (F11), Step Over (F10), and Step Out (Shift+11) behave as they do in Firebug.
IE8's debugger denotes the current line by highlighting the line in yellow and adds a yellow arrow in the gutter.
Unlike Firefox and Firebug, stepping through code does not update the web page. The JavaScript executes, but you will not see the results until all code is executed.
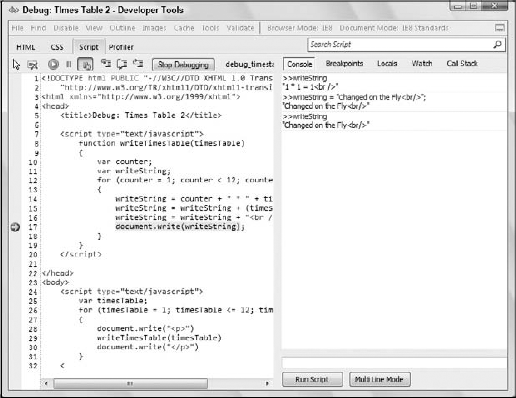
Unlike Firebug's console, IE8's Developer Tools console is located with the rest of the JavaScript tools and is accessed via the Console tab, but that's where the primary differences end.
The console logs JavaScript errors and allows you to execute code within the context of the line the debugger is stopped at. Figure 4-23 shows the "Changed on the Fly" example from the Firebug section recreated in IE8.
By default, the console accepts only single lines of JavaScript code. You can change this by clicking the Multi Line Mode button.
Safari's debugging tool's story is similar to that of IE's. Safari's rendering engine is called Webkit, and the folks that write and maintain Webkit built a separate tool, codenamed Drosera, that contained the tools similar to Firebug and IE8's Developer Tools. It was a separate download, and it required you to attach it to a specific Safari/Webkit window.
Safari 3 includes a tool called Web Inspector, but it does not have any JavaScript debugging capability. Starting with Safari 4, the Web Inspector has a built-in JavaScript debugger, which we'll cover in this section.
Chrome also uses Webkit, but only version 3 beta includes the script debugger at the time of this writing.
Like IE8, the Web Inspector is disabled by default. To enable it, follow these steps:
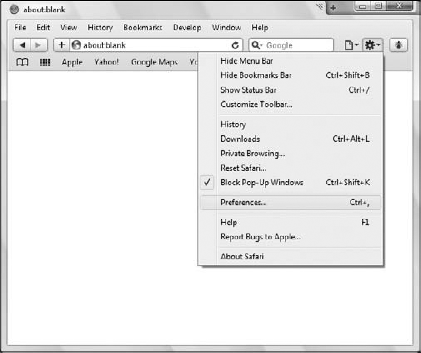
Click the Settings menu button and choose the Preferences option (see Figure 4-24).
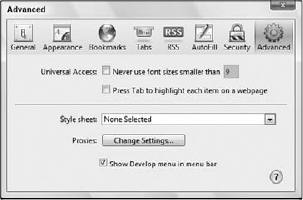
In the Preferences window, click the Advanced tab and select the Show Develop Menu in Menu Bar option (see Figure 4-25). Close the Preferences window.
Click the Settings menu button and select the Show Menu Bar option. This will display the traditional menus at the top of the window.
To open the debugger, select Develop
When the window opens, you'll see some code that definitely isn't yours. That's OK — you can change that in a bit. First, let's look at the window and identify the separate parts. Figure 4-26 shows the JavaScript debugger when it was first opened on the debug_timestable2.htm file. The code displayed may vary on your computer.
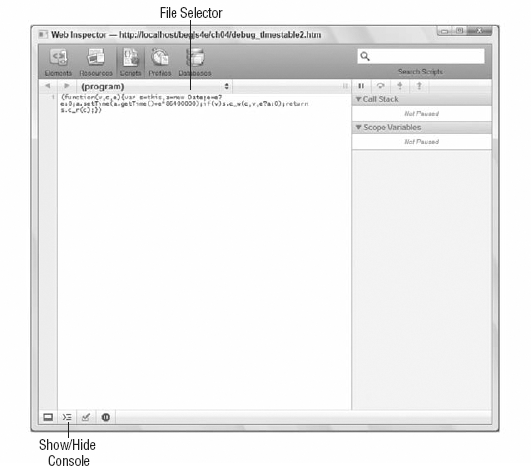
Unlike the tools you looked at previously, Safari's Web Inspector doesn't use tabs to partition the various features. Instead, it organizes everything within the window so you have easy access to all features. You can see the Call Stack and Scope Variables are not tabs, but rather individual sections you can view at the same time as you debug. Click the Console button, and you'll see that it adds a panel to the bottom of the window (see Figure 4-27).
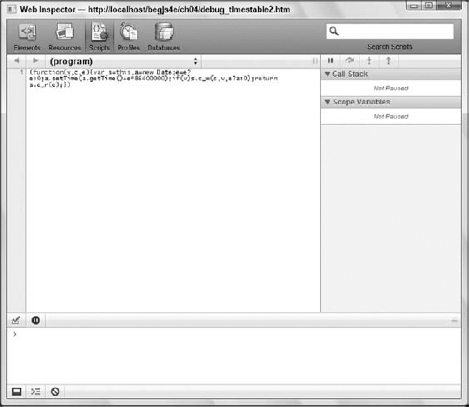
Everything is here, readily available and visible to you; so load debug_timestable2.htm in Safari and go back to the Web Inspector window. Click the file selection drop-down menu and choose the HTML file to display the source code of the file. Like the previous tools, the source code is read-only, but you can set breakpoints.
Creating a breakpoint follows the same procedure in Web Inspector as the other tools: click in the gutter on the line you want the debugger to break at. Breakpoints in Web Inspector are denoted by a blue tag (see Figure 4-28). Create one on line 17.
Unlike Firebug and IE's Developer Tools, Web Inspector does not list the breakpoints you set in a separate area, so remember where your breakpoints are if you use Safari and Web Inspector as your browser and debugger of choice.
Reload the page so the debugger can break and we can walk through the features.

Web Inspector does not allow you to add your own variables to watch, but the Scope Variables section displays all variables in scope. Figure 4-29 shows how the variables are divided into local and global variables.

The code-stepping buttons are at the top of the right panel and underneath the search box (see Figure 4-30).

These buttons perform the same functions as in Firebug and IE; however, they are in a slightly different order. The first button continues code execution until either the next breakpoint or the end of all code. The second button is Step Over, the third is Step Into, and the fourth is Step Out.
Like Firefox and Firebug, Safari and Web Inspector update the page as you step through code. So you can see the results as each line executes.
The console serves the same purpose as it does in the previous tools. You can check the value of a variable by typing the variable and pressing the Enter key. You can also execute code in the context of the current line of code. Try the "Changed on the Fly" example from the Firebug section to see it in action.
Unlike the previous tools, the Web Inspector console does not allow for multi-line input.
Although the Web Inspector's UI is sleek and tab-less (and some would say cluttered), it's time to venture back into the world of tabs with Opera's Dragonfly.
Opera's Dragonfly is a latecomer to the realm of browser-based development tools. At the time of this writing, it is currently pre-beta software, but it comes included with Opera as of version 9.5.
There are two ways to open Dragonfly:
Figure 4-31shows Dragonfly open with debug_timestable2.htm loaded in Opera.
Dragonfly follows the popular two-panel layout. The left panel contains a few tabs at the top that control the several different tools offered by Dragonfly. The debugging tools are located under the Scripts tab, and it's the default tab when you open Dragonfly.
At the bottom of the left panel are more tabs: Scripts, Source, and Command Line. The Source and Command Line tabs provide the same functionality found in the other debuggers:
Scripts: Displays the HTML files currently loaded into the browser and the JavaScript code they contain or reference. Figure 4-31 shows two inline scripts, meaning they are not contained in external files.
Source: Displays source code. Unlike other tools, it displays only the code you select from the Script tab.
Go to the Scripts tab and click the first inline script. Doing so opens the Source tab and displays the contents of the
<script />element in the HTML file's head (see Figure 4-32).Go back to the Scripts tab (at the bottom of the window), and you'll see a pair of square brackets (
[]) surrounding the inline script you clicked. This denotes the script that is currently displayed in the Source tab. Click the second inline script to view the contents of the<script />element in the HTML document's body.Command Line: This is Dragonfly's console. Like the consoles of Firebug, IE8's Developer Tools, and Safari's Web Inspector, this console allows you to check variables' values and execute JavaScript commands within the context of the currently paused line.

The right panel contains the Call Stack, Inspection, and Thread Log tabs:
Call Stack: Displays the call stack.
Inspection: Displays the variables and their values in scope at the paused line.
Thread Log: This is an advanced debugging tool that provides the information on the processing and execution of JavaScript code. This section will not cover the Thread Log tab.
Setting breakpoints in Dragonfly is as straightforward as in the other tools we've discussed thus far. Click one of the inline scripts in the Scripts tab to load it into the Source panel, and click to the left of the line numbers. A little black dot appears on the line number, indicating that a breakpoint is set for that line. Figure 4-33 shows a breakpoint set on line 11 of the first inline script.
Code stepping is controlled by a row of icons above the source code (see Figure 4-34).
These icons perform the same functions as in Firebug, IE's Developer Tools, and Web Inspector. They are, in order:
Continue (F8)
Step Into (F11)
Step Over (F10)
Step Out (Shift + F11).
Like Firefox and Firebug as well as Safari and Web Inspector, Opera and Dragonfly update the page as you step through code, allowing you to see the results of each line of code as it executes.
In this chapter you looked at the less exciting part of coding, namely bugs. In an ideal world you'd get things right the first time, every time, but in reality any code more than a few lines long is likely to suffer from bugs.
You first looked at some of the more common errors, those made not just by JavaScript beginners, but also by experts with lots of experience.
Some errors are not necessarily bugs in your code, but in fact exceptions to the normal circumstances that cause your code to fail. (For example, a Java applet might fail because a user is behind a firewall.) You saw that the
try. . .catchstatements are good for dealing with this sort of error, and that you can use thecatchclause with thethrowstatement to deal with likely errors, such as those caused by user input. Finally, you saw that if you want a block of code to execute regardless of any error, you can use thefinallyclause.You looked at Firebug for Firefox, IE8's Developer Tools, the Web Inspector for Safari, and Opera's Dragonfly. With these tools you can analyze code as it's being run, which enables you to see its flow step by step, and to check variables and conditions. Although these debuggers have different interfaces, their principles and feature sets are pretty much the same.
Suggested solutions to these questions can be found in Appendix A.
The example
debug_timestable2.htmhas a deliberate bug. For each times table it creates only multipliers with values from1to11.Use the script debugger to work out why this is happening, and then correct the bug.
The following code contains a number of common errors. See if you can spot them:
<!DOCTYPE html PUBLIC "-//W3C//DTD XHTML 1.0 Transitional//EN"
    "http://www.w3.org/TR/xhtml1/DTD/xhtml1-transitional.dtd">

<html xmlns="http://www.w3.org/1999/xhtml">
<head>
<title>Chapter 4, Question 2</title> </head> <body> <script type="text/javascript"> function checkForm(theForm) { var formValid = true; var elementCount = 0; while(elementCount =<= theForm.length) { if (theForm.elements[elementcount].type == "text") { if (theForm.elements[elementCount].value() = "") alert("Please complete all form elements") theForm.elements[elementCount].focus; formValid = false; break; } } return formValid; } </script> <form name="form1" onsubmit="return checkForm(document.form1)" action=""> <input type="text" id="text1" name="text1" /> <br /> CheckBox 1<input type="checkbox" id="checkbox2" name="checkbox2" /> <br /> CheckBox 1<input type="checkbox" id="checkbox1" name="checkbox1" /> <br /> <input type="text" id="text2" name="text2" /> <para> <input type="submit" value="Submit" id="submit1" name="submit1" /> </para> </form> </body> </html>