
CHAPTER 10
![]()
Monitoring
BEHOLD, the fool saith, “Put not all thine eggs in the one basket”—which is but a manner of saying, “Scatter your money and your attention;” but the wise man saith, “Put all your eggs in the one basket and—WATCH THAT BASKET.”— Pudd’nhead Wilson’s Calendar.
—The Tragedy of Pudd’nhead Wilson by Mark Twain
When I was growing up, I was sometimes woken at night by the sound of a walking stick tapping on the ground—it was the night watchman patrolling the neighborhood. He would have had a better chance of surprising any burglars if he’d crept up on them quietly, but I never questioned why he advertised his presence so loudly. Armed only with a walking stick, he would have had to rely on strong lungs to wake up the neighborhood if he saw any burglars, so perhaps it was best to advertise his presence and hope that burglars would flee when they heard him coming. Nevertheless, the sound of his stick was comforting—it was good to know that someone trustworthy was watching the neighborhood while we slept.
The database administrator is responsible for watching the database. If something goes wrong with the database that could have been prevented, there is nobody else to blame. Database availability, changes, security, growth, backups, workload, performance, and capacity are some of the areas that should be monitored. Luckily, Oracle offers many tools for database monitoring. Enterprise Manager puts the information at your fingertips and can send out e-mail messages when things go wrong. Oracle also maintains all sorts of totals and counts that keep track of database workload, performance, and capacity. All that remains is to create regular snapshots of these numbers—this is automatically done by tools such as Statspack and Automatic Workload Repository (AWR). This time-series data can be manipulated with SQL queries and turned into graphs. You saw how to enable Statspack snapshots in Chapter 6. Statspack is a free tool, whereas AWR requires you to be licensed for Enterprise Edition as well as Diagnostics Pack. For that reason, I give equal time to Statspack and AWR in this book.
![]() Tip The SQL scripts in this chapter use blank lines for extra readability. When executing them in SQL*Plus, use the command set sqlblanklines on to prevent them from erroring out.
Tip The SQL scripts in this chapter use blank lines for extra readability. When executing them in SQL*Plus, use the command set sqlblanklines on to prevent them from erroring out.
Monitoring Database Availability
The DBA must continuously monitor the availability of the database and take the necessary action to restore service. The best source of information is the alert log, which contains error messages as well as alert messages. A sample excerpt covering database startup is shown in Listing 10-1.
![]() Tip List the contents of the V$DIAG_INFO view and look for the row containing the words Diag Trace—this gives you the location of the alert log. The name of the alert log is alert_SID.log, where SID is the name of your database instance such as orcl.
Tip List the contents of the V$DIAG_INFO view and look for the row containing the words Diag Trace—this gives you the location of the alert log. The name of the alert log is alert_SID.log, where SID is the name of your database instance such as orcl.
Fortunately, there is no need to stay glued to a computer the whole day, reviewing the alert log. You can use Oracle Enterprise Manager to monitor the database and send e-mail messages—or even open problem tickets—whenever problems are detected. Step-by-step instructions for configuring the monitoring capability can be found in the Oracle Database 12c 2 Day DBA manual provided on Oracle’s website.
It is even possible to customize and extend the alerting capabilities of Enterprise Manager. For example, an alert could be generated if a batch job continued running past a defined maintenance window. Corrective action can be taken automatically if needed; for example, a job that continues running outside a defined maintenance window can be killed automatically, or an incident record can be created in an incident-management system.
![]() Tip The alert log contains informational messages in addition to error messages. Even if the database is being monitored by Enterprise Manager, the DBA should periodically review the alert log.
Tip The alert log contains informational messages in addition to error messages. Even if the database is being monitored by Enterprise Manager, the DBA should periodically review the alert log.
Monitoring Changes
The DBA can monitor changes to database objects using the Oracle auditing facilities. The command AUDIT ALL enables auditing for a wide variety of actions that modify the database and objects in it. Examples of such actions are ALTER SYSTEM, ALTER TABLESPACE, ALTER TABLE, and ALTER INDEX. The list of audited actions is contained in DBA_STMT_AUDIT_OPTS. Auditing of modifications to tables must be separately enabled, using the command AUDIT ALTER TABLE. If the database initialization parameter AUDIT_TRAIL is set to db_extended or xml:extended, Oracle also records the SQL statement associated with the action. As illustrated in Listing 10-2, you can find the information in the DBA_AUDIT_OBJECT view.
I have more to say on the subject of auditing in Chapter 14, in particular about the location and sizing of the audit trail.
Monitoring Security
The DBA can use the Oracle auditing facilities to monitor database usage. The AUDIT CREATE SESSION command causes all connections and disconnections to be recorded. Of particular interest for security purposes are the USERHOST, TERMINAL, and OS_USERNAME values in the DBA_AUDIT_SESSION view. These tell you where a connection originated; unusual values may indicate unauthorized intrusions. Listing 10-3 shows an example.
You should also check the database’s security settings. Here are two important questions to ask:
- Is there a password policy that forces users to change their passwords at regular intervals? Is password complexity enforced? Is an account automatically locked if there are too many failed login attempts? (The answers can be found in the DBA_PROFILES view.)
- Which users have DBA privileges? (The answer can be found in the DBA_ROLE_PRIVS view.)
Monitoring Backups
Oracle provides a utility called Recovery Manager (RMAN) for database backups and recovery. One of the advantages of RMAN is that it maintains detailed history information. You can use RMAN commands such as list backup to review the history of backups. You can issue commands such as report need backup and report unrecoverable to determine whether fresh backups are needed. You can also obtain a report of backups on the View Backup Report page of Enterprise Manager.
The use of RMAN for backups and recovery is discussed in Chapters 12 and 13, respectively.
Monitoring Growth
As illustrated in Listing 10-4, you can use the information in the DBA_DATA_FILES view to monitor the size of your database; the query shows the size in megabytes of each tablespace in the database.
You can incorporate the query in Listing 10-4 into a batch report with the SQL*Plus command-line tool, or you can execute it interactively with SQL Developer. Alternatively, as illustrated in Figure 10-1, Enterprise Manager offers a visual representation of space usage.
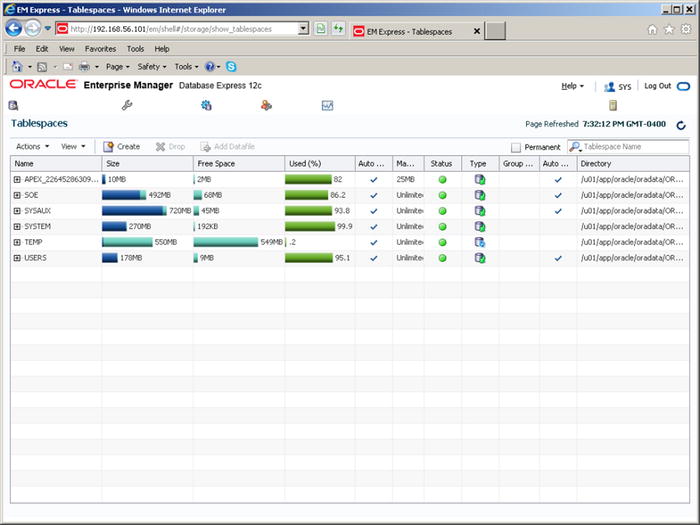
Figure 10-1. Database size report in Enterprise Manager
Table sizes can be monitored using the DBA_SEGMENTS view. The query in Listing 10-5 displays table sizes in megabytes; it uses the RANK function to limit the list to the ten biggest tables.
In some cases, it is also useful to monitor the number of rows in specific tables; this is efficiently accomplished by checking the NUM_ROWS value in the DBA_TABLES view. NUM_ROWS is an approximate value that is updated when optimizer statistics are collected. If accurate counts are required, you can use the computationally expensive SELECT COUNT(*) command instead. Historical data is not automatically stored by Oracle; you have to develop your own method of capturing and storing this information. You could, for example, create a special table in which to store periodic snapshots of the number of rows in specific tables that are of interest to you.
Monitoring Workload
It is very important to understand the database workload. Most databases have a distinctive workload profile. If you regularly check your database workload profile, you can detect deviations and trends.
![]() Tip Regular and distinct patterns in the workload profile indicate database stability.
Tip Regular and distinct patterns in the workload profile indicate database stability.
The V$SYSSTAT view keeps track of hundreds of different aspects of the database workload, such as logons, executions, commits, logical reads, physical reads, redo size, and the like. These metrics—with a few notable exceptions such as logons current and opened cursors current—are cumulative, which means their values increase during the lifetime of the database. Snapshots of the information in the V$SYSSTAT view are available in the STATS$SYSSTAT table (in the case of Statspack) and in the DBA_HIST_SYSSTAT view (in the case of AWR); they are described in Listing 10-6. The SNAP_ID (snapshot ID) and DBID (database ID) values are used to identify snapshots—they link to the STATS$SNAPSHOT table and the DBA_HIST_SNAPSHOT view, which contain details such as the time when the snapshot was created.
The Excel graph shown in Figure 10-2 was generated using the data produced by the SQL query shown in Listing 10-7. The graph shows a distinct pattern, indicating database stability. The PIVOT operator is used to produce new columns, and the LAG analytic function is used to operate on data in different rows. The use of subquery factoring breaks the query into logical pieces and makes it readable.
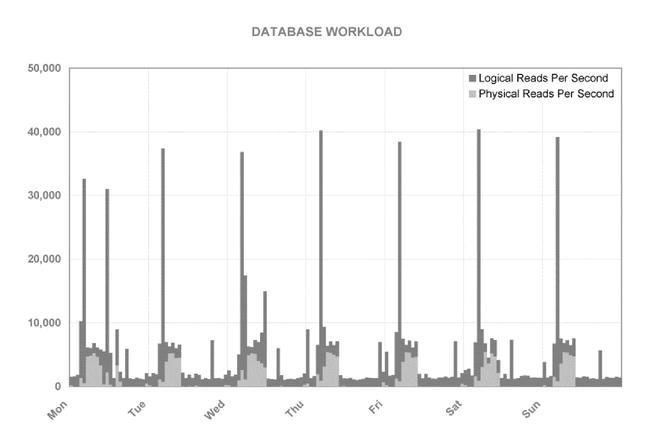
Figure 10-2. Excel graph of logical reads and physical reads produced using the time-series data in the STATS$SYSSTAT table
Monitoring Performance
Be sure to monitor the performance of important queries. The V$SQLAREA view records execution statistics such as executions, CPU time, elapsed time, logical reads, and physical reads for each SQL statement cached in the library cache—it is therefore a source of workload information as well as performance information. Snapshots of the information in the V$SQLAREA view are available in the STATS$SQL_SUMMARY table (in the case of Statspack) and in the DBA_HIST_SQLSTAT view (in the case of AWR). The SQL statement in Listing 10-8 retrieves the average execution times of each of two SQL queries of choice in successive time periods; the query can easily be modified to include additional queries that are critical to application performance. Notice the use of the LAST_VALUE analytic function to interpolate missing values.
Monitoring Capacity
The V$OSSTAT view offers cumulative values for operating system metrics such as CPU usage. Snapshots of the information in the V$OSSTAT view are available in the STATS$OSSTAT table (in the case of Statspack) and in the DBA_HIST_OSSTAT view (in the case of AWR); they are described in Listing 10-9. The SQL statement in Listing 10-10 computes the CPU utilization percentage for each time period.
![]() Tip If you have licensed the System Monitoring Plug-In for Hosts, Enterprise Manager can track disk and CPU utilization and alert you when thresholds are breached.
Tip If you have licensed the System Monitoring Plug-In for Hosts, Enterprise Manager can track disk and CPU utilization and alert you when thresholds are breached.
Third-Party Tools
Many organizations use third-party tools for enterprise-wide monitoring. Examples include Patrol from BMC, Tivoli from IBM, and OpenView from HP. Open source tools such as Nagios are also a popular choice. An enterprise-wide tool that is agnostic to database and server technologies will have more breadth than Oracle Enterprise Manager but not as much depth. However, Enterprise Manager is constrained by the number of extra-cost options that must be separately licensed—they include Provisioning Pack, Database Change Management Pack, Database Tuning Pack, Database Configuration Pack, Database Diagnostics Pack, System Monitoring Plug-in for Hosts, and so on.
If you join a team of DBAs, you should ask your colleagues for information about the monitoring tools being used in your organization.
Summary
Here is a short summary of the concepts touched on in this chapter:
- Database availability, changes, security, growth, backups, workload, performance, and capacity are some of the areas that should be monitored by the DBA.
- The alert log contains error messages and informational messages. The location of the alert log is listed in the V$DIAG_INFO view. The name of the alert log is alert_SID.log, where SID is the name of your database instance.
- Enterprise Manager monitors the database and sends e-mail messages when problems are detected.
- The command AUDIT ALL enables auditing for a wide variety of actions that modify the database and objects in it, such as ALTER SYSTEM, ALTER TABLESPACE, ALTER TABLE, and ALTER INDEX.
- The AUDIT CREATE SESSION command causes all connections and disconnections to be recorded.
- Recovery Manager (RMAN) maintains detailed history information about backups. RMAN commands such as list backup, report need backup, and report unrecoverable can be used to review backups. Enterprise Manager can also be used to review backups.
- Database size can be monitored using DBA_DATA_FILES; table size can be monitored using DBA_SEGMENTS.
- Oracle maintains a large number of totals and counts that keep track of database workload, performance, and capacity. Statspack and AWR create regular snapshots of these numbers—this time-series data can be manipulated with SQL queries and turned into graphs. The V$SQLAREA view records execution statistics such as executions, CPU time, elapsed time, logical reads, and physical reads for each SQL statement cached in the library cache. The V$OSSTAT view offers cumulative values of operating system metrics such as CPU usage.
Exercises
- Review the discussion of user management in Chapter 8. Also review the definitions of the DBA_ROLE_PRIVS and DBA_PROFILES views in Oracle Database 12c Reference in the Oracle documentation set. Answer the following questions about the database pdb1 in your VM: Which database users have DBA authority? Is there a password policy that forces database users to change their passwords at regular intervals? Is password complexity enforced? Is an account automatically locked if there are too many failed login attempts?
- Develop a system that tracks database growth and table growth. Create history tables to capture the information contained in the DBA_DATA_FILES and DBA_SEGMENTS views. Write SQL queries that report daily, weekly, and monthly growth.
- Modify the Statspack queries in this chapter for use with the corresponding AWR views: DBA_HIST_SNAPSHOT, DBA_HIST_SYSSTAT, DBA_HIST_SQLSTAT, and DBA_HIST_OSSTAT. The definitions of the AWR views can be found in the Oracle Database 12c Reference manual.
Further Reading
- Oracle Database 12c 2 Day DBA Chapter 3 (Introduction to Oracle Enterprise Manager Database Express. http://docs.oracle.com.
- Oracle by Example (OBE) tutorial “Getting Started with Oracle Enterprise Manager Express.”