
CHAPTER 14
![]()
Database Maintenance
“Sometimes,” he added, “there is no harm in putting off a piece of work until another day. But when it is a matter of baobabs, that always means a catastrophe. I knew a planet that was inhabited by a lazy man. He neglected three little bushes …”
—The Little Prince by Antoine de Saint-Exupéry
In my first job as a database administrator, working for a Fortune 100 company, I managed only three databases, each no more than 100MB in size, and had ample time for database maintenance. I performed regular database-maintenance procedures to keep the databases in peak operating condition, included data archiving and purging and rebuilding of tables and indexes. I also published graphs of database and application performance every week.
Gartner Research estimated in 2007 that the average amount of data managed by each DBA is 1TB. This allows very little time for database maintenance.
The Maintenance Plan
Here are the components of a simple maintenance plan—they should be automated as much as possible. The following sections of this chapter cover each component in detail.
- Regular backups are absolutely critical to the safety of the database (there may be exceptions, but they only prove the rule). Backup logs should be reviewed frequently, and a recovery exercise should be conducted at least once a year—more often if possible.
- The query optimizer relies on statistical information about the data. By default, statistics are automatically refreshed by Oracle every night, but some sites use a custom approach. Manual intervention may be occasionally needed.
- Data that is no longer needed should be archived and then purged from the database. Tables and indexes that contain a large amount of wasted space should be rebuilt to reclaim space.
- Log files should be reviewed regularly—daily if possible. Old log files should be removed.
- Disk capacity and system capacity should be reviewed regularly. Disk space should be proactively added to the database.
- User activities should be audited.
- Passwords should be changed regularly or when compromised. Unneeded accounts should be locked or removed.
- Patches should be applied to the database when necessary.
![]() Caution Index rebuilding and tablespace defragmentation are often conducted without sufficient justification. An old paper by Juan Loaiza, “How to Stop Defragmenting and Start Living: The Definitive Word on Fragmentation,” (which you can find on the web) can be considered the last word on the subject.
Caution Index rebuilding and tablespace defragmentation are often conducted without sufficient justification. An old paper by Juan Loaiza, “How to Stop Defragmenting and Start Living: The Definitive Word on Fragmentation,” (which you can find on the web) can be considered the last word on the subject.
Backups
Backups are the most important aspect of database maintenance, but the honest truth is that most companies don’t pay enough attention to them. Here are some best practices for backups; please refer to Chapter 12 and Chapter 13 for specific information on methods of backups (and recovery).
Generic Best Practices for Database Backups
The following practices apply to all database backups, not just Oracle backups:
- Establish a service-level agreement (SLA) for backups and recovery. Clearly document the maximum amount of data loss that is permitted, backup-retention policies, and how much time is allowed for database recovery.
- Document the backup methodology, and have it formally reviewed. Publish the documentation to an audience that includes the database owner.
- Periodically test the recoverability of backups. Typically this is done in a testing environment. A recovery test establishes how long it will take to recover the database.
- Be prepared to recover from user error—for example, when a user inadvertently updates or deletes the wrong data. I present several options in Chapter 13.
- Have a contingency plan that covers damage to the operating system or hardware—be prepared to move the database to another server.
- Ensure the safety of backups. The traditional method is to send backup tapes offsite. Newer methods involve backups to a backup appliance over the network. A combination of near-line (disk) and far-line (tape or network) backups can be used. Near-line backups reduce the time needed for recovery, whereas far-line backups increase the safety of backups. The tape library should not be a single point of failure—ensure that data can be recovered even if the tape library is damaged.
- Retain multiple backups in case one set of backups is damaged.
- Backup scripts should incorporate error checking and an adequate amount of logging. The logs should be retained for an appropriate time. Notification of backup failures should be sent to the DBAs. Backup failures should be formally investigated.
- Reports of backup successes and failures, the amount of data backed up, and the time it took to perform backups should be generated and sent to an audience that includes the DBAs and the database owner.
- Changes to any aspect of backup procedures, whether temporary or permanent, should be performed under formal change-control procedures.
![]() Tip Don’t forget to perform backups of databases used for development and testing.
Tip Don’t forget to perform backups of databases used for development and testing.
Best Practices for Oracle Database Backups
The following practices apply specifically to Oracle database backups:
- Use Recovery Manager (RMAN) for backups. The advantages of RMAN are so numerous and valuable that it would be hard to justify not using it. For example, RMAN checks data blocks for corruption while it is making a backup, single-block recovery is possible with RMAN, and so on.
![]() Tip Backups performed using third-party software such as Network Appliance Snapshot can be integrated with RMAN.
Tip Backups performed using third-party software such as Network Appliance Snapshot can be integrated with RMAN.
- Prevent unlogged operations (that is, operations that are not recorded in the redo logs) in databases that use ARCHIVELOG mode; use the ALTER DATABASE FORCE LOGGING command to do this.
- Back up all aspects of the database, including the archived redo logs (for databases that use ARCHIVELOG mode), the control file, and the parameter file (spfile).
- Create logical backups (exports) to supplement physical backups. This creates a certain amount of protection from logical damage, such as data-entry errors. Use a setting such as FLASHBACK_TIME to ensure the consistency of the exported data.
- Make full use of Oracle’s flashback features by increasing the value of UNDO_RETENTION from the default value of 15 minutes to a more appropriate value such as 24 hours. This may allow recovery from logical damage without having to resort to physical backups.
- Databases that run in ARCHIVELOG mode should have LAG_ARCHIVE_TARGET set to an appropriate value, such as 15 minutes, to control maximum data loss.
- Incorporate the use of techniques that check for data corruption. These include initialization parameters such as DB_BLOCK_CHECKING, DB_BLOCK_CHECKSUM, and DB_LOST_WRITE_UPDATE, and commands that scan the database, such as VALIDATE DATABASE.
![]() Tip Oracle Database 11g introduced a single parameter called DB_ULTRA_SAFE that controls the values of DB_BLOCK_CHECKING, DB_BLOCK_CHECKSUM, and DB_LOST_WRITE_UPDATE.
Tip Oracle Database 11g introduced a single parameter called DB_ULTRA_SAFE that controls the values of DB_BLOCK_CHECKING, DB_BLOCK_CHECKSUM, and DB_LOST_WRITE_UPDATE.
Statistics
The query optimizer requires statistical information about the data, such as the number of rows in each table, in order to generate efficient query plans. This information is collected using the procedures in the DBMS_STATS package. Beginning with Oracle Database 10g, statistical information about the data is refreshed automatically by a scheduled nightly job called GATHER_STATS_JOB; you are free to disable this job in favor of a custom approach. Oracle supplies a wide collection of procedures to collect and manage statistics, including GATHER, DELETE, IMPORT, EXPORT, LOCK, UNLOCK, PUBLISH, and RESTORE procedures. A complete list of them follows, and you can find details in Oracle Database PL/SQL Packages and Types Reference.
![]() Caution Small changes in statistics can sometimes produce big changes in query plans—not always for the better—and this problem can challenge even the most experienced DBAs. The LOCK and RESTORE procedures can be very useful in improving plan stability.
Caution Small changes in statistics can sometimes produce big changes in query plans—not always for the better—and this problem can challenge even the most experienced DBAs. The LOCK and RESTORE procedures can be very useful in improving plan stability.
Archiving and Purging
Database performance commonly degrades as the database grows large. To keep the database performing optimally, you should remove unnecessary data. In some cases, it may be necessary to save a copy of the data in a data archive, such as flat files, XML documents, or the like, before the data is purged from the database. The archiving phase also involves a special backup that is tagged with a high-retention setting, such as seven years.
The freed space is automatically used by new data. Regular purging keeps the size of the database under control and helps keep performance stable. If a large amount of data is purged at a time, the sizes of the tables and indexes are not commensurate with the amount of data they actually contain, and additional maintenance is required to compact and shrink the bloated tables and indexes. This is discussed in the section on rebuilding tables and indexes.
The use of partitioning can completely eliminate the need for archiving, purging, and rebuilding. For example, a table can be divided into partitions in such a way that each month’s data is inserted into a separate partition. Queries that require the most recent data perform optimally because the required data is clustered in a relatively small number of data blocks instead of being randomly scattered throughout the table as happens when partitioning is not used. In the case of partitioned tables, purging the data requires only that a partition be dropped; this is a very quick operation. If the old partitions are in a separate tablespace, an alternative to purging is to convert the tablespaces to read-only mode and move them to cheap storage such as WORM drives or unmirrored SATA disks; this is a wonderful way to keep performance optimal without having to remove data. Even the overhead of backups can be kept under control; read-only tablespaces must be backed up only one more time with a high-retention setting and then no longer need to be backed up.
![]() Caution Partitioning is an extra-cost option for which Enterprise Edition is a prerequisite. If you are not licensed for Partitioning, you can use partition views or use a do-it-yourself approach.
Caution Partitioning is an extra-cost option for which Enterprise Edition is a prerequisite. If you are not licensed for Partitioning, you can use partition views or use a do-it-yourself approach.
Rebuilding
The size of a table does not change when records are deleted from it—the indexes associated with the table do not shrink in size either. The wasted space causes three problems:
- The gains that come from caching blocks of data in memory are reduced because fewer records are packed into each block.
- Additional space on disk is required as the database grows.
- Backup and recovery require more time, more space, and more computing resources.
If you are licensed for Diagnostics Pack, you can use the Automatic Segment Advisor to identify tables that would benefit from rebuilding. Alternatively, you can conduct your own investigation of wasted space, using the SPACE_USAGE procedure. Listing 14-1 shows a sample run; you see that 1161 blocks are empty.
Once you have identified tables and indexes that will benefit from compaction, you can reclaim the wasted space using the SHRINK SPACE command, as in Listing 14-2. Note that you have to give Oracle permission explicitly to relocate rows, using the ENABLE ROW MOVEMENT command—Oracle does not do this automatically, so as not to affect any application that has taken advantage of row addresses (ROWIDs).
Log File Maintenance
Log files of all kinds accumulate over time and can fill up the available space. For example, a trace file is created whenever certain errors occur, such as ORA-00060 (deadlock) and ORA-00600 (internal error). Listing 14-3 shows the first few lines from such a trace file.
The log files are organized into an Automatic Diagnostics Repository (ADR), whose location is controlled by the DIAGNOSTIC_DEST setting. Log files are automatically purged after 30 days—you can change the retention window using the SET CONTROL option of the adrci tool. You can also purge log files manually using the tool’s PURGE command, as in Listing 14-4.
![]() Tip Trace files can be very large. The maximum size of a trace file is controlled by the max_dump_file_size initialization setting, whose default value is unlimited. Consider changing the setting to a value that is appropriate for your environment.
Tip Trace files can be very large. The maximum size of a trace file is controlled by the max_dump_file_size initialization setting, whose default value is unlimited. Consider changing the setting to a value that is appropriate for your environment.
Auditing
Oracle provides the ability to audit all aspects of database usage. Audit records can be stored in the AUD$ table owned by SYS or in files outside the database—this is controlled by the AUDIT_TRAIL and AUDIT_FILE_DEST settings. There are a number of useful views on the AUD$ table, the chief ones being DBA_AUDIT_TRAIL and DBA_AUDIT_SESSION. Listing 14-5 shows a sample of the data in the DBA_AUDIT_SESSION table.
When creating a database using DBCA, you can choose to enable auditing for logon and logoff events and certain privileged activities such as ALTER DATABASE and ALTER USER. A number of views can be used to determine which activities are being audited, the chief ones being DBA_STMT_AUDIT_OPTS (which SQL commands are being monitored) and DBA_OBJ_AUDIT_OPTS (which tables are being monitored). Listing 14-6 shows a sample of the data in the DBA_STMT_AUDIT_OPTS table.
Reviewing audit records regularly is a good practice. Note that Oracle does not delete old audit data automatically—that is the responsibility of the DBA. You should consider archiving the data using the exp or expdp utility before you delete it.
![]() Tip The AUD$ table is placed in the SYSTEM tablespace when the database is created. The AUD$ table can grow very large, so the SYSTEM tablespace is not a good location for it—it should be housed in a dedicated tablespace instead. Metalink notes 72460.1 Moving AUD$ to Another Tablespace and Adding Triggers to AUD$ and 1019377.6 Script to move SYS.AUD$ table out of SYSTEM tablespace discuss this issue.
Tip The AUD$ table is placed in the SYSTEM tablespace when the database is created. The AUD$ table can grow very large, so the SYSTEM tablespace is not a good location for it—it should be housed in a dedicated tablespace instead. Metalink notes 72460.1 Moving AUD$ to Another Tablespace and Adding Triggers to AUD$ and 1019377.6 Script to move SYS.AUD$ table out of SYSTEM tablespace discuss this issue.
User Management
The security of the database is the DBA’s responsibility. Here are some simple security rules:
- Passwords should be changed regularly. This is controlled by the PASSWORD_LIFE_TIME, PASSWORD_REUSE_TIME, and PASSWORD_REUSE_MAX settings in the DEFAULT profile. Resist the temptation to relax or disable these settings.
- Shared passwords should be changed when employees are relieved of their responsibilities or leave the company. For example, DBAs typically share the passwords to the SYS and SYSTEM accounts. These passwords should be changed whenever a DBA leaves the organizational group or the company.
- Users should be required to have strong passwords; this is not required by default. Execute the utlpwdmg.sql script from the SYS account to enforce the requirement.
- When a user’s job responsibilities change, their database privileges should be changed appropriately. When a user leaves the organization, their account should be removed from the database.
Capacity Management
Regular capacity reviews are part of good database management. Database size and free space should be recorded at regular intervals—the required information can be found in the DBA_DATA_FILES and DBA_FREE_SPACE views, as shown in Listing 14-7. Database size and free space can also be checked using Enterprise Manager. Space should be proactively added to the database as necessary. You should make growth projections and identify opportunities to reclaim disk space. Capacity management also refers to use of system resources such as CPU and memory. The information in the Statspack reports and tables can be used to track system utilization, or you can develop a simple system that periodically captures system utilization metrics from the V$SYSSTAT table.
Time Series
A time series is a sequence of measurements made at periodic intervals. The Statspack tables contain much time series data and can be used for capacity reviews. The Statspack tables STATS$OSSTAT, STATS$SYSSTAT, STATS$SYSTEM_EVENT, and STATS$SYS_TIME_MODEL are of particular interest—they store snapshots of the dynamic performance views V$OSSTAT, V$SYSSTAT, V$SYSTEM_EVENT, and V$SYS_TIME_MODEL, respectively. As illustrated in Listing 14-8, V$OSSTAT offers cumulative values of various OS metrics such as CPU usage, and STATS$OSSTAT contains snapshots of this data; the snapshots are identified by the SNAP_ID column.
The time series data in the Statspack tables can be manipulated with SQL queries into a format that is suitable for reports and graphs. First you use the PIVOT operator to create a two-dimensional table of the cumulative values (Listing 14-9). Then you use an analytic function called LAG to compute the difference between the values in successive rows (Listing 14-10). The CPU utilization graph shown in Figure 14-1 was generated using the data produced by the SQL query shown in Listing 14-11.
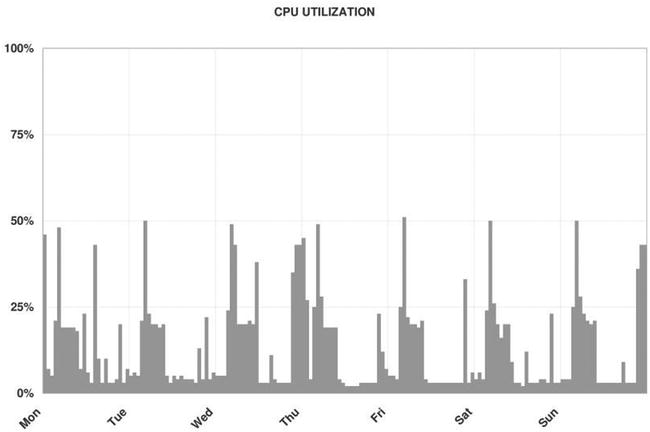
Figure 14-1. CPU utilization graph produced from the data in the STATS$OSSTAT table
There is a wealth of other useful data in the Statspack tables. For example, STATS$SYSSTAT offers cumulative values for Oracle metrics such as logical reads and physical reads; STATS$SYSTEM_EVENT reports the time spent waiting for I/O, locks, and other resources; and STATS$SYS_TIME_MODEL offers summary information such as the total of the elapsed times of all SQL queries processed by Oracle.
Patching
Oracle periodically releases fixes, known as patches, for software bugs. A one-off patch is a fix for an individual bug, whereas a patchset is a collection of numerous bug fixes. A critical patch update (CPU) is a collection of fixes for security-related bugs; Oracle releases one such CPU every quarter. A patchset has an Oracle database version string associated with it; for example, 11.2.0.4 is a patchset associated with Oracle 11g Release 2. By contrast, one-off patches and CPUs are identified by a single number; for example, 7210195 was the number of the July 2008 CPU. One-off patches, patches, and patchsets can be downloaded from the Patches & Updates section of the Metalink customer portal.
Some organizations adopt a policy of applying software patches and CPUs whenever they become available. Listing 14-12 is a typical notice regarding the availability of a new CPU that you will receive from Oracle if you have a support contract.
The notification about a CPU directs you to a web page where you can find more information. Once you have determined the specific patch number applicable to your OS platform, you can download the CPU from My Oracle Support.
CPUs are applied using the opatch utility. Complete instructions are provided with the patch.
Summary
Here is a short summary of the concepts touched on in this chapter:
- Database maintenance is required to keep the database in peak operating condition. Most aspects of database maintenance can be automated. Oracle performs some maintenance automatically: collecting statistics for the query optimizer to use.
- Database backups are the most important responsibility of the DBA. RMAN is the preferred tool for numerous reasons. Recovery testing is vital to validate the backup procedures.
- The query optimizer requires statistical information about the data—for example, the number of rows in each table—in order to generate efficient query plans. This information is collected using the procedures in the DBMS_STATS package. Beginning with Oracle Database 10g, statistical information about the data is collected automatically by a scheduled nightly job; you are free to disable this job in favor of a custom approach.
- Archiving refers to the task of making a copy of old data in preparation for deleting it from the database.
- Purging refers to the task of deleting data that has already been archived.
- Rebuilding refers to the task of compacting tables and indexes from which large amounts of data have been purged.
- Log files and trace files are stored in the Automatic Diagnostics Repository (ADR) and managed using the adrci utility.
- Audit records should be periodically reviewed, archived, and purged.
- Passwords should be changed regularly, shared passwords should be changed when they are compromised, password complexity should be enforced, and accounts should be removed when the owners are relieved of their responsibilities or leave the company.
- The information in DBA_DATA_FILES and DBA_FREE_SPACE can be used to set up a simple system managing disk capacity.
- The Statspack tables STATS$OSSTAT, STATS$SYSSTAT, STATS$SYSTEM_EVENT can be used to produce graphs of system capacity.
Exercises
- Scan your database for corruption using the VALIDATE DATABASE command.
- Determine the start and end times of the maintenance windows in your database. Which maintenance jobs run during these windows?
- Temporarily disable auditing, and move the AUD$ table to a dedicated tablespace.
- Develop a procedure to track the growth of tablespaces and free space. Use the information in the DBA_DATA_FILES and DBA_FREE_SPACE views. Capture the information once a week.
- Explain the autoextensible feature of data files. Is it enabled in your database? What are its advantages? What are its disadvantages?
- Develop a procedure to track the growth of the 20 biggest tables in your database. Use the information in the DBA_SEGMENTS view. Capture the information once a week.
- Using the data in the STATS$SYSSTAT table, create graphs of the following workload metrics: logical reads, physical reads, logical reads per transaction, and physical reads per transaction.
- Download the latest critical patch update, and apply it to your database.
- Locate your database’s alert log and listener log. What do they contain? Create an automated process to manage their size.