
Chapter

Developing Trading System Variations
Even change is never the same.
Introduction
This chapter explores how you can take existing ideas and then develop variations that suit your trading style. In this way, you can build a large collection of trading systems that meet different objectives. Every trader has different beliefs, time horizons, equity limitations, profit objectives, and confidence levels. Hence, few traders are executing precisely the same strategy. Thus you can trade even well-known systems without much difficulty. However, you can gain an edge by developing your variations of well-known ideas. As usual, this is not a recommendation of specific ideas for trading, but an attempt to stimulate your creativity. The focus should be on how each variation changes the structure of the trading system and its response to market data.
We first consider the 20-day or 4-week breakout system, perhaps one of the oldest mechanical trading systems in the business. We set the stage by looking at the results of a 20-bar breakout on the close using two different exit strategies. One exit strategy is a simple x-day trailing exit, but the other is a more complex volatility-based exit. The first variation is using a fixed barrier above the 20-day range. The next step, after a fixed barrier, is to consider systems with a variable or volatility-based barrier.
In an interesting twist, instead of adding, we will deduct a volatility-based “barrier” from the 20-day channel, and examine the statistical significance of these channel breakout variations. All these variations should convince you that it is possible to take a proven idea and then adapt it to your needs or trading style.
We then look at two models based on the ADX indicator. The average directional index measures the strength of price trends. You will see that the heavily smoothed ADX reduces trades without missing major trends. We first test the effects of using a fixed ADX level to trigger the trades, and next, impose the restriction that the ADX be rising. You will see that the absolute level of the ADX is not as significant as its trend.
You may have heard this bit of trading advice, “Buy on a pullback into support.” This advice by itself is not sufficient to build a trading system, but we will discuss a pullback system that works in uptrends as well as downtrends.
This chapter ends with a pattern-based system for long entries only. The deep pass in football inspired the “long bomb” system. With this system you can gather useful patterns off your favorite charts.
We will test these systems without optimization. Model values are chosen at random, before any testing, so that the test results do not bias the selection. The systems are tested on the same data set so you can understand the subtle interactions between system rules and market action. You should try to develop your variations of well-known ideas to find the particular combinations that best suit your trading style and meet your goals.
We chose the markets in Table 5.1 for testing simply because they represent a diverse group that had shown strong trends, periods of volatility, and many consolidations. The tests used an initial stop of $1,500 and allowed $100 for slippage and commissions.
Table 5.1 Summary of markets and test periods used in this chapter.
| Market | Test Period |
| British pound | 2/75-7/95 |
| Coffee | 1/75-7/95 |
| Crude oil | 1/83-7/95 |
| Cotton | 1/75-7/95 |
| Deutsche mark | 2/75-7/95 |
| Eurodollar | 2/82-7/95 |
| Gold | 1/75-7/95 |
| japanese yen | 8/76-7/95 |
| U.S. bond | 8/77-7/95 |
| Wheat | 1/75-7/95 |
Channel Breakout on Close with Trailing Stops
We begin by examining the effect of adding a trailing stop to the usual channel breakout system. Our purpose is to convert the channel breakout logic into a short-term trading system. The logic of the channel breakout on close is probably familiar to you. The symmetrical long and short entry rules are as follows:
- 1. If today’s close is higher than the highest high of the last 20 days, then buy on the close.
- 2. If today’s close is lower than the lowest low of the last 20 days, then sell on the close.
The exit condition is a simple trailing stop placed at the highest high or lowest low of the last few days. In our case, we want to use a 5-day trailing stop. The exit conditions are as follows:
- 3. Exit the long trade at the lowest low of the last 5 days on a stop.
- 4. Exit the short trade at the highest high of the last 5 days on a stop.
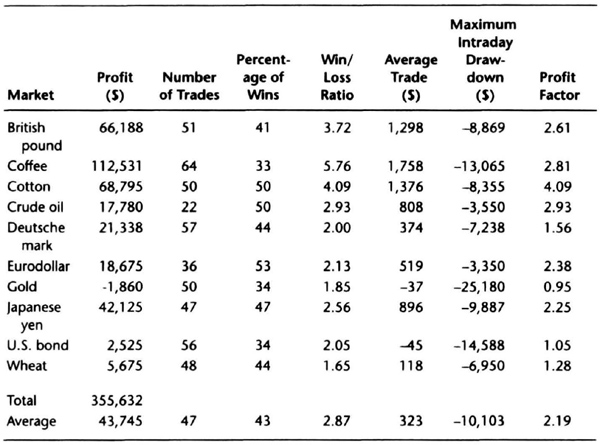
We assume that the market will make quick, decisive moves once it breaks out of the 20-day channel. The implication is that we can use a relatively tight trailing stop to protect most of the profits. A close stop works well in markets that make swing moves. Conversely, this close trailing stop will exit too soon during prolonged trends. You may see more than one trade during long-trending periods because the system will generate a new trade on a fresh breakout beyond the barrier. Table 5.2 gives the results of the historical tests using a $1,500 initial stop, trading one contract per signal, and allowing $100 for slippage and commissions.
The basic 20-bar breakout system is a typical trend-following system, with 36 percent profitable trades and an average win-loss ratio greater than 2. Sixty-three percent of the profits are from just one market, coffee. The average profit factor (the ratio of gross profit to gross loss) is 1.19, so the system produces slightly more profits than losses. The average trade at $112 is barely acceptable, partly the result of staying in the trade for only a short time.
The 2,195 total trades suggest that trading costs and slippage are a significant factor in overall performance. Losses in four of the ten markets tested are a bit worrisome. The average profit is not much greater than the average maximum drawdown, which is another concern.
These tests used an exit on the highest high or lowest low of the last 5 days. The 5-day high or low exit strategy assumes that the market will make a strong move after making new 20-day highs. The following two cases show how this exit works in practice. In the case of wheat (see Figure 5.1), the market was in a choppy uptrend. A choppy uptrend is weak, because the market consolidates after making new highs. Our exit on the 5-day high or low closes out the trade in the consolidation region following new highs. Hence, in the choppy uptrend of the wheat market, there is a string of short-lived trades.
Table 5.2 Historical results for 20-bar breakout on the close with exit on the 5-day high or low.

The next case (see Figure 5.2), presents the ideal trade for the current exit strategy. The coffee market made a strong move upward once it broke out of the 20-day price range. The first significant correction triggered the trailing stop on the 5-day low. Comparing the two cases, we see that the trailing exit works best with swing moves. If you wish to use discretion, you should remember this exit strategy in swing markets.
The limitation of having to specify the number of days to “look back” to set the trailing stop is not ideal. In the next section we discuss how a volatility-based exit overcomes this limitation.
Channel Breakout on Close with Volatility Exit
Sometimes there is a big move against the established trend when a consolidation is at hand. A volatility criterion can pick off the “big” move against the trend. We want a trailing exit for which we do not have to specify the x-day look back period. In effect, we will create a volatility-based trailing stop.

Figure 5.1 The close on the 5-day high or low gives frequent exits in a choppy uptrend in the wheat market.

Figure 5.2 The coffee perpetual contract shows ideal market action for the 5-day trailing exit, which works best with markets that move quickly after a breakout.
There are many different types of volatility-based exits. You can use a 10-day simple moving average of the daily trading range as your measure of volatility. The daily trading range is the difference between the day’s high and low. If the market is trading in a narrow range, then the daily range decreases and volatility decreases. However, volatility increases when the market makes large daily moves. For example, near the end of a swing move, the market will often have a wide range day in the direction opposite the trend. The volatility exit closes a trade when there is a large daily move against the trend.
A “large daily move” is defined as three times the volatility, and is called the big move. The big move is added to the most recent 20-day low for short trades, or subtracted from the most recent 20-day high for long trades. This yields a specific price for setting an exit stop. You can see the volatility exit for short trades in Figure 5.3.
We can now define the channel breakout system with a volatility exit more precisely. The rules are similar to the usual channel breakout system.
- If today’s close is higher than the highest high of the last 20 days, then buy on the close.
- Exit the long trade at the highest 20-day high minus three times the 10-day SMA of the daily trading range on a stop.
- If today’s close is lower than the lowest low of the last 20 days, then sell on the close.
- Exit the short trade at the lowest 20-day low plus three times the 10-day SMA of the daily trading range on a stop.
For our computer tests, we will use a $1,500 initial stop, trade one contract per signal, and allow $100 for slippage and commissions. We can always trade multiple contracts if we wish. Figure 5.4 shows the volatile uptrend in the August 1995 crude oil contract. The system bought one crude oil contract on the usual 20-bar breakout on the close. A sharp key reversal caused a big down day in the middle of the chart, which closed below the two previous closes. Follow-through selling the next day triggered our volatility exit.
The system went long again after a new 20-bar high. The market failed on the retest of a new high for the move, and the sharp drop in prices again triggered the volatility exit. Note that the exit stop is being set by the 20-day high and the 10-day SMA of the daily range. A market can reach this stop price quickly during volatile moves, or slowly drift down to the stop level. Key reversals often occur near the end of a trend or the beginning of a consolidation.
For example, sudden market moves with an expanded daily range occur where there is a consensus among traders about price levels. The daily range expands because many traders make similar adjustments. Conversely, sometimes there is no news or information to drive the market. Prices can then drift in small increments toward the exit stop. The main advantage of a volatility-based stop is that it adjusts to the trading patterns of the market (see Figure 5.5). Of course, you will exit the trade in either scenario if prices trade through your stop level.

Figure 5.3 The volatility exit for short trades trails prices until a big move or reversal closes out the trade.
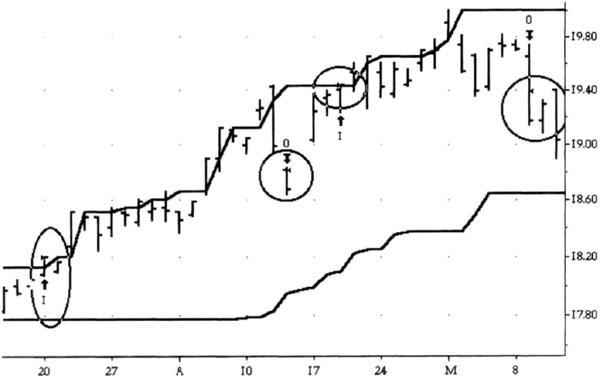
Figure 5.4 Volatility-based exit closes long trades after two big reversals in this crude oil market.
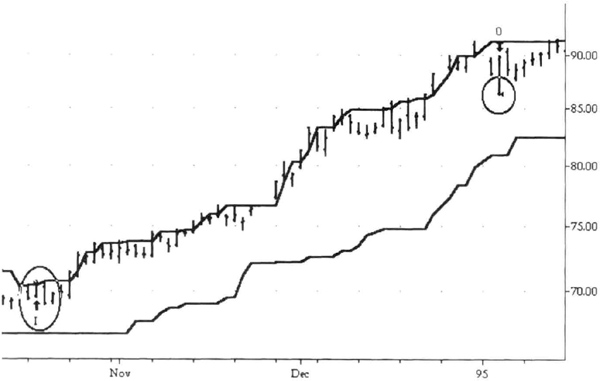
Figure 5.5 The volatility exit often catches long trends, as in the cotton market.
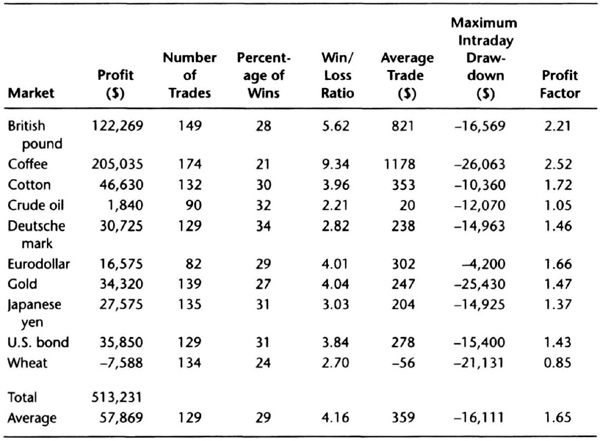
Table 5.3 shows how this exit fared in our tests on past data. These results are a bit better than the tests with a trailing exit on the 5-day high or low (see Table 5.2). The total profits were 25 percent greater using the volatility exit, with 13 percent fewer trades. There were also slight improvements in the profit factor, and a 12 percent reduction in average drawdown. These results are not dramatically different, but the trend toward fewer trades and better profits is worth noting.
So far we have automatically entered a trade just one tick above the 20-day trading range. However, we could reduce the number of trades if we widened the 1-tick barrier. The next section examines the effects of a 20-tick barrier.
Channel Breakout with 20-Tick Barrier
So far our channel breakout on the close stipulated that the close be one tick above the high or low of the previous 20 days. The one tick is simply a barrier level beyond the 20-day trading range. Figure 5.6 uses a 20-tick barrier, instead of the 1-tick barrier. This number is arbitrary; you could certainly test other values. In this case, the decisive close above the barrier led to a strong rally.
Table 5.3 Results for 20-bar channel breakout with volatility exit.

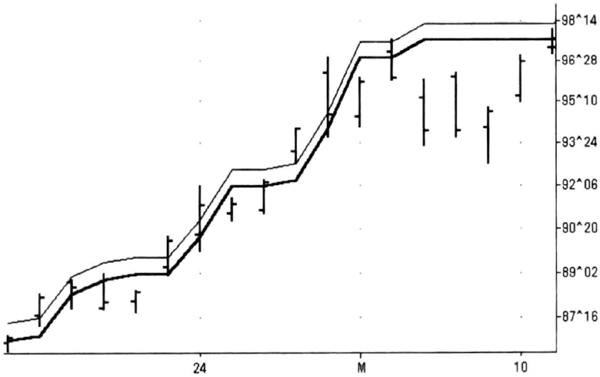
Figure 5.6 The 20-tick barrier for the March 1986 U.S. bond market contract. The thick line is the 20-day high. The narrow line is the 20-tick barrier.
Table 5.4 Results for the 20-bar channel with a 20-tick barrier and volatility exit.

Table 5.4 shows a summary of test results of the system using the volatility exit discussed in the previous section to provide continuity. The initial stop was set at $1,500 and $100 was allowed for slippage and commissions.
The net profit was essentially unchanged compared to the 20-day channel breakout with a volatility exit (see Table 5.3). However, this same profit was achieved with 26 percent fewer trades on average (141 versus 191). The average gain per trade climbed 21 percent, as you would expect with fewer trades. Thus, the main benefit of using a wider barrier is to reduce the total number of trades without hammering profitability.
Note how the results for the U.S. bond market improved from a loss to a profit when we went to a 20-tick barrier. This suggests that many big players are fading the market, say one to ten ticks beyond the previous high or low. Thus, there are many big sellers a few ticks above the previous day’s high, and many strong buyers a few ticks below the previous day’s low. Only when you clear through this interference does the price change become significant.
Table 5.5 shows the results of testing the 20-tick barrier system without any exits, and thus clarifies another aspect of the channel break-out system. Remember that not using any exits converts this system into a pure trend-following system, with symmetrical entries and exits. Thus, the 20-bar long signal is also the 20-bar short trade exit and vice versa.
Table 5.5 Results for the 20-bar channel with a 20-tick barrier and no exit.
The net profits with a barrier but without exits are 50 percent higher with 37 percent fewer trades than with an exit (compare Table 5.4). Surely the basic trend-following system is quite attractive. So it is fair to ask why we should have any exits with the channel breakout. The answer lies in the number of days the systems are in the market, and by implication in the potential risk exposure. If we do not use any exits, the 20-bar breakout system is always in the market. If we add an exit strategy, the system is out of the market some portion of the time. You can expect a reduction in exposure to market risk if the system is often out of the market.
Table 5.6 summarizes the number of days the 20-day channel breakout is in the market with and without an exit. Adding the volatility exit reduces the number of days the system is in the market by 58 percent on average. Thus, there is a significant reduction in potential risk when we add an exit to the channel breakout system. Your account could be earning interest when you are out of the market. Your interest income will also help to smooth out account equity.
Note that the average maximum intraday drawdown was $19,188 with the volatility exit, versus $23,156 without any exits. Thus, there was also a 17-percent reduction in average drawdown by adding the exit strategy, but this could have occurred purely by chance. Thus, the primary benefit of expanding the barrier is to reduce the number of days the system is in the market.
Table 5.6 Adding an exit decreases the number of days a system is in the market.

Ideally, you should base the width of the barrier on market volatility. A fixed barrier may be too far away to trigger trades within the usual range of daily volatility. For example, the 20-tick barrier is too wide for the Eurodollar market. A volatility-based barrier will respond to market action and provide a more consistent barrier across all markets. The next section discusses the effect of using a volatility-based variable barrier instead of a fixed barrier.
Channel Breakout System with Inside Volatility Barrier
In the previous section we saw the effects of a 20-tick barrier that was outside the 20-day price range. The barrier widened the 20-day price range, and helped to filter out some trades. In the case of the Eurodollar market, the 20-tick barrier was much wider than the normal volatility of that market. Hence, the 20-tick barrier allowed only ten trades to pass through, reducing profits and trading opportunities.
This section will show you how to set up a volatility-based barrier. In an interesting twist, we will set the barrier inside the 20-day price channel (see Figure 5.7). We will have more trading opportunities because the channel will be narrower. The width of the barrier acts as a filter that cuts off trades. You should understand the interaction between volatility and channel width very clearly. If the volatility is low, then the relative channel width will widen. However, if the volatility is high, the actual channel width will be narrower. As volatility increases this system will trade more frequently.

Figure 5.7 The inside volatility barrier superimposed on the 20-day channel shows a long trade in the December 1995 U.S. bond market.
Volatility is defined here as the 10-day SMA of the daily trading range. The daily trading range is simply the difference between today’s high and low. Thus, the upper inside barrier is the highest 20-day high minus the volatility. Similarly, the lower inside barrier is the lowest 20-day low plus the volatility. We will go long on the close if it is above the upper inside barrier, and sell on the close if the market closes below the lower inside barrier. The volatility exit is at three times the 10-day SMA of the daily trading range.
Figure 5.8 shows a more detailed view of how the inside barrier works. The actual width of the barrier is narrower, but the width changes every day. The number of trades increases with an inside barrier because the width is narrower than the 20-day channel. Figure 5.8 shows that during narrow consolidations the inside barriers can come close together, or even cross each other. As the inside barriers come close together, the number of trades increases. Thus, the inside barrier system can produce several whipsaw trades in a region of price consolidation.
You may dislike the increased frequency in consolidations caused by an inside barrier system. One of the strengths of the usual channel breakout system is that it tends to produce fewer trades during price congestions. Hence, the inside barrier system will not appeal to all traders.
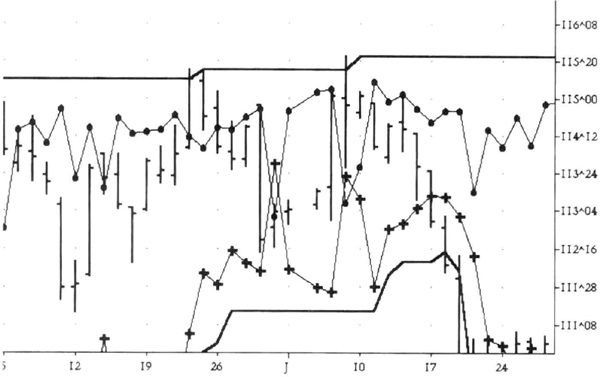
Figure 5.8 The inside volatility barriers come close together during consolidations, increasing trading frequency.
Table 5.7 shows a summary of testing over previous market data. You will notice that the total profits are up 35 percent versus the fixed 20-tick barrier with volatility exit (compare Table 5.4). The total number of trades has more than doubled to 294 over the fixed 20-tick barrier. The higher trading frequency may be attractive to you if your trading costs are low.
Statistical Significance of Channel Breakout Variations
One of the key questions you must ask when you see system variations is whether the differences in the performance are statistically significant. There are many ways to differentiate systems other than comparing their net profits. For example, one system may produce fewer trades. Another system may produce a smaller drawdown. Some systems may have a higher percentage of profitable trades. A variation may be useful precisely because it suits your trading style.
A paired t-test compares the means of two system variables measured on the same data sets. This test will tell you if the means of the two series being compared are truly different in a statistically significant sense. You can find a detailed discussion of the t-test in any book on statistics. For our purpose, the test gives two numbers: a t-statistic for the data and an appropriate reference value (t-critical). If our t-statistic is greater than t-critical, then the difference in performance is statistically significant. The Microsoft Excel® 5.0 spreadsheet has a built-in t-test in the Tools menu under Data analysis.
Table 5.7 Results for 20-day channel breakout system with inside volatility barrier and volatility exit.

We need a reference or standard system for comparison before we can use the t-test. Here we use a 20-day channel breakout system without any exits as the reference system. If you do not use any specific exits, you have a system in which long entries are short exits and vice versa. Thus, the effects of adding exit strategies should be easy to measure against this reference system. Table 5.8 summarizes the results of testing the 20-day channel breakout system without any exits on the previous data. As usual, there is a $1,500 initial stop and $100 allowance for slippage and commissions.
Let us examine the effects of adding the 5-day high-low trailing stop to the reference system (see Table 5.2). In comparing the net profits from each system, the t-statistic was 2.224 and the t-critical value was 2.262 with 9 degrees of freedom. Thus, the t-statistic was smaller than the reference t-critical value. The average profit for the reference system is $51,368 versus $27,949 with the trailing exit. At the 5-percent level, this difference barely missed being significant. Hence, adding the exit probably significantly reduced average profits. The spreadsheet calculations are given in Table 5.9.
Table 5.8 Historical results for 20-bar breakout on the close without any exits.

Table 5.9 A summary of the t-test comparing the reference system to the CHBOC with 5-day trailing stop.

Table 5.10 T-test comparing number of trades from reference system and with 5-day exit.

Table 5.10 compares the number of trades from each system. The average number of trades was 220 with the trailing exit (see Table 5.2), and 118 with the reference system (see Table 5.8). The t-statistic for the number of trades was 8.05. The t-critical value is 2.262, confirming that there is a statistically significant increase in the number of trades. Therefore, the total number of trades increases significantly when we add a trailing exit.
You can now combine the results from these two comparisons. Those results say that adding a trailing exit at the 5-day high-low significantly reduced profits by 30 percent while increasing the number of trades by 76 percent. Now you have to decide if these changes suit your trading style.
Next we examine the effects of adding the volatility exit to the reference system (see Table 5.3). There is a statistically significant (t-statistic: 2.54 > t-critical: 2.26) reduction in average profits from $51,638 to $34,820. Thus, the 33-percent reduction in profits occurs with a significant 61-percent increase in the total number of trades (t-statistic: 8.82 > t-critical: 2.26). Thus, the volatility exit reduces profits and increases trading frequency. Of course, it introduces a neutral zone, and should reduce your overall market exposure. You may like this exit because it responds to a particular exit pattern, such as a large countertrend move. Some traders may prefer the equity curve produced by this exit to the equity curve of the reference system. Others may like the higher trading frequency because it means they will get many opportunities to trade.
The effect of using the 20-tick barrier did not produce a statistically significant reduction in net profits when tested without any exits (see Table 5.5). The average profit per market was $51,638 with the reference system, and $49,989 with the 20-tick barrier. Thus, adding the barrier did not reduce profits significantly. However, it did reduce the number of trades by about 25 percent, which was statistically significant (t-statistic 4.71, t-critical = 2.62), suggesting that the barrier acted as a filter.
The effect of adding a volatility exit to the 20-tick barrier (Table 5.4) also produced no statistically significant difference in net profits. However, the number of trades was significantly higher. You will have to examine the equity curves to decide if you like the effects of adding the exit.
There was no significant difference in performance between the reference system and the breakout with the inside volatility barrier (Table 5.7). For example, the average profits with the 20-tick barrier are $51,638 versus $44,732 with the inside volatility barrier. However, the number of trades was 60 percent smaller without the inside volatility barrier. The inside volatility barrier produces a statistically significant increase in the trading frequency. Thus, the inside barrier will whet your appetite for frequent trading without a large performance penalty.
The analysis of this section shows that you should use a statistical test to verify that the differences in performance are statistically significant. You can use a spreadsheet for your statistical analysis, or you may use specialized software. You should carefully note how changing exit strategies changed the profits, trading frequency, and drawdowns. Thus, you can easily match an entry signal to your trading needs.
Two ADX Variations
The average directional index is a widely used measure of trendiness. A test of two small variations of an ADX system showed that the absolute value of the ADX has no particular significance. The test used a $1,500 stop and allowed $100 for slippage and commissions on the following markets: British pound, coffee, cotton, crude oil, deutsche mark, Eurodollar, gold, Japanese yen, U.S. bond, and wheat. All available data from January 1, 1975, through July 10, 1995, were used.
The first system tested entered long or short when the 14-day ADX value crossed over 30. A crossover occurs when yesterday’s value is less than 30 and today’s value is more than 30 for the ADX. If the 3-day SMA of the close is greater than the 20-day exponential moving average, then the system buys on the next day’s open. Conversely, if the 3-day SMA of the close is less than 20-day exponential moving average, then the system sells on the next day’s open. The initial stop is at $1,500 and there is a $100 allowance for slippage and commissions. The exit signal was a trailing stop at the highest high or lowest low of the past 20 days.
The second variation does not rely on the absolute value of the ADX; it requires only that the ADX be rising. The ADX was assumed to be rising if it was higher than its value 28 days ago. Otherwise, the rules of the two variations are identical. The results are summarized in Tables 5.11 and 5.12. The rising ADX system seems to be more profitable than the ADX > 30 system. A t-test determined that the difference was indeed statistically significant, since t-statistic was 2.76, greater than the t-critical value of 2.26.
Table 5.11 Results for ADX > 30 trading system.
These results show that the trend of the ADX is more useful than the absolute value of the ADX. However, using a value such as ADX > 30 is a restrictive condition that reduces the number of trades significantly. You will find that the ADX > 30 system is in the market for only 40 to 45 percent of the time spent by the rising ADX system. Therefore, the losses and drawdowns are smaller for the ADX > 30 system. Thus, both approaches have their strengths and weaknesses, and your choice will reflect your trading preferences.
Figure 5.9 and Figure 5.10 will help you visualize how the two systems work. Figure 5.9 shows the entry due to an ADX rising system in the November 1995 orange juice contract. The ADX indicator along with the reference level of 30 appear in the lower half of the figure. It may appear that the ADX has turned down, but it is rising on a longer time frame of 28 days. Figure 5.10 shows the entry after ADX has crossed over the 30 level. The entry signal from the ADX>30 system came 3 months after the signal from the ADX rising system. You should expect such delayed entries because the ADX is a heavily smoothed indicator. Clearly, trading styles and preferences will govern which entry method you prefer.
Table 5.12 Results for ADX rising trading system.


Figure 5.9 The entry point derived from a rising ADX entry system for the November 1995 orange juice contract.

Figure 5.10 Note how the ADX > 30 entry occurs almost 3 months after the rising ADX entry in Figure 5.9.
The ADX logic assumes you are trying to confirm the presence of a strong trend. These entries could occur after prices have made a small move, since the heavily smoothed ADX takes several days to react to changing prices. Many traders do not like to buy on strength or sell on weakness. These traders prefer to lower risk at entry by buying a pullback or selling a small bounce in prices. In the next section we review a variation that tries to trade the “pull-back” in prices.
The Pullback System
An old market maxim says, “Buy on a pullback into support.” Many traders like to trade the pullback because it often provides an entry point with relatively low risk. Contrast this philosophy with trading the ADX systems, which buy on strength or sell on weakness. The pullback maxim, however, is not a precise statement of a trading system. We have to define what we mean by pullback and what represents support. This system is a variation of the CB-PB system examined in Chapter 4. Here the pullback is defined relative to a moving average rather than after a 20-day breakout.
A pullback is simply a minor correction within an uptrend. The pullback itself could take many forms. For example, you can define pullback as three consecutive down days. Perhaps you can define pullback as a “return to support” by a moving average. You can pick a variety of averages, such as a 20-day or 50-day simple or exponential moving average. The term “return to support” is vague—you must decide if prices must touch the average, go below the average, or get within 1 percent of the average. Once you agree what “pullback” and “support” mean, you must then decide at what point to place your buy order. For example, you could buy at the next day’s open, the next day’s high, or at the 5-day high. Picking a precise definition will allow you to build many variations of this system.
We want to build a system that recognizes a retracement in both downtrends and uptrends. We will define a pullback as a new 5-day low in an uptrend or a new 5-day high in a downtrend.
Next, we must define the trend. We will assume that if the trend is up, the low remains above the d-day SMA when the market makes a new 5-day low. Similarly, the high will remain below the d-day average when the market makes a new 5-day high. We arbitrarily pick a 50-day SMA as the reference moving average because the prices will stay above or below this average during strong trends. Thus, the trend is defined as up when the market makes a new 5-day low but the low remains above the 50-day SMA (see Figure 5.11). The matching condition for the downtrend is that the new 5-day high remains below the 50-day SMA.

Figure 5.11 The pullback system had many entry points into the strong uptrend in the June 1995 U.S. bond market. The solid line is the trailing 20-day low. The 50-day SMA is shown by crosses.
Table 5.13 Results for pullback system: new 5 day low above 50-day SMA or new 5-day high below 50-day SMA; exit on trailing 20-day high or low; $1,500 initial stop, $100 S&C.
You can imagine other variations of this system. For example, you can add a trend filter, using the ADX as suggested by Connors and Raschke (see bibliography for reference). They suggest using a 14-day ADX value greater than 30 and using a 20-day exponential moving average. Another option is to use a 14-day RSI or stochastic oscillator and to look for reversals. For example, you could look for the stochastic to fall below 20 and then rise above 20 to define the buying point.
The results of tests of the pullback systems using the same data sets as for all other systems in this chapter are shown in Table 5.13. We again used a $1,500 initial stop and allowed $100 for slippage and commissions. The entry was on the open after a new 5-day low above the 50-day SMA and vice versa. The exit was on the trailing 20-day high or low. The basic idea of the pullback system seems valid when you consider its profitability over a wide range of markets. The 20-year test period also confirms that the pullback system will find profitable trades in the future.
The percentage of profitable trades is relatively low, about 20 to 30 percent. However, the low win ratio is offset by the high average win-loss ratio. The drawdowns are moderate compared to other systems we have studied. The pullback system seems to work best in markets that have regular corrections within choppy trends. The pullback system also likes markets that make swing moves. Note, for example, the small loss in crude oil and the small profit in the U.S. bond market. The other trend-following systems discussed in this book have tested poorly on these markets, which often have choppy trends.

Figure 5.12 The choppy trend in live hogs triggered the system entries but did not generate significant profits. This is a common problem in choppy markets, and your exit strategy becomes even more important.
In keeping with its design philosophy, the maximum drawdown figure is substantially smaller than in other trend-following systems. However, the results in Table 5.13 are not as attractive as some of the trend-following systems we have seen. The reason is obvious in the live hogs chart shown in Figure 5.12. The market did not make profitable swing moves after retreating to the 50-day average. Your exit strategy is more important in such markets that bounce weakly off the 50-day average. You can experiment with your favorite exits, or use discretion.
So far we have not taken advantage of a key design feature. Since we are buying or selling after a pullback, we hope to get a low-risk entry point. A low-risk entry point is ideal for using a variable-contract money-management strategy. If you can risk $10,000 per position signaled by the pullback system, then trade up to a maximum of ten contracts using the 5-day high-low range as the measure of volatility. In Table 5.14, we traded a new 5-day high or low beyond the 50-day average. The exit was placed at the 20-day trailing high or low, and we used a $1,500 initial stop, and charged $100 for slippage and commissions.
Table 5.14 Results for pullback system with a maximum of ten contracts.
There is a striking difference in performance among a one-contract strategy and a variable-contract strategy with a ten-contract limit. The profits of the latter strategy were more than six times greater. However, the drawdown increased almost eight times on average, so the gains come at a price. Note that the drawdowns are still smaller than always trading ten contracts. Thus, the variable-contracts strategy could be better than trading the equivalent number of fixed contracts. You can test other variable-contract approaches with this entry strategy to match your preferences.
In summary, the basic idea behind the pullback system is valid. It has relatively high win-loss ratio and average trade. You could try to add filters to improve system performance. You should consider a variable-contracts money-management approach to exploit the low-risk entry points.
The Long Bomb—A Pattern-Based System
Many a football team has lived, and died, by the “long bomb.” In American football, this is a pass play designed to gain big yardage by going deep down the playing field. A successful long bomb can rekindle enthusiasm in your team, demoralize the opposition, and even get a quick score when little time remains. It is a gutsy play, but not without some risk. This section discusses a pattern-based system inspired by the philosophy of the long bomb. Pattern-based systems allow you to react immediately. However, the patterns do not repeat frequently, and the market does not have to follow through on the pattern each time. You must also be careful when you test the pattern to use a sufficiently large data set.
The long bomb is a 5-bar, bottom-picking pattern. It is related to market action near double bottoms. The usual sequence is that a market probes for a bottom. As big players sense a bottom, they buy in “bulk” and produce a sharp rally. Other traders feel this may be an opportunity to short, and the smart-money–led rally is thwarted by short-sellers late to the party. As a result, the market retests the prior bottom. If there is no significant selling on the retest, the market is ready to resume an upward move, and does so with a strong surge. The strategy here is to get in during the upsurge—a simple enough idea. As it bursts out of the base, the market closes above the highs made over the past few days. If the following conditions are satisfied, buy tomorrow just above today’s high:
- Today’s close is greater than the high of 2 days ago
- Yesterday’s close is greater than the high of 3 days ago
- The close 2 days ago is greater than the high of 4 days ago
This relationship is perfectly general with no market-specific assumptions. In addition, there is no need to optimize the system. The following twist makes this system interesting. Suppose you buy multiple contracts, betting $10,000 per trade. You can use the difference between today’s close and the 5-day low, convert this “range” into dollars, and calculate the number of contracts. Thus, if the “range” is $2,000, you will buy five contracts and use a $10,000 hard-stop on the position. Here is another twist. You will exit at the trailing 50-day low to get a long-term system.
By now you should understand why the name of the system is the long bomb. By buying multiple contracts and using a very slow exit, we are following the TOPS COLA strategy, and, in football parlance, going deep.
The Power Editor code for Omega Research’s TradeStation™ software is:
input : dx (50) ;
   Vars: Numc(0);
   if C - lowest(low, 5) <> 0 then
   Num C = intportion(10000/((C-lowest(low, 5))*Big
      Pointvalue)) else NumC = 1;
   Condition1 = c > h[2] ;
   Condition2- c[l] > h[3];
Condition3 = c[2] > h[4];
   If Condition1 and Condition2 and condition3 then buy
      (“123 Signal”) NumC
   contracts at high + 1 point stop;
   Exitlong at Lowest(low, dx)[1] - 1 point stop;
An input, dx, which is the number of days in the exit, allows us to experiment with the exit strategy. Just before we calculate the number of contracts, we should double check that today’s close is above the 5-day low to avoid division by zero. The three conditions specifying the pattern are entered as inequalities. If the entry conditions are satisfied today, we will enter tomorrow just above today’s high on a buy stop. Hence, we could see some slippage if the market opens beyond our stop, but this barrier entry condition acts as a filter and reduces the number of trades.
Figure 5.13 shows how this entry condition looks on a real bar chart, using the March 1995 Eurodollar contract just after a significant market low. The long-bomb pattern went long just after the retest of the low, after the first bounce. Notice that there was no retracement after entry: like the long bomb, it was up, up, and away. A similar pattern is shown in Figure 5.14 for the December 1995 heating oil contract.
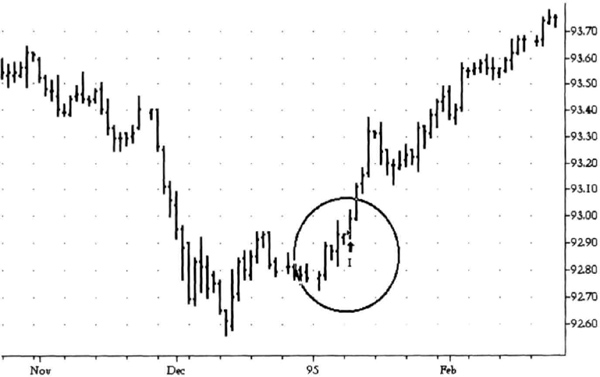
Figure 5.13 The long-bomb pattern enters as the Eurodollar accelerates out of its major bottom.
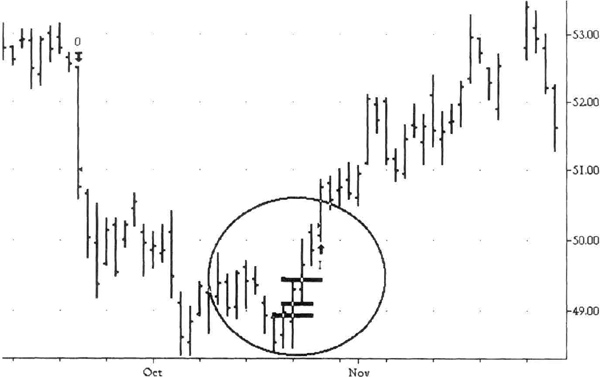
Figure 5.14 The long-bomb pattern in the December 1995 heating oil contract. The entry point saw good followthrough with little retracement.
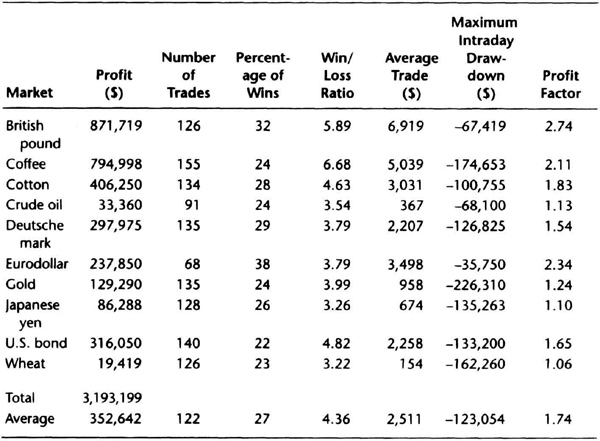
Strange as it may seem, you will find that the long-bomb pattern occurs frequently at market bottoms. Table 5.15 gives the results of long-term testing over 10 markets. The period chosen is from January 1, 1982, through July 10. 1995, a 14-year period that spans a variety of market conditions. The results would be even better if we included a longer test period. We used a $1,500 stop, allowed $100 for slippage and commissions, and exited at the trailing 50-day low. We also calculated multiple contracts for a $10,000 investment, as explained above.
Table 5.15 does not show the fact that the average win/loss ratio was well above 3 for most of the markets. The results show that this system was profitable with multiple contracts, with considerable potential for drawdown. You can test a variety of exit strategies with this entry. You could also derive and test other patterns, such as a 3-bar pattern or 20-bar pattern.
Note here that we have around 30 trades in each market. If we assume that all markets are equivalent, we have 330 trades in Table 5.15, giving us reasonable confidence about system performance. Observe that these 330 trades occurred over a period of 14 years, averaging 24 trades a year, perhaps two a month. This may be a relatively low frequency for most trading programs. Hence, you should strive to develop a large portfolio of patterns, so that you will generate perhaps ten or more trades a month.
Testing patterns can be interesting, but must be done carefully. For example, there are a large number of candlestick patterns with tantalizing names and exciting descriptions. However, they often do not withstand thorough testing. The long-bomb pattern shows that you do not need complexity to achieve your means—just a particular market intuition.
Table 5.15 Long-term results for long-bomb trading system.

Summary
In this chapter we saw how you can develop variations on a theme. We saw how the profit, trading frequency, and drawdown change with different exit strategies using the channel breakout system. Once you find a variation you like, you can use statistical tests to verify that the changes in performance are significant. We explored two variations on the ADX idea. The tests showed that the trend in the ADX is more useful than a fixed value, such as 30, in designing trading systems. We then saw a variation of the CB-PB system for long and short trades. In this case the pullback was referenced to a moving average rather than to the 20-bar channel. Lastly, we looked at a bottom pattern that is a variation of the usual double bottom formation. That example illustrates how you can take widely recognized patterns to form your own variations.
In this chapter we explored how you can easily develop variations of well-known ideas. Once you know that the results are statistically significant, you can evaluate how well they fit your trading style. In this way you can develop a large collection of systems for trading.