
Chapter

A System for Trading
A speculator’s trade plan is often little more than greedy entries, hopeful risk control and fearful exits.
Introduction
Trading is analysis in action. If you thought building a trading system was easy, here comes the difficult part: implementing it. In this chapter we examine the factors you should consider when you implement your trading system. If you have followed all the principles outlined earlier, you have created a trading system that is just right for you. Now, all you have to do is to execute it. We will attempt to close the gap between system design and implementation. Hence, in this chapter we focus on a system for trading.
Surprisingly, there are only two steps necessary to implement a trading system: (1) you need to have a specific trading plan, and (2) you need to execute the plan. You will be surprised how easy it is to trade without a plan and without a system to monitor implementation.
The first hurdle you must overcome is that system testing does not solve all your problems. Second, you must understand something about your interaction with the markets when you start trading. Third, there are other key issues such as risk control and money management that need attention. Last, you need a tool to organize your trading.
The Problem with Testing
Even though trading occurs in a pressure cooker of emotion, testing is performed in an emotional vacuum. Imagine an aerodynamically slick race car designed in a wind tunnel that handles poorly in the turbulent wake of other cars on race day. Similarly, a high-performance system based on historical data can provide a bumpy ride in actual trading.
Your computerized system testing occurs unemotionally, without any fear of losing money. All you see are a summary of the results and colorful up or down arrows pointing out entries and exits. You do not have to suffer through losing streaks during testing. Nor do you have to agonize as the system is late to enter or slow to exit. You do not have to create orders, enter orders, track fills, remember rollovers, monitor margin, or read the daily equity run. What is more important, you do not have to actively monitor position risk or make any money management decisions.
During computer testing, you do not have any fear of losing money or missing opportunities. Thus, system testing using software is a sterile environment that fails to capture the emotional components of system implementation. Hence, if you use all your creativity to develop a trading system that considers all the factors we have discussed, then all you have to do is to focus on system implementation.
Trading is an acquired skill. Perhaps the only way to acquire and maintain a new skill is to endure endless repetitions. Computerized testing does not allow you to build any skills in implementing the system. Thus, no amount of testing can give the repetitions needed to develop the many skills necessary to physically implement a system. Clearly, you need some more tools to address these key limitations of system design and testing.
Paper Trading: Pros and Cons
A traditional answer to the limitations of system design is to use a trial period during which you trade the system “on paper.” Paper trading will certainly help you address and understand the mechanics of actual trading. You can practice all the steps of implementing the system, such as creating portfolios, generating orders, tracking fills, monitoring risk, and scoring profits and losses. In addition, you can keep a diary of your emotions, which is very useful to track your trading beliefs and patterns.
Another valuable way to use paper trading is to analyze your system results trade by trade. You should try to relive the trades, scanning through the chart one day at a time, writing your reactions to chart patterns, equity levels, volatility, and so forth. Even though this is not a perfect solution, reviewing historical trades in detail will give you valuable insight into system performance. The extra insight will enable you to deal with the ups and downs of the system in actual trading.
However, paper trading does not tell you much about actual system performance. Thus, you will gain little additional insight into system performance that you have not already gleaned from system testing. Let us assume that during testing your system produced eight successive losing trades. If the system produces three successive winning trades during paper trading, this does not mean it is a great system. Similarly, if it generates ten successive losing trades, it does not mean it is a useless system. Precisely because successive trades are unrelated, you cannot use the results observed in paper trading to make sweeping generalizations about overall system performance.
Another disadvantage of paper trading is that it still lacks the fear of losing that afflicts trading with real dollars. Thus, paper trading can still insulate you from the emotional demands of real trading. In spite of these limitations, paper trading offers a reasonable means to close the gap between system design and implementation.
Do You Believe in Your System?
The market will challenge your faith in your system in every way possible. The market uses the well-known maxim of war: “Lure them with greed, conquer them with confusion.” The markets will constantly create new chart patterns that can confuse your analysis. Unless you have absolute faith in your system, the markets will push you to meddle with your system. They will push you to override your signals, alter your plans, bend your system rules, invent new exceptions—all in the name of “improving performance.” The only place to improve system design is with rigorous back testing and prospective paper trading. Any untested deviation provides short-lived gratification, which can seriously erode long-term performance.
You should pour all your creativity and emotional needs into creating a system that works for you. Your system should have the time horizon, trading frequency, market sensitivity, and profitability that you consider essential. Once you have rigorously tested the system on historical data, you should test it on scrambled data. You will quickly discover the type of markets the system likes and dislikes when you test it on scrambled data. You will also have greater confidence in the system’s future performance by testing it over many sets of scrambled data. You can follow up system testing with paper trading to clarify the mechanics of the process. Once you are satisfied that this is the system you want, you should resist all unchecked attempts to modify it.
The markets push you to reexamine your faith in your system. You should not use a system unless you can reaffirm your full faith and confidence in that system every day. If you do not believe in your system, the market will quickly push you into deviating from it. Once you deviate from a system, you are trading an untested system, and all bets are off. Of course, you can ask why you should stick to a tested and true system. The answer is found in the next section.
Time Is Your Ally
The market giveth, and the market taketh away. You should recognize that in all markets, there will be time periods when money is easily made and other periods when most models will show losses. Your goal, as a system trader, is to survive the unprofitable periods so you can enjoy the good times when they roll around. In essence, your risk-control strategy, money-management practices, and overall system design will all play major roles in determining your ability to survive difficult market conditions. Hence, it is advantageous to take the long view and remember that the current trade is just one of many to come. Therefore, you need not get emotionally involved in the outcome of each trade.
Suppose you are trading many markets and more than one system in a diversified trading account. Let us assume that your average probability of winning is 35 percent. Since we can show that successive trades are independent, the probability of having ten successive losing trades is (0.65)10, or 0.0135, or 13 in 1,000. Thus, if you opened 1,000 new accounts, only 13 of them would show ten successive losing trades. Now, suppose you put on the trades all at the same time. If you risked 2 percent per trade, you will experience a 20-percent drawdown at the very beginning about 13 times in 1,000 attempts. If you risked 1 percent per trade, your chance of reaching a 20-percent drawdown is approximately 18 in 10,000.
A 20-percent loss of capital, although not pleasant, is not irreversible. You should also recognize that unlikely events can and do occur. Thus, do not get emotionally involved in each gyration of every trade. You should take the long view: enforce rigid risk control, follow money-management guidelines, and focus on implementing your system.
No Exceptions
A good way to assure long-term success is to follow your system without exceptions. If you want exceptions, write them down and test them thoroughly instead of relying on your intuition alone. If you want to override your model, it probably means you are not comfortable with it and should do more testing and refining.
Many traders will use rising volatility as a measure of impending market change. They will reduce their positions when volatility is “high.” You should define this scenario precisely. For example, you could say that volatility is ”high” if the 50-day standard deviation of closing prices is more than $1,500. Then, you could test historical price data to check what the markets have done when volatility has risen to this level.
You could choose to increase market exposure to 4 percent of account equity if conditions are “right.” Instead of relying on intuition, you could define a specific condition as “right,” such as a 25-bar breakout accompanied by a 5-day RSI value greater than 70 or less than 30. You can then check historical data and develop some statistics on what to expect.
We saw in the tests with the 65sma-3cc model in Chapter 4 that only 4 percent of the trade were the home runs that made all the difference in portfolio performance. If you routinely deviate from your system, there is no assurance that you will not manage to miss all the important trades in a given period.
The no-exceptions policy is necessary for another reason: traceability, which is discussed in the next section.
Full Traceability
You should be able to trace back in time the precise reasons for a particular trade or trading action. For example, you should be able to recall why you made a particular trade or move. If you have a well-defined mechanical system, and you follow a strict policy of no exceptions, then you have assured traceability.
If you use subjective chart analysis, then the best way to understand your trading patterns is to keep a diary and a copy of your charts. You should record all the emotions and analyses you used to make a certain decision.
If you have no traceability, you will have little information to monitor your implementation, and you will lose valuable information that could improve your trading. Let’s assume you have a tendency to get in late and get out too soon. If you do not keep detailed records, it is difficult to correct such tendencies. If you have good records, you can calculate the impact of your late entries and early exits. Specifically, you can determine the type of market conditions that push you into exiting early. Say you find that a sharp 3-day sell-off often pushes you to exit your trades. Then, after a brief consolidation, the markets have resumed their previous trend. You now have reliable information you can use to overcome your fear that every 3-day countermove is going to escalate into a major correction.
Traceability is also important if you notice errors in your account statements and want to get them corrected. For example, your broker may fail to report a fill, or give you a fill far away from your desired prices. If you have good records, it is relatively easier to make the changes you desire. If you called in to check a fill and were given a certain fill price, but your equity run shows a different fill price, or worse, does not show a fill at all, you can correct such mechanical errors if you keep good records.
”Guaranteed” Entry into Major Trends
Over the long run, your overall performance will be greatly influenced by less than 5 percent of your trades. You only have to miss a few big trades to seriously degrade overall performance. Your entry method and trade implementation should be focused on ensuring entries into the major trend. If one does not have a position in a particular market, that seems to increase the odds for the onset of a major trend.
When you design your system, try to use orders that will ensure you an entry into the desired trade. For example, an order to trade at the market, trade on the open, trade on the close, or trade on a stop will usually get you into a trade. Of course, the amount of slippage will vary, but if you are not doing great size, you will consistently enter the trade. If you rely on limit orders, you could easily miss a major trading opportunity by a few ticks. The cost of a lost opportunity is often greater than the few ticks you save using a limit order. However, if you are trading liquid markets and have a real-time data feed, you could try to fine-tune your entries. But for most traders, an order entered with a broker seems to work best.
The greatest slippage occurs not in the markets, but at the source: with the trader. If you fail to place an order, or place a wrong order, or place the order incorrectly, then these errors will often cost you more than any slippage in the markets. Hence, you should strive to control slippage at the source. The no-exceptions policy will help to reduce slippage at the source.
It is a good idea to prepare an order entry sheet the previous day, and transmit it to your broker before the markets open. There are many advantages to preparing your orders when the markets are closed. (1) You can create your order entry sheets calmly and unemotionally. (2) You can stick to your trade plans and avoid deviations. (3) You can double-check your orders for mechanical errors. (4) You can avoid trades made at the spur of the moment, without detailed analysis. (5) If you do plan subjective trades, you can write down detailed entry points or exit points, or other cues for trading. You can ensure entries into major trends by preparing your orders in advance and entering them before trading begins for the day.
Starting Up
When you begin trading your account for the first time, you must resolve some “start-up” issues. Let us assume you are using a mechanical system, and trading 20 markets. The first question is how to put on trades to match existing positions of your trading system. For example, the last signal in deutsche mark may be a buy signal that occurred 15 days ago. Now, should you put on the long position, or wait for a new signal? The preferred approach is to put on all positions as soon as possible, scaling them by the current volatility. You may not want to wait for the next signal if your system trades infrequently. Another reason to put on the trade immediately is to capture the remainder of the current move. There are several other ways to resolve this issue. (1) You can trade just one contract instead of multiple contracts. If you usually trade ten contracts, you can initiate your position with just one or two contracts to enter the position cautiously. (2) You can scale into the position. For example, you would buy ten contracts gradually over the next 5 days. (3) You can wait for the last day of the month and put on the entire position on the close. The benefit of putting on the position on the last trading day of the month is that then the month-to-month equity changes will accurately reflect the actual system results.
You must also decide where to place your initial stop on a start-up trade. You can go with the usual initial stop at 1 or 2 percent of account equity. Your other option is to set it slightly wider than usual, but trade a proportionately smaller number of shares.
Risk Control
It is essential that you always maintain rigid risk control. Your risk control strategy may be entering a stop-loss order every day, and with each new position. You can also use more elaborate strategies around market correlation and volatility. The key is to always control your risk. Risk control and money management go together. Using good money management guidelines will place reasonable limits on position size and promote diversification. These will prevent one bad trade from wiping out your account.
Do You Have a Plan?
You should avoid trading without a plan. A common cause for trading problems and failures is the lack of a trading plan. Your trading plan should explain clearly how you will trade. You must specify the markets, number of contracts, type of orders, entry rules, exit rules, and risk-control rules. The more specific you can be, the easier it is to implement the plan. If you have specified and designed your system properly, defining and implementing a plan should be relatively easy.
Every football team makes elaborate plans for their games. For example, one championship football team would “script” the first 15 plays for every game. After careful research, the coaches would pick the first 15 plays ahead of time. Then, the players would practice these plays many times so that they all knew them well. On game day, every one could concentrate on executing those plays, with excellent results. This example points out the benefits of preparation. You can plan your trades, visualize how you will execute those trades, and then monitor how you executed the trades. This process of auto-feedback can help you improve as a trader.
You should plan for adversity. For example, are you ready to absorb a 20-percent drawdown in equity? Do you have a plan to cope with this sort of drawdown? For example, you may not be prepared to experience a 20-percent drawdown in the first 3 months of your trading. If such losses occur, would you modify your trading system, change your money-management and bet-size algorithms, or change the portfolio mix? Similarly, if you are up 20 percent, will you alter any of the same variables?
Scenario planning is common in the military across the world. You, too, should use your imagination to explore good and bad scenarios about your trading. You can then develop detailed plans that will help you cope with the ever-changing markets.
How Will You Monitor Compliance?
It is one thing to have a plan, and another to actually implement it. You cannot properly implement a plan if you do not have a way to monitor and record how well you are implementing your plan. A good way to measure compliance is to keep a daily diary. An electronic diary is a fast and easy way to record your compliance or deviations. Later, you can analyze the diary entries to measure how well you are executing your plans. You can also find out which elements are easy or difficult for you to implement. You can then work to strengthen your weak spots.
If you do wish to deviate from your system, write down your reasons in detail, and then test them rigorously. That is the best approach to ensure consistent, long-term performance. Let us suppose there is a news event or political development that suggests you should exit the position. You should observe a noticeable market reaction to such events, such as a gap, a large range day, an outside day, or a key reversal day. You can then identify such bars on daily data and test them systematically. This will give you a historical database to formulate your strategy.
Get It Off Your Chest!
One big plus of keeping a diary is that you can get your concerns off your chest simply by writing them down. Let us say you wanted to apply the ideas of total quality management or continuous improvement to your trading. You must have detailed records of your trading, including how your orders were generated and what factors affected your implementation. You can keep a diary to getrid of any bottled-up emotions resulting from trading. A diary will add to the full traceability we discussed above by providing data on your emotional state.
Focus on Your Trading
It is difficult to avoid distractions and to focus sharply on your trading. Focus means you can execute your system without deviations. Focus means you can enter your orders, follow your risk-control guidelines, and reduce variations from your system. If you have a plan and a system you believe in, it is easier to focus on your trading. You should try to automate your analysis and order generation as much as possible. This will minimize variations from your system. Try to develop a routine that includes checking account equity, fills, new orders, rollovers, trailing stops, market volatility, and so forth.
The best way to focus on your trading is to separate analysis from trading. You should set aside a fixed time each day when you generate your trading sheets. You should try to be relaxed when you are generating your sheets. You should avoid circumstances that affect your concentration, since it is easy to make a mistake in your order entry process.
Applications of Sports Psychology in Trading
Sports are often used as a metaphor for trading. After a winning trade, traders are quoted as saying that they “vanquished” the market. Conversely, a losing period brings out comments to the effect that the market “beat me.” Many similarities exist between trading and participating in sports, with the exception that trading is rarely a team sport. For example, the mental focus needed to succeed at all levels of sports is also necessary for trading success. Sports psychologists have developed several approaches to deal with the psychological dimensions of winning and losing games. In this section, we examine how some those ideas can be applied by traders to gain the “winning edge.”
The first key idea is that athlete/trader must accept responsibility for his or her performance. Traders have it in their power to make the changes necessary to improve their trading performance. Psychologists have developed an attribution theory that describes the broad factors to which success or failure can be attributed by players, based on research into what is called locus of control.
Players or traders can attribute the reasons for their success or failure to any of four boxes, shown in Table 9.1. Athletes might say that they lost because of luck (bad call by a referee) or the difficulty of the task (“We never play well in that arena”). Alternately, they may ascribe credit to internal factors such as effort (“The only way to get me off that court was to drag me off”) or superior ability (“I was in the zone tonight”). A study of successful athletes suggests that more often than not, losers tended to blame external factors, and winners, as a group, tended to focus on internal factors. For example, winners ascribed success to ability and effort, but pointed to a lack of total effort in losses. A study of sports legends indicates that they all were “internal attributors”: they assumed responsibility for their performance and looked to improve their ability and increase their effort in order to be successful. Professional teams, playing in championships, focus on the task (their opponents and the perceived strengths and weaknesses) to develop a game plan, practice those abilities that will help implement the game plan, hope to take care of luck with careful pregame rituals, and then mentally “psych-up” at game time to maximize their effort. Even a casual perusal of the sports pages will show that the mental aspect of the game is probably more important than the physical requirements at the highest level of every sport, and the attribution theory seems to be a good approach to classify the responses of athletes to the mental demands of their sports.
Table 9.1 Psychologists use attribution theory in sports to analyze the attitudes of consistent “winners.” The most successful players are internal attributors, who take personal responsibility for their success.

We can generalize and extend the attribution theory for athletes to traders by separating events into those the trader influences and those influenced by the market or other external factors (see Table 9.2). Traders control their ability, or more broadly, the technology used to trade, which includes the tools (data feeds, computers, software) as well as the trading systems, risk control principles, and money-management algorithms. When traders speak of self-improvement, they are implying an improvement in the technology they use in their trading. The category of effort is converted to A2D (attention to detail) in the trading context. Trading can be a messy affair with many loose ends, and the trader must pay passionate attention to detail to be successful. Various factors can affect the level of concentration each trader brings to the table every day, but traders must remember that it is very easy to make costly mistakes. As in tennis, the difference between winning and losing is often this category of “unforced errors.”
The primary role of the markets is price discovery, and elaborate infrastructures have been built to discover and disseminate trading information, such as prices, volume, and open interest. These processes are relatively stable, and can be used to broadly refer to the “technology” used by each market. Each trader can approach a market in his or her own way, and ascribe profitable months to “easy” markets and unprofitable months to “tough” or “difficult” markets. The one unstable part of trading is market noise, generated by the markets themselves as they try to digest data, information and news that bombards them everyday. Traders can easily ascribe losses to intraday volatility or noise. For example, the bond markets often wait anxiously for reports on economic activity; immediately after release, the snap judgment of the market may cause a big move one way, which can be quickly reversed as cooler heads prevail or the analysts get more time to sort through the data.
Table 9.2 The attribution theory model adapted for traders. Winning traders should focus on their trading technology and pay attention to the details of executing their trading plan. Most traders can do little about external events controlled by the markets, such as settlement prices and random noise.

If we extend the attribution theory to traders, then successful traders should take personal responsibility for their gains and losses, and should focus on understanding the task (trends in price discovery), improving the technology of market analysis (ability), and paying full attention to the details of trading (effort). Market noise (luck) should be a factor in their overall results only occasionally, if at all, because even the best prepared trader can be surprised by the market. For example, many traders cut down the size of their position before the release of reports and may even be completely out of the market. Then they will have separate specific plans for each situation, whether the reported numbers are well below expectations, at or near expectations, or well above expectations. They will map the size of their positions in each instance, their entry points and exit points, as well as what they will do in the case of sharp reversals from the initial reaction. This kind of preparation clearly shows that traders are internal attributors, and have accepted the responsibility for their own performance.
The next important idea in sports psychology is goal-setting. Goal-setting is considered a highly effective motivational technique: hence, goal-setting really requires a player (read trader) to set up many layers of goals, leading from the long term (the “dream”) to the short term (for the next trading day). The goals must be specific, achievable, and tied to a definite timetable. The objective is to develop a hierarchy of tasks that are tied together in a purposeful sequence in order to attain specific goals. The tasks can be evaluated regularly and can be altered as necessary. As shown in Figure 9.1 for traders, tasks will lead to greater skill levels over time, which should result in greater trading success as well.

Figure 9.1 Goal-setting is a powerful motivational tool in sports psychology. Here it is adapted for traders, who should set specific daily, weekly, monthly, quarterly, and yearly goals as they progress toward their dreams.
The very process of developing a list of tasks and actually writing them down has been found to be an effective motivational tool. Teams will often write these goals on their caps, where they can be read easily and often. To traders who accept personal responsibility for their trading results, goal-setting offers a tool to identify those tasks that can lead to ever-greater improvements in their arsenal of trading technology, or their ability to improve A2D by process automation, or their ability to understand market trends. In the short run, goal-setting can lead to specific trading plans, a critical element in trading success. One psychologist who has studied traders reports that losing traders, without exception, were operating without a trading plan. Another part of goal setting is an analysis of strengths, weaknesses, opportunities, and threats (SWOT), applicable to both sports and business. The hierarchy of goals is developed to improve weaknesses, mitigate threats, and build on strengths to take advantage of opportunities.
Psychologists studying athletes, scientists, and other high achievers have developed a concept called “flow,” which describes a period of effortless action that tends to occur when a person faces a clear set of goals that require action (see Csikszentmihalyi, 1997). Most people experience a variety of mental states in response to the activity they are doing, based on their skill level and the difficulty of the task, as shown below in Figure 9.2. People experience flow when they are highly skilled at a task and are in a situation that challenges those skills. A basketball player asked to take a last-second shot may experience flow, as may a surgeon faced with a complication during a well-known procedure, although a surgical resident may experience anxiety at the same procedure. For many traders, especially market makers, online or on the floor, trading the market just before and after the release of an important report or an unexpected news story may create the opportunity to experience flow.

Figure 9.2 A matrix of mental states observed by psychologists studying the phenomena of “flow,” in which a period of effortless action is experienced by highly skilled people challenged by a difficult task requiring their skills. The chart shows the type of emotion experienced by subjects when they faced familiar and unfamiliar tasks and challenges. Adapted from Finding Flow by Mihaly Csikszentmihalyi, 1997.
Trading is an emotional business, and Csikszentmihalyi’s concepts of mental states can be adapted to describe the experiences of trading. There seems to be a consensus in the literature that highly skilled traders have strong belief systems, are resilient and confident, and exhibit a high degree of “mental toughness.” They remain confident in the face of market adversity and do not deviate easily from their trading process. They are focused through difficult trading conditions and are relaxed when trades are going their way. New traders tend to be the most emotional as a group, being overoptimistic when market conditions are favorable and downright fearful when losses begin to accumulate. Traders with intermediate skills, as a group, show greater variation in their emotional states. They seem happiest and engaged with trading when market conditions are favorable. Intermediate traders often know what they need to do under difficult market conditions, but are unable to “pull the trigger.” They tend to turn defensive or angry under challenging market conditions and are quick to change methodologies. These traits are summarized in the Figure 9.3. Note that this is but a simplified depiction and is not meant to be an exhaustive description of all possibilities. Figure 9.3 allows traders to measure their reactions and understand where they may be in their evolution as a trader.

Figure 9.3 A matrix of mental states adapted for trading, which tries to depict various emotional states that could occur in traders. Note the gradation in emotions horizontally, vertically, and along the diagonals.
Traders can become stressed when they perceive a mismatch between their competence level and the degree of difficulty of the markets. Stress can be manifested in many forms—mental, physiological, and behavioral. Relaxation techniques and mental imagery can be used to match our competence level as traders to the difficulty posed by the markets. Relaxation techniques can be learned easily from a variety of sources. The simplest approach is to sequentially clench or tense the large muscle groups of the body for 10 seconds followed by 20 seconds of relaxation. After each muscle group is relaxed, you should feel the sense of relief flooding through your body. A few deep breaths after the relaxation exercises should set you up for practicing mental imagery. Mental imagery in sports involves recreating images of the optimal moves necessary to win. The imagery can be extensive, vivid, and detailed, covering every phase of the game, pregame, and postgame activities. There is anecdotal as well as scientific evidence that mental imagery can enhance performance in athletes. It can also improve concentration, the connection between the mind and the body. Mental imagery can also be connected to ancient disciplines of meditation.
As traders, mental imagery can be used to reinforce or modify belief systems, rehearse the mechanics of trading, or even prepare for the release of market moving data. Mental imagery can be used to finesse fear, diffuse anger, clarify confusion, and transform indecisiveness. The goal of relaxation and mental imagery is to become more relaxed when approaching the trading day, regardless of what the markets have to offer.
Unlike players, who need to concentrate on peak performance for short periods from a few minutes to a few hours, traders are like marathoners, who must keep their focus day after day for hours on end. A study of marathoners found that they are internally focused during the run, focusing on their own internal environment, their aches and pains, and how their body is doing. This is opposed to focusing on the course, other runners, or distractions from the fans. Positive self-talk is another sports psychology technique that may help the trader maintain focus and morale during challenging markets.
In summary, the attribution theory for traders, goal setting, mental imagery, and the matrix of mental states provide a framework for traders to apply the principles of sports psychology to trading. This research suggests that traders need to become internal attributors, concentrating on those factors within their control, such as trading technology and A2D, or attention to detail. They should trade what they test and test what they trade in order to increase their skill level and increase their confidence in their trading systems and methods. They should apply the risk control methods discussed in Chapter 7, especially the Chande comfort zone, to prepare for drawdowns and to manage their expectations. Markets will come and go, but traders must go on forever.
Trading with Your Head and Heart
Every trader has an analytical part (head) and an emotional component (heart). A system that suits you will engage both aspects of your personality. When you start trading a system, you face two expectations. One is the statistical expectation, which we have discussed in detail. The other is your emotional expectation from the system. If the two expectations are not coherent, then you will not be happy trading the offending system.
This raises questions about why you trade. For many people, the only reason to trade is to make a profit. However, you could have many other reasons, such as the excitement of trading or the intellectual challenge of competing with other traders. You should check to see if the following are consistent: your profit objective, trading horizon, mathematical expectations, and emotional expectations.
If these are not consistent, then you may not have the mental edge. Probably fewer than 25 percent of traders have the mental edge, and perhaps only 2 percent can maintain the edge year after year.
There are many contradictions between mathematical and emotional expectations. The mathematical expectation covers 2 to 3 years of data, but the emotional expectation covers only 2 to 3 months. Emotional expectations can be complex, and they cannot be represented by a single number. In the worst case, a system could have a positive mathematical expectation but a negative emotional expectation. In this case your head and heart disagree, and the inevitable tension will make it impossible for you trade this system.
Your emotional expectations may be based on an inaccurate or incomplete understanding of system test results. You should make it a point to study the evolution of each trade day by day. You should be comfortable with the dollar amount of the average trade, the winning percentage, and the length of the average trade. You should also be comfortable with the dollar amount of the initial risk-control stop. If you understand the “signature” of the system, then each trade will reinforce your belief in the system. If you have unreasonable emotional expectations, then each trade will diminish your faith in the system.
You may expect big successes, with few losing streaks and many exciting trades. The reality is that only 5 percent of the trades are big successes, you can have many losing streaks, and most of the trades are dull. You can use the “rule of two,” as follows, to modulate your emotional expectations:
- Expect half as many winning trades in a row as you project from your testing.
- Expect twice as many losing trades in a row as your testing may show.
- Prepare for half the expected profits.
Let us continue with the “head and heart” analogy. What you “think” you believe is in your head. What you “truly” believe is in your heart. Your head may be clear or confused. Your heart may be confident or fearful. If your head and heart disagree, and the stakes are low, then the head wins any conflicts. However, if the stakes are high, then the heart wins any conflicts. Thus, you can trade comfortably only if your head and heart agree. So spend the time and effort to understand system performance so that your mathematical and emotional expectations will agree. This is the key to long-term success.
Summary
You should integrate all the ideas of this chapter to create a system for trading. A trade plan is at the heart of a system for trading. You should monitor compliance with your plan and try to provide full traceability. You should also follow the principle of no exceptions to your trading rules. To win, trade with your head and heart.
Appendix to Chapter 9: Creating an Automated Diary of Trading Emotions
A diary of your emotional states as you trade will help you improve as a trader over a period of many months. One difficulty with jotting down your thoughts is that it may be difficult to graph or analyze trends in your emotions. Many diarists sometimes find it difficult to read their own handwriting months later because stress has way of distorting how you write. A solution to this problem is to use a database or spreadsheet and keep a numerical score of your emotions. All spreadsheets are equipped with graphing capabilities and statistical functions, so you can easily chart your emotional states. You may even be able to use the principles of technical analysis to spot breakouts, consolidations, and trends in your feelings about a particular trading strategy.
In this section, we show how to use a Microsoft Excel 2000® spreadsheet to build a simple application that will allow you to record a numerical score of your feelings about your current trading strategy. To do this, we use Figure 9.4, which shows a matrix of trader reactions as market conditions change, and the trader’s belief in the trading system fluctuates. Figure 9.4 identifies nine emotional states, ranging from relaxed, confident, and patient, to eventually ignoring signals and finally stopping trading altogether. The two variables being used to map mental states are belief in the trading system and trading conditions in the market. Each variable is divided into three levels, low, medium and high. These levels can be converted to numerical values as follows: the low level converts to a number less than or equal to 3, the medium level ranges from 4 to 7, and the high level varies from 8 to 10. A simpler alternative is to equate the low level to 1, the medium level to 5, and the high level to 10.
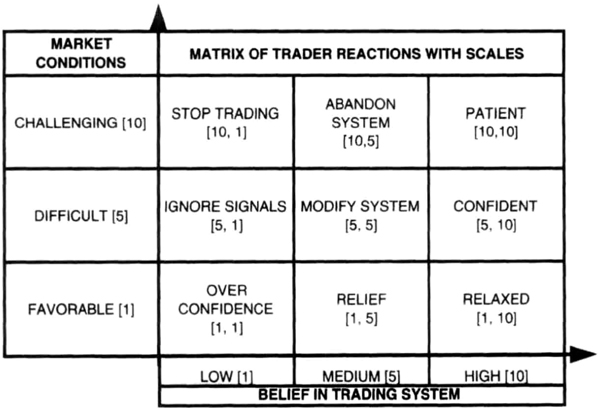
Figure 9.4 The matrix of trader reactions is converted into pairs of numbers by assigning numerical values to the levels of market conditions and trading system belief. The numerical assignments are low = 1, medium = 5, and high = 10 for each axis.
Once you have a numeric scale for your belief in the trading system and market conditions, you can easily convert the nine cells in Figure 9.4 into corresponding paired numerical values. If you perceived that the market conditions were challenging and wanted to stop trading, then the paired values quantifying this mental state are [10, 1], where the value 10 implies challenging market conditions (high = 10) and the value 1 derives from your low belief in the trading system (low = 1). You can record quantitative values of your mental state in a spreadsheet after each trade is closed out or at frequent time intervals, such as daily or weekly. If you wish, you can use a more refined numerical scale from 1 to 10, as indicated in the previous paragraph. After a few months, you will have detailed information that can be graphed and analyzed.
A convenient way to enter this information in a spreadsheet is to create buttons on the sheet and attach macros to those buttons. You can then just press the appropriate button to record your mental state. In Microsoft Excel®, you can add buttons to a spreadsheet by clicking on the Controls toolbar, which can be accessed from the View→Toolbars menu selections. You can then click on the Command button icon and draw a button at a convenient spot. After drawing the button, place the mouse pointer on the button and click the right mouse button. On the pop-up menu, select Properties to see a window with the properties assigned to the button. The property values can be edited directly in the pop-up window. You can edit the name, change the caption, and set the Placement property to 3. The advantage of setting the Placement property to 3 is that the button will stay “fixed” to the location you used even if you add rows to your spreadsheet. If you wanted to program the “RELIEF” reaction button, you would edit the Caption property to read “RELIEF” and name the button cmdRelief, using a popular naming convention. You can draw nine buttons for each of the reactions, as shown in Figure 9.5. You can then add some code to make the button add values to the spreadsheet as discussed in the following paragraphs.
Let us now assume that you want to store the data on your mental states. You want to record the date, the market condition, and the strength of your belief in the trading system. You would also like to store the data in reverse chronological order, so that the most recent data are near the top of the spreadsheet. You would thus add a new row at the top of the spreadsheet and enter the date, market condition, and belief strength in adjacent columns. It is easy to automate this procedure by writing a simple macro and attaching it to each of the buttons in Figure 9.5 so that the correct values are entered in your spreadsheet.

Figure 9.5 A group of command buttons in a Microsoft Excel 2000® spreadsheet that can be programmed to enter values of market condition and belief in the trading system into designated cells. These entries can be tracked and analyzed to understand your trading patterns.
You can program the buttons to add values to the spreadsheet with the following procedure. After you have drawn the button on the spreadsheet and edited its properties, double click on the button. This opens the Visual Basic editor. If you were programming a button called cmdRelief, then you will see a blank page with blue words “Private Sub cmdRelief_click()” followed by a blank line and then another line with the words “End Sub.” You can now type in the following lines just above the line with the words “End Sub,” just as you would in any text editor. Here is how the Visual Basic editor should look to you:
Private Sub cmdRelief_Click()
         Application.Goto Reference: = “R2C2”
         Selection.EntireRow.Insert
         Range(“B2”).Select
         ActiveCell.FormulaRlCl = “= TODAY()”
         Range(“C2”).Select
         ActiveCell.FormulaRlCl = “1”
         Range(“D2”).Select
         ActiveCell.FormulaR1C1 = “5”
   End Sub
The program lines shown above are the instructions for the RELIEF button. Remember that the three columns we want to enter are the date, the market condition, and the strength in trading beliefs. The first line of code moves to the cell in row 2, column 2 (cell B2) and then inserts an entire row. The cursor then enters today’s date in cell B2. The cursor moves to cell C2 and enters the value 1 for favorable market conditions (see Figure 9.4) followed by an entry of the value 5 in the column for strength of belief in the trading system (cell D2). Once you have finished entering the code, simultaneously press the Alt-Q keys to return to the spreadsheet. You can access the Visual Basic editor again by pressing the Alt-F11 key sequence or from the menu by choosing Tools→Macros→Visual Basic editor. You can copy this code into each of the other buttons, and change values for cells C2 and D2 as needed. You will then be able to enter values for each mental state simply by clicking the appropriate button (see Figure 9.5). For completeness, the program lines for the STOP TRADING button are shown so you can observe how the values for market condition (10) and trading beliefs (1) are edited in after copying the code for the button RELIEF:
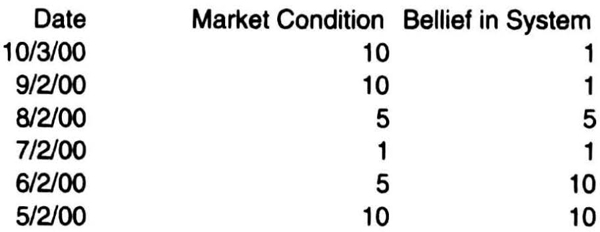
Table 9.3 A sample monthly diary created using the buttons shown in Figure 9.5.
Private Sub cmdStopTrading_Click()
         Application.Goto Reference: = “R2C2”
         Selection.EntireRow.Insert
         Range(“B2”).Select
         ActiveCell. FormulaR1C1 = “ = TODAY()”
         Range(“C2”).Select
         ActiveCell.FormulaRlC1 = “10”
         Range(“D2”).Select
         ActiveCell. FormulaR1Cl = “1”
   End Sub
A sample set of monthly diary entries is shown in Table 9.3. You could keep a more detailed diary if you wish, or use a more refined scale for the variables being tracked. You can also enter the data directly into the spreadsheet without using buttons. You can even program the buttons to store any other data you wish to track. These data can then be tracked and analyzed via graphs or statistical functions built into spreadsheets to spot trends.