
Proteomics
Abstract:
Proteomics is the varieties, quantities, roles and dynamics of all proteins in a cell, tissue or organism. Proteins are structural or functional elements of cells, comprising sequences of amino acids assembled according to templates of DNA and RNAs. Their sequences determine their structure, thus their cellular functions. Post transcriptional modifications occur in most proteins. Protein dynamics result from synthesis and degradation, which are well controlled in normal physiology. They also work in groups, so concurrent expressions, localization and physical interactions can shed light on their cellular roles. Proteins can function in extracellular space, circulating via the blood stream to function far away from where they were generated. This is why many serum or urine proteins serve as clinical biomarkers. Many aspects of clinical relevance still wait to be discovered. Here we explore the key concepts, practical computational tools and research directions of proteomics. We show that de novo peptide sequencing is an inverse problem, which can be solved by the adequate use of assumptions.
4.1 Introduction
Proteomics is the systematic identification and characterization of all proteins, their abundance in time and space, their structures, their cellular activities and their interactions with other macromolecules. Proteomics can refer to all proteins in a cell, a tissue or an organism. Proteins are macromolecules composed of linear chains of basic elements called amino acids. There are 20 different types of amino acids in the human body, which are assembled in sequence into proteins according to the instruction of their messenger RNA templates. This process is called translation, which is performed by complicated molecular machinery and takes place in the ribosomes of eukaryotic organisms.
A genetic code book defines the map of three consecutive ribonucleotide bases (codons or triplets) in the messenger RNA to the corresponding amino acid residues of the protein. A set of four ribonucleotide bases (A, U, G and C) can give rise to 64 different triplet combinations in total. Among them, the triplet “AUG” codes for the amino acid methionine, as well as the starting signal of translation (known as the start codon). Similarly, three other stop codons (UAG, UAA, UGA) indicate the termination of translation. Each of the other 60 codons dictates the assembly of 1 of 19 other amino acids. This is mediated by 22 different transfer RNAs (tRNAs), which have an anti codon to form covalent bond base pairing with the messenger RNAs. At the other end of the tRNA, a residue binding motif is in place to grasp the amino acid residue and add it to the newly synthesized proteins.
Proteins may reside in particular regions of the cell, such as the cell membrane and nucleus, or be secreted into the extracellular space to carry out their functions at a remote site. The proteome can signify not only the cell types but also the cellular states. The human genome project has located and substantiated 21,000 protein coding genes (IHGSC, 2004). It is now imperative to characterize these gene products in the form of proteins. As will be seen later, the DNA and RNA sequences are extremely valuable in many aspects of protein studies.
However, proteomics brings its own layer of complexity in addition to genomics and transcriptomics. The 21,000 protein coding DNAs represent more than 1,000,000 final products of proteins, including alternatively spliced RNAs and the extensive post translational modifications occurring in almost every single protein (Godovac-Zimmermann and Brown, 2001). Proteins are also known to be pleiotropic, meaning that they may carry out several distinct functions. The dynamic and variable expression profile of a protein within a cell cannot be estimated by RNA assays, due to the discrepancy between RNA and protein levels in time and space. This discrepancy is caused by time lags in translation, difference of half lives of RNA and protein, and various post transcriptional regulations of proteins.
The enzymatic or structural functions of proteins make them closer to phenotype than DNAs and RNAs. Samples of a proteomics investigation can be obtained from cultured cells, tissues or body fluids. Human body fluids (e.g. urine and serum) are attractive sample sources of protein assays due to their ease of acquisition both in the exploratory stage and in clinical use. Consequently, many established clinical assays are based on urine or serum proteins.
Major directions of proteomics studies (and their core technology) are:
![]() Characterize the constituent proteins in a protein complex for illustrating unknown protein localizations and functions (protein identification).
Characterize the constituent proteins in a protein complex for illustrating unknown protein localizations and functions (protein identification).
![]() Characterize protein interactions between pathogen and hosts (protein interaction detection).
Characterize protein interactions between pathogen and hosts (protein interaction detection).
![]() Compare protein expression profiles across clinically distinct persons (quantitative proteomics).
Compare protein expression profiles across clinically distinct persons (quantitative proteomics).
![]() Compare protein expression profiles between different experimental conditions of a cell line (quantitative proteomics).
Compare protein expression profiles between different experimental conditions of a cell line (quantitative proteomics).
![]() Annotate protein sequence by functional domains (protein sequence analysis).
Annotate protein sequence by functional domains (protein sequence analysis).
![]() Study protein structures for illustrating their functions (protein structure analysis).
Study protein structures for illustrating their functions (protein structure analysis).
4.1.1 Epigenomics
Epigenomics, which literally means “on top of” genomics, is the investigation of heritable marks materialized by chemical modification of the nucleotide bases and histones. Histones are a major type of chromosomal proteins, which are compactly wrapped around by genomic DNAs to form chromatins, to reduce chromosomal volume and strengthen the structure. The chemical modifications alongside the DNA sequences carry heritable information, passed down from cells to their offspring, by the completion of either mitotic or meiotic cell cycles. Common epigenomic modifications include the methylation of the nucleotide cytosine, or the methylation, acetylation and phosphorylation of the histone proteins. All these modifications may affect the binding of transcription factors to the transcription elements, thereby changing the expression of genes.
Epigenomics often relies on proteomics platforms for the study of histone modifications. It has been reported that many diseases such as colon cancer are initiated by altered epigenetic modifications, and subsequently the altered expression patterns of genes such as HNPCC, MSH2 and MLH1.
4.2 Proteomics platforms at a glance
Proteomic studies can be classified as “targeted” or “non-targeted” investigations. A non-targeted proteome is more like the genome-wide approach, where all constituent proteins are analyzed or even quantified. However, this is a daunting task. In comparison, a targeted proteomic study aims to characterize and quantify a selection of proteins from a sample. The targeted proteins include the exploration candidates based on the study rationale (i.e. membrane proteins, mitochondrial proteins, phosphorylated proteins, etc.), or the validation candidates which were selected at the exploratory phase of the study. Although not a genome- wide investigation by strict definition, many investigators still refer to the targeted study as the “proteome”.
Current protein biotechnology does not have amplification technology similar to the polymerase chain reaction (PCR) widely used for DNA and RNA assays. Hence, the detection limit of trace amounts of proteins determines the completeness of a proteomics study. Fortunately, the sensitivity of protein assays is improving rapidly and we can rely on more recent and sensitive methods for those interesting but less abundant proteins.
4.2.1 Antibody based assays
Antibody based assays are used for targeted protein investigations. An antibody is a naturally occurring immunological molecule which has a wide range of sensitivity and specificity in binding to an antigen (another protein or macromolecule). Multiple specificity has also been observed in many antibodies. In such cases, the antibodies can recognize multiple antigens with a similar epitope, which is the major site where the antigen interacts with the antibody. It is this specificity that enables the therapeutic antibodies to antagonize their corresponding antigens with minimal effect on other proteins. This specificity has also being used extensively by modern biotechnology. Proteins in cells or tissues can be identified by their binding with monoclonal or polyclonal antibodies, which are tagged by fluorescent or radiological signals. Immuno (Western) blotting and immunohistochemistry (IHC) are two typical antibody based assays. The latter is particularly useful for in-situ detection of proteins. IHC and Western blotting are often performed on one or few proteins at a time and the throughput is relatively low. Therefore, they are widely used in mechanism investigation or validation rather than large-scale exploratory studies.
The enzyme linked immunosorbent assay (ELISA) is another antibody based protein assay, employing antibody immobilized on a solid surface to detect proteins in liquid samples. ELISA is often performed in batches. For example, 96 samples on a plate are processed concurrently. Thus, this is ideal for validation of findings. Furthermore, once a protein is substantiated in an ELISA validation, the same assay can be further developed as a highly specific clinical assay. The disadvantage of this assay is that antibodies can interact with each other, prohibiting the construction of multiplexed assays utilizing multiple antibodies concurrently.
The antibody is also the basis of immuno-precipitation (IP), a capturing method for a particular class of antigens such as proteins. For example, IP has been used for systematic capturing of protein tyrosine phosphatases and their oxidized forms (Karisch et al., 2011). IP can also be used to detect the macromolecules, which stably bind to the targeted protein, called co-immunoprecipitation (CoIP). If the targeted protein is a transcriptional factor, then the DNA bond to the target may indicate a transcription element. IP is also useful for epigenomic investigations, based on the IP of chromatins (ChIP), then followed by a high throughput technique such as next-generation sequencing (ChIP-Seq) and microarray (ChIP on Chip) for the detection or quantification of DNA fragments bound to the chromatins. It can also be followed by mass spectrometry (MS) for the detection of chromatin modifications.
4.2.2 Mass spectrometry based platforms
Mass spectrometry (MS) based platforms are the only type of platforms so far that have the potential to practically detect and quantify known and unknown proteins on a large scale, in other words, the non-targeted proteome. MS-based platforms comprise two connected stations: separation (also called fractionation or purification) and peptide identification (Godovac-Zimmermann and Brown, 2001). Under this common framework, a wide variety of instrumentation has been installed and experimental protocols implemented. The particular type of instrument and protocol will inevitably affect the optimum platform level analysis. Clinical samples are usually in the liquid phase with a complex protein mixture, hence the first step is to separate highly complex protein mixtures into more homogeneous fractions before protein identification can take place. This is done via 2-D gel electrophoresis (2-D gel) or high performance liquid chromatography (HPLC). Proteins are first denatured by sodium dodecyl sulfate (SDS) so that they can move in the gel more freely. The 2-D gel technique can disperse the protein components in a mixture, relocating proteins by isoelectric points in one dimension, and the molecular weight in the other perpendicular dimension. The proteins are then visualized on the gel surface using staining methods, and indexed by their coordinates. The protein fractions of interest are then digested and excised from the gel for further analysis.
The second step is the identification and characterization of fractionated protein mixtures by MS. Due to the limitation of molecular size in an MS, proteins are first digested (cleaved) by proteolytic enzymes into smaller peptide fragments. For example, the trypsin enzyme cleaves all the composition proteins at the sites of two amino acids, Lysine (K) and Arginine (R). The digested samples are then vaporized from the liquid phase into a gas phase by ionization or vaporization technology, for example, electrospray ionization (ESI) and matrix assisted laser desorption ionization (MALDI).
The vaporized peptide ions are then sent through an electric field in a chamber with a detector on the other side. The time taken for each peptide fragment to fly through the chamber and hit the detector indicates its molecular weight per charge (i.e. the mass charge ratio, m/z). By recording the time of flight and intensity of fragments, a peptide mass fingerprint (PMF) is produced which can be visualized as a spectrum. Typically, a PMF spectrum can be generated per sample fraction. The horizontal axis of the mass spectrum indicates the time of arrival of each peptide fragment, which then translates into the mass to charge ratio. The current resolution of mass is between 0.01 and 0.001 Dalton (Mann and Kelleher, 2008). The vertical axis is the intensity, which may indicate the abundance but with a lower resolution.
Tandem mass spectrometry (MS/MS) is an essential technique for a finer characterization of peptide components within the sample of interest, particularly when the protein cannot be identified by one-pass MS. The peptides first pass through a regular MS chamber to produce the first mass spectrum. Selected peptides are sent through the second chamber, and smashed into ions by the collisional force with the inert gas in the chamber. The ions are then guided through the second electric field. The time of arrival then defines the ion level MS/MS spectrum.
The separation of protein mixture into fractions aims to reduce the analytical complexity of each fraction to a practical, manageable level. Ultimately, we need to stitch together data from different fractions into an integral whole so as to obtain a non-targeted proteomics scale dataset. This relies on a well organized automation and computer infrastructure to control experiment logistics and reduce human effort and error. The combination of liquid chromatography (LC) and ESI MS is the most (semi-) automatic way of high throughput proteomics.
4.2.3 Protein interaction networks
Three platforms are available for a systematic assay of protein interaction networks: the yeast two hybrid (Y2H), pull down or coimmuno-precipitation. The Y2H systems are reporter systems showing that if two proteins can physically interact, they will form a transcription factor in the reported system to activate the expression of reporter genes. The pull down assay employs baits (the protein of interest labeled with a tag for the following affinity purification step) to fish for their interacting proteins called preys. The preys are then analyzed by MS, identifying all the interacting proteins in a complex (Ho et al., 2002). Coimmuno-precipitation can capture a protein by antibodies, and the proteins which interact with the target protein then can also be captured for the following MS analysis.
4.3 Protein identification by MS based proteomics
MS-based proteomics platforms can generate a multi-dimensional raw signal. LC-based sample separation methods give the first dimension of eluting time, which characterizes the physical property of the subfraction of the sample. However, the 2-D gel approach gives the first and second dimension. Peptide identification, as produced by ESI, generates a spectrum per fraction, offering one dimension of m/z and another dimension of signal intensity, an index of peptide abundance. An even higher dimension of data will be produced in an MS/MS platform. The multi-dimensional data is often noisy and not aligned properly across experiments. Noise comes from, for example, the alternating current power source which generates an unwanted low frequency signal component, or the varying detector status which generates unwanted signal variation. For a fair comparison of MS or MS/MS in different runs or batches, platform level analyses are required, depending on the data quality.
Background subtraction and smoothing are common methods for removing systematic error and underlying drifting effects in a spectrum. The eluting time needs to be aligned and data normalization may be required to compensate for the batch difference of signal strengths. A large collection of analysis algorithms and software has been proposed to deal with platform level issues throughout the process. Each has its distinctive strengths (Box 4.1). What is introduced in this chapter is a general framework on the major concepts. For a comprehensive review, see Listgarten and Emili (2005).
Box 4.1 Useful bioinformatics tools and resources for proteomics
A Resources for protein annotations
The Human Protein Atlas is an important resource to find the evidence of protein expressions in tissues, which is mainly detected by immuno histological staining.
Pfam is a web service hosted by the Wellcome Trust Sanger Institute. It offers protein families, and families of families called clans, analyzed by multiple sequence alignment and hidden Markov models. It also offers biological domain annotations for proteins. Gene symbols can be used to search for a protein of interest. Users can easily find all the proteins that share the same domain.
This is a web service hosted by the ExPASy site. It offers patterns, in the format of consensus and variable regions, of a highly conserved part of protein sequences called motifs.
SCOP stands for structural classification of proteins. It is hosted by Cambridge University. As the name suggests, the site offers classification based on 3-D similarity. It also offers convenient links to the structure image in PDB.
The SWISS-Model offers the 3-D structure estimation and folding of proteins based on their sequences, using a template of known structures documented in PDB. This is a homology-based approach where the sequence homology is first computed, then the unknown structure is computed by the adaptation of known protein structures of the homologous proteins.
A single portal site, hosted in EBI, of many protein annotation databases such as Pfam and Prosite, InterPro can be used to find ortholog and paralog sequences of a gene easily.
PANTHER was introduced in Box 3.1 to serve for module level enrichment based annotations on transcriptomics data. It is worth noting that this site also offers valuable protein classifications based on protein sequences.
B Software for mass spectrometry based proteomics
MaxQuant is a package of software designed for quantitative analysis of the high resolution mass spectrum. It was developed by members of the Max Planck Institute of Biochemisty. The package offers a total solution, by integrating external ion matching software such as Mascot or Andromeda.
Mascot is a commercial package for PMF and MS/MS ion matching. Being a pioneer in this type of software, it is widely known and used.
Flicker is a 2-D gel image comparison software. It is hosted by NCI and also has a downloadable version.
MRMer is dedicated to MRM analysis. It has a free website service hosted by Fred Hutchinson Cancer Research Center (FHCRC). It also offers free JAVA software download (Martin et al., 2008).
4.3.1 Feature extraction
Peptide identification and comparison rely on accurate m/z and occasionally abundance measurements of peptides, shown as peaks in the spectrum. The feature extraction step is to compute accurate readings from the multi-dimensional analog and noisy data, with high sensitivity, specificity and resolution. It is commonly done by fitting a Gaussian envelope on the m/z intensity plane, then grouping the envelopes along the retention time axis with other layers of signal smoothing, to obtain smooth Gaussian hills. The peak of an envelope hill is then determined to give an m/z measurement and an intensity. All the peaks associated to a peptide are used to calculate the peptide abundance, which is an average of the intensities.
Despite the fitting and smoothing processes which have grouped fragmented signals into smooth hills, large amounts of noise still remain, which give false positives. A series of filters and grouping methods are then applied. One filter is by the m/z gaps between peaks in light of the legitimate weight ladder of amino acids. Regarding the MS/MS data, the weights of a-, b- and c-ions are related by their chemical formula. Using this information, we can group these ions so as to produce a much clearer spectrum.
Isotope pattern are also processed and are valuable cues. Isotope peaks are extracted purposely if a quantitative comparison of different protein sets is prepared with different isotopes. If the focus of the project is on the identification of novel proteins, then the isotope peaks are grouped together.
The feature extraction can be performed by the MaxQuant package (Cox and Mann, 2008) (Box 4.1).
4.3.2 Computational spectrum matching
The identification of constituent proteins from samples such as cell lysates, body fluids or tissue extracts, is one of the major tasks in proteomics studies. A series of mass spectra may be produced for a sample which contains complex protein mixture. The way to interpret a spectrum is to match the m/z patterns of the spectrum computationally with those of known peptides called reference spectrums. If no match is found, the spectrum can also be matched against the theoretically predicted peptide m/z derived from genomic and transcriptomic sequences. This matching approach is called PMF. Proteins are identified if complete or partial matches are found. A similar computational approach can be applied to MS/MS spectrum analysis, such as the MS/MS ion matching method or the sequence tag method. The success of both the PMF and MS/MS ion matching relies on the completeness of the reference spectrums.
Several PMF and MS/MS ion matching software packages are available, such as Andromeda and Mascot (Box 4.1). Ideal computational matching methods need to be robust to accommodate noise and uncertainty. Typical source of uncertainties include:
These uncertainties remain challenging for protein (peptide) identification by computational spectrum matching, particularly when the noise and uncertainties may be instrument dependent. The de novo peptide sequencing is an alternative for MS/MS ion matching.
4.3.3 De novo peptide sequencing using tandem mass spectrometry
The de novo peptide sequencing methods aim to derive the sequence of the peptides directly from the MS/MS spectra, without using computational matching. This is the approach used to identify novel proteins, which does not exist in current databases.
An MS/MS spectrum has a very complex pattern due to a variety of ion types after the collision. The backbone of a protein molecule starts with a nitrogen atom (the N terminal) and finishes with a carbon atom (the C terminal). An amino acid can be represented by a unit of three atoms (N, C, C). Upon collision, a peptide can break down in many different places in the molecule, particularly along the backbone and between the boundary of two amino acids, (i.e. the C–N bond). In such a case, the parts ahead of the break are called b-ions, and the parts behind the break are called y-ions (Figure 4.1). The break might also occur in other places. In such cases, the parts before and after a break of the (C–C) bond are called a- and x-ions, respectively. The parts before and after the break of the (N–C) bond are called c- and z-ions, respectively (Figure 4.1).
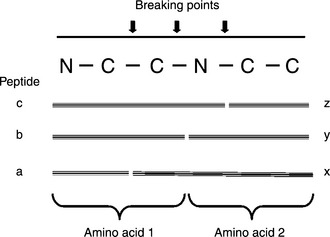
Figure 4.1 The breaking points result in different types of peptide fragments after collision. The break not only occurs between the peptide bonds, producing b- and y-ions, but also occurs within an amino acid residue and along the backbone, producing x- and z-ions from the C terminal (called C terminal ions)
The de novo peptide sequencing is a typical inverse problem. The corresponding direct problem is to generate a hypothetical spectrum for a peptide sequence (Figure 4.2).
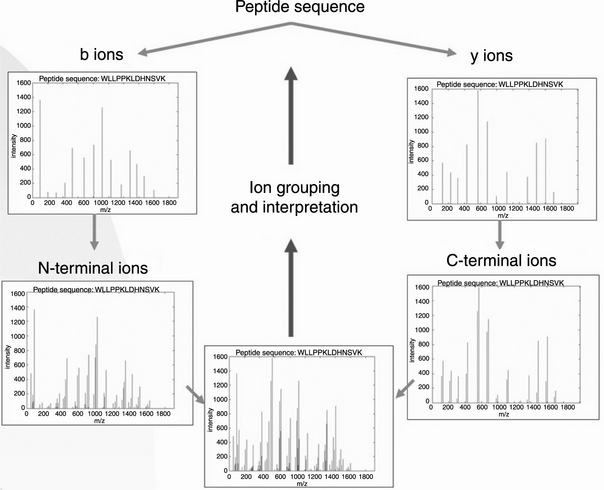
Figure 4.2 The direct and inverse process from peptide to spectrum. The downward arrows represent the route or direct process to generate a theoretical spectrum from a peptide. The upward arrows represent the inverse process for grouping and analysing signals in the spectrum to generate the sequence
A de novo peptide sequencing algorithm may be derived based on the practical tool of graphs, which serve as abstract representations of MS/MS spectra. The graph is often defined by the node (also called the vertex) and link (also called the edge) nomenclature (Barabási and Oltvai, 2004). Graphs have two types, directed and undirected, depending on whether the edges have directions. For example, protein interaction networks are often illustrated as undirected graphs, due to the reciprocal relationship between the interacting proteins, while transcriptional networks or signal transduction networks are often modeled as directed graphs. Here we will use the directed graph for de novo peptide sequencing. The link could be weighted based on the original data. The weight is often inversely represented by the length of the link. In this algorithm, the spectrum is first preprocessed and transformed into a graph, then we devise a graph traversing algorithm so as to obtain the sequence.
Preprocessing of the spectrum for de novo sequencing
The main purpose of spectrum preprocessing and ions grouping is to clean up the spectrum to contain only b- and y-ions and without peaks by partial amino acids, for the ease of amino acid level analysis. The spectrum preprocessing includes the technique of spectrum filtering and isotope. The ion grouping step associates a-, b- and c-ions together as b-ions, and x-, y- and z-ions as y-ions.
Graph construction
To characterize a spectrum, we need three basic elements for the graph: node, directed link and undirected link. Nodes are used to represent ion peaks. The number of nodes in the spectrum graph is k + 2, where k is the number of peaks in the spectrum and the two additional nodes are for 0 and the precursor. The undirected link represents the relationship between b and y pairs. The idea is to employ the known molecular weight of the precursor peptide to associate b- and y-ions as pairs. By subtracting the molecular weight of a b-ion from the precursor weight, we obtain the weight of the accompanying y-ion. Finally, directed links are used to connect peaks toward another peak which has an additional weight of one amino acid. The graph is generated in three steps. First, create nodes for every single peak of b- and y-ions. Second, connect nodes of accompanying b- and y-ions by undirected links. Third, connect nodes which have a weight difference of one amino acid by directed links.
Graph traversing
A graph walking algorithm is then in place to read out the peptide sequence from this particular type of graph. Starting from the node with smallest molecular weight, we work through the directed link (i.e. increasing molecular weight) one after another until no directed link remains. If that happens, then the last undirected link encountered will be traversed instead. After passing the undirected link, work will continue on directed links but with a change of direction (i.e. turn to the inverse direction, which means a decrease in molecular weight). The work will continue until it cannot go any further. Then the last encountered undirected link is passed again and the traverse continues with increasing mass. This process is continued until the reading of the sequence is complete.
4.3.4 Quantitative proteomics
Quantitative measurements of abundance (in terms of concentration, molecule number (mole), or total molecular weight) of multiple peptides across different experimental conditions are an important goal of proteomic investigations or quantitative proteomics. However, this depends on whether the technology can provide accurate quantitative estimates across all samples. The stable isotope labeling by amino acids in cell culture (SILAC) method was designed to fulfill in vitro or ex vivo quantitative proteomics (Ong et al., 2002). It is an experiment protocol designed to evaluate paired cell-line samples under two experimental conditions. The paired samples are also cultured with and without an isotope medium, respectively. This is because a variety of noise and bias could occur during both the separation and identification steps of the proteomics process. Hence, a pair of samples are pooled together to go through the same MS process, cancelling out most of the bias. However, the application of this method is confined to cell-based samples, such as in vitro or ex vivo samples, due to the requirement of cell culture. It cannot be used to assay clinical samples directly. For such studies, methods such as isobaric tags for relative and absolute quantification (iTRAQ) can be used.
The recent multiple reaction monitoring (MRM) technique offers reliable MS-based quantitative measurement of clinical samples (Chen et al., 2012). Absolute quantification is achieved by a calibration step in MRM. This technology is particularly useful when the ELISA assay (another technique adequate for quantitative proteomics) is not available, or when multiple proteins are targeted so that MRM offers a multiplexing solution. A proteomic data set, either of binary or quantitative values, can be organized as a peptide by sample matrix, similar to the transcriptomic gene by sample matrix. As such, many contrast level analysis methods for transcriptomics studies can also be used for proteomics data analysis, as long as the underlying assumptions are met, for example, Mann–Whitney tests may be more suitable than non-paired t-tests in MRM data, because peptide concentration across samples may not fit a normal distribution.
4.4 From protein sequences to structures
4.4.1 Protein motifs and domains
Protein sequences dictate their 3-D structures, which in turn determine their functions. Proteins can be organized in a hierarchy of superfamily, family and subfamily, based on their resemblance to structures and functions. From the evolutionary perspective, member proteins of a family are derived from ortholog and paralog events. The former means one protein is the ancestor of the other. The latter means two genes are produced in a genomic duplication event during evolution. The annotation of novel proteins into families is mainly based on their composition domains, which are conserved regions of a family with specific folding structures and functions. Motifs are conserved amino acid sequences of proteins. The conservation of motifs in evolution implies their importance in structures and functions.
The homology of protein sequences can be analyzed by the following methods. First, a multiple sequence alignment can be used to align the residuals of related protein sequences. Second, a position specific scoring matrix can be constructed. Highly conserved residuals can be identified as motifs. Highly conserved regions are annotated as domains. The sequence signature of a protein family can be represented using regular expressions, or hidden Markov models. They can be used to check whether a newly discovered protein belongs to this protein family.
Protein domain information can be found in Pfam, while motif can be found in Prosite. Protein structure information can be found in PDB and SCOP (Box 4.1). All these resources have been integrated into a single portal called InterPro. Using the graphical presentation of InterPro, it is easy to see that the boundaries of protein domains annotated by different algorithms are slightly different.
4.4.2 Computational protein structure prediction
Proteins are the structural and functional components of a cell. The functions of proteins are largely determined by their 3-D structures (sometimes called shapes or conformations). A protein may have multiple conformations. They undergo conformational change to alter their functions. The structure has multiple layers of regularities. The primary structure refers to the 1-D amino acid sequences. The secondary structure is the highly regular local substructure of the small segments of proteins known as motifs. Alpha helix and beta sheet are two common secondary structures. The tertiary structures refer to the 3-D structures of a single protein. The quaternary structures refer to the 3-D structures of protein complexes, which are important conformations, because proteins usually form complexes to fulfill their roles.
Protein structure can be experimentally determined by X-ray crystallography or nuclear magnetic resonance (NMR) spectrography. The former requires the purification and crystallization of proteins. The latter can only be used to analyze small molecules and also requires the purification of proteins. Many determined protein structures have been documented in a public domain database PDB (Box 4.1). The determination of a protein structure experimentally is challenging. For example, the structure of many membrane proteins cannot yet be determined.
Computational approaches for the determination of protein structures are thus very important to fulfill this unmet need. One approach is by ab initio protein folding, which means the estimation of 3-D structures from the “folding” of 1-D amino acid sequences. This is based on a global minimization of free energy considering the atomic interactions. In the interest of time and resource saving, local optimization may be implemented in practice and gradually converge to globally sub-optimal results.
A protein family is a collection of proteins with similar structures, which are evolutionarily conserved to carry out important protein functions. If the structure of a family member can be determined experimentally, the rest of the family members can be computationally folded by the use of known protein structures. Folding by known protein structures can dramatically save time, as the computation now addresses only the local minimization of energy.
When no known protein structure is available in a protein family, then computation become more challenging. Recently, software of EVfold_membrane has demonstrated excellent performance in the de novo folding of alpha helical transmembrane proteins without the use of known structures (Hopf et al., 2012). This software is based on the assumption that if two amino acid are physically bound and are of structural importance, then they should co-evolve together. By analyzing the amino acid sequence of a protein family in evolution, the co-evolved residuals can indicate the potential bonding, thereby guiding the computational folding of the structure efficiently.
The design of drugs to antagonize disease-r elated proteins requires their structural information. Computational software has been developed to simulate the interaction of small molecules into macromolecules such as proteins. This is called docking.
4.5 Protein interaction networks
Proteins exert their functions through physical interaction with each other. An enzymatic process is a typical example, where an enzyme makes physical contact with its substrate and then triggers a reaction. Many receptor proteins on the cell surface need to form a dimerized or trimerized (another type of interaction) structure before they can function properly and send an external signal to the cell. Proteins also work in groups or complexes. They interact with several other proteins, concurrently or sequentially, in order to accomplish their function. The studies of physical contacts among proteins can illuminate cellular roles of proteins.
Investigations on protein interaction networks so far have been restricted to simpler organisms such as the budding yeast (Saccharomyces cerevisiae). A study employed 725 baits, including 100 protein kinase, 36 phosphatases and regulatory subunits (as well as 86 proteins implicated in DNA damage response), covering approximately 10% of the predicted total yeast proteins (Ho et al., 2002), and 1578 preys were identified, comprising another 25% of the yeast proteome. The complexes were separately identified from different subcellular compartments, including the cytoplasm, cytoskeleton, nucleus, nucleolus, plasma membrane and mitochondria.
It should be noted that protein interactions vary in time and space. The natural barrier of cell compartmentation may prohibit certain pairs of proteins from interacting. But this natural barrier may be disrupted in some experiments of Y2H or ColP, resulting in false positive interactions. One other problem for the Y2H assay is that it lacks time information. If two proteins are always expressed at different times, they do not have the opportunity to bind, although they may give a positive signal in the artificial reporter system.
4.5.1 Filtering and integration
A complete characterization of all protein interactions in a species is challenging. The data may contain false positives, while at the same time being incomplete (von Mering et al., 2002). This requires data filtering and integration to improve data quality.
A filtering of interactions based on prior knowledge of protein compartmentation can reduce the number of false positives. Furthermore, the interaction of proteins in their native forms may vary in time, yet an experiment usually only captures a snapshot in a particular cellular state. Interactions occurring at different time points may be missed by the experiment. Considering the distinct strength and weakness of different technological platforms in terms of sensitivity and specificity, it is often useful to integrate results from different experiments and different platforms, rendering a more complete picture (von Mering et al., 2002).
4.5.2 Data presentation
Presentation of interaction data is critical to reveal underlying structures, and facilitate the reasoning and computation, as well as storage. It is imperative to present a global view of protein interactions in the context of networks in various cells, tissues or species under different conditions.
Protein–protein interaction can be represented as a 2-D matrix (Guruharsha et al., 2011). If we rank proteins in both the column and row of the matrix, then a dot in the matrix represents an interaction. Because the interaction between two randomly selected proteins is rated, this presentation will result in a sparse matrix. A sparse matrix representation is easy to implement but requires a huge amount of space, particularly when the number of proteins is large.
A graph with nodes and links can present a global view of a protein interaction network of an organism. Nodes represent proteins and links indicate the interaction. A graph or network is normally presented using either a link list or hyperlink data structure, which can carry the same message as a sparse matrix. A link list representation is economical in storage and also facilitates a web presentation of hyperlinks connecting web pages of protein which interact with each other.
After the network was constructed from experimental data on budding yeast (Ho et al., 2002), hubs were identified, which had more links than average to other proteins. A following series of gene knock out experiments showed that the hubs were essential proteins, which are critical for survival.
4.6 Case studies
4.6.1 Interactions of viral proteins and human proteins
Viral infections are known to cause a variety of human diseases, including cancer. Viral proteins are expected to elicit a spectrum of pathogenic events. It has been well accepted that cancer is a genetic disease where a spectrum of somatic mutations drives the initiation and progression of this disease. At the same time, viral proteins are known to interfere with the function of tumor suppressor genes such as TP53 and RB, thereby shutting down the endogeneous cancer prevention mechanisms. It was argued that a systematic evaluation of viral protein vs. human protein interactions can decipher additional carcinogenesis mechanism elicited by the viral protein (Rozenblatt-Rosen et al., 2012).
Rozenblatt-Rosen and colleagues conducted a systems level investigation on viral open reading frame (ORF) proteins of four different viruses, including human papillomavirus (HPV), Epstein–Barr virus (EBV), adenovirus (Ad5) and polyomavirus (PyV). The first step utilized the viral vs. human protein interactomes detected by Y2H experiments. Interactions were then validated by the tandem affinity purification MS on a human cell line expressing the viral protein ORFs.
The next step was an assay of transcriptomic alteration in response to the stimulation of viral proteins, which has been validated to interact with human proteins. Many cancer pathways are thus illustrated.
4.6.2 Detecting proteins which selectively interact with epigenetically modified histones
Epigenetic modifications of histone proteins may affect the binding of transcription factors, thereby altering RNA expressions. However, the transcriptional factors, which show specificity to modified histones but not unmodified ones remain unclear. Characterizing these proteins is an important step toward a systematic understanding of epigenetic regulations.
Vermeulen et al. (2010) set out to investigate the proteins which interact only with modified histone proteins. Two expression activating modifications (H3K4me3 and H3K36me3) and three expression suppressing modifications (H3K9me3, H3K27me3 and H4K20me3) were investigated. They employed forward and reverse SILAC assays together with the chromatin immunoprecipitation (ChIP), by which the nuclear extracts were pulled down by modified (e.g. H3K4me3) and unmodified (e.g. H3K4) histones for comparison. HeLaS3 cells were cultured in heavy and light media. In the forward assay, cell lysates with the heavy label were pulled down by modified proteins, while those with the light label were pulled down by unmodified proteins. The opposite arrangement of label was also used in the reverse assay to balance out the different label efficiency. Proteins specifically interacting with modified histones were identified by a large ratio of heavy ions against the pairing light ions in the forward assay, as well as a small ratio in the reverse assay. MaxQuant was used for spectrum data analysis.
4.6.3 Identifying protein composition of mitotic chromosomes
Most chromosomal proteins involved in the mitotic stage of the cell cycle remain unknown, despite a handful of kinetochore genes which have been well characterized. It is a challenge to identify mitotic chromosomal proteins, due to difficulty in the isolation and purification of this sub-cellular organelle without contamination by other proteins. Mitochondrial proteins are a critical source of contamination. In addition, many “hitchhiker” proteins attach to the highly charged mitotic chromosomes (histones are positively charged and DNA are negatively charged) simply by electrostatic forces rather than actually playing a role. Given a high contamination level, the characterization of chromosomal proteins is not merely a protein identification task, but also a classification task aimed to tell apart true chromosomal proteins from false positives such as hitchhiker contaminants.
Ohta et al. (2010) employed five different types of proteomics experiments and one bionformatics analysis, termed six classifiers, for the joint classification of mitotic chromosomal proteins. Although each classifier alone cannot render a result with low contamination, a combination of six classifiers can. The six classifiers are:
Classifiers 2 to 5 employed SILAC technology. These classifiers identify proteins that have a large contrast in light and heavily labeled proteins. Classifier 6 is a bioinformatics analysis counting the domains appearing in chromosomal proteins (but not the mitotic stage of proteins). Since each classifier gives a quantitative result for a protein (e.g. abundance measurement, light/heavy ratio), a multivariate classifier may be used to combine these quantitative results into a dichotomous decision (whether the protein is a mitotic chromosomal protein). The authors chose random forest classifier, decision tree based methods, which generate a combined score for each peptide for classification. Using the chicken DT40 cells as the material, 4000 proteins were identified as mitotic proteins in this way. MaxQuant software was used for platform level analysis, and Mascot was used for protein identification on MS and MS/MS spectra.
4.6.4 Protein codon order affects the translation efficiency
The translation of protein from RNA involves 61 different types of codons, which code for 20 different types of amino acids. Most tRNA associate with only one codon of an amino acid, with the exception that a few tRNAs can associate with two codons of one amino acid. Since a protein is usually composed of hundreds to thousands of amino acids, the same amino acid many appear multiple times in a protein sequence. It is thus an interesting question to ask whether nature prefers the use of the same tRNAs whenever an amino acid is required. To rephrase the question, is the same codon repeatedly used for the same amino acid?
Cannarozzi et al. (2010) analyzed the entire set of protein sequences in yeast. They analyzed all serines, which are encoded by 6 different codons with 4 different tRNAs. They counted the codon co-occurrence and produced a 6 (codon) by 6 (codon) contingency table. This can be collapsed into a 4 (tRNA) by 4 (tRNA) contingency table, if we merge the counts of the same tRNA. Using a Chi-square test, we obtain very small P-values (P < 0.0001), showing that both contingency tables have data distribution deviating from the expected (random) distribution. This shows that the tRNA and codon usage is not random.
Cannarozzi et al. (2010) went one step further to demonstrate that nature prefers the same tRNA to be used repetitively. This can be shown if the counts are more concentrated on the diagonal cells of the 4 × 4 table. This concentration is more enhanced when the standard deviation from expectation of each cell is shown, where the diagonal cells show large positive values, while the others show negative values. Thus they concluded the tRNA is often reused, which is postulated to help the translation efficiency.
4.7 Take home messages
![]() Proteins are classified into families and superfamilies, which reflects their evolution history. Proteins in the same family have similar sequences of amino acids, functional domains and 3-D structure.
Proteins are classified into families and superfamilies, which reflects their evolution history. Proteins in the same family have similar sequences of amino acids, functional domains and 3-D structure.
![]() The homology of protein sequences and structures is critical for characterizing unknown proteins.
The homology of protein sequences and structures is critical for characterizing unknown proteins.
![]() The bindings and interactions of proteins are also critical for characterizing unknown proteins.
The bindings and interactions of proteins are also critical for characterizing unknown proteins.
![]() ELISA and MS-based protein assays are the major platforms for proteomics studies of biomedical topics.
ELISA and MS-based protein assays are the major platforms for proteomics studies of biomedical topics.
![]() Bioinformatics of MS related platforms includes feature (peak) extraction, PMF, ion matching and de novo peptide sequencing.
Bioinformatics of MS related platforms includes feature (peak) extraction, PMF, ion matching and de novo peptide sequencing.
4.8 References
Barabási, A.L., Oltvai, Z.N. Network biology: Understanding the cell’s functional organization. Nat Rev Genet. 2004; 5(2):101–113.
Cannarozzi, G., Schraudolph, N.N., Faty, M., et al. A role for codon order in translation dynamics. Cell. 2010; 141(2):355–367.
Chen, Y.T., Chen, H.W., Domanski, D., Smith, D.S., Liang, K.H., et al. Multiplexed quantification of 63 proteins in human urine by multiple reaction monitoring-based mass spectrometry for discovery of potential bladder cancer biomarkers. J Proteomics. 2012; 75(12):3529–3545.
Cox, J., Mann, M. MaxQuant enables high peptide identification rates, individualized ppb-range mass accuracies and proteome-wide protein quantification. Nat. Biotechnol. 2008; 26(12):1367–1372.
Godovac-Zimmermann, J., Brown, L.R. Perspectives for mass spectrometry and functional proteomics. Mass Spectrom. Rev. 2001; 20(1):1–57.
Guruharsha, K.G., Rual, J.F., Zhai, B., et al. A protein complex network of Drosophila melanogaster. Cell. 2011; 147(3):690–703.
Ho, Y., Gruhler, A., Heilbut, A., Bader, G.D., Moore, L., et al. Systematic identification of protein complexes in Saccharomyces cerevisiae by mass spectrometry. Nature. 2002; 415(6868):180–183.
Hopf, T.A., Colwell, L.J., Sheridan, R., Rost, B., Sander, C., Marks, D.S. Three-dimensional structures of membrane proteins from genomic sequencing. Cell. 2012; 149(7):1607–1621.
IHGSC. Finishing the euchromatic sequence of the human genome. Nature. 2004; 431:931–945.
Karisch, R., Fernandez, M., Taylor, P., et al. Global proteomic assessment of the classical protein-tyrosine phosphatome and “Redoxome”. Cell. 2011; 146(5):826–840.
Listgarten, J., Emili, A. Statistical and computational methods for comparative proteomic profiling using liquid chromatography-tandem mass spectrometry. Mol. Cell Proteomics. 2005; 4(4):419–434.
Mann, M., Kelleher, N.L. Precision proteomics: The case for high resolution and high mass accuracy. Proc. Natl. Acad. Sci. USA. 2008; 105(47):18132–18138.
Martin, D.B., Holzman, T., May, D., Peterson, A., Eastham, A., et al. MRMer, an interactive open source and cross-platform system for data extraction and visualization of multiple reaction monitoring experiments. Mol. Cell Proteomics. 2008; 7(11):2270–2278.
Ohta, S., et al. The protein composition of mitotic chromosomes determined using multiclassifier combinatorial proteomics. Cell. 2010; 142:810–821.
Ong, S.E., Blagoev, B., Kratchmarova, I. Stable isotope labeling by amino acids in cell culture, SILAC, as a simple and accurate approach to expression proteomics. Mol. Cell Proteomics. 2002; 1(5):376–386.
Rozenblatt-Rosen, O., Deo, R.C., Padi, M., et al. Interpreting cancer genomes using systematic host network perturbations by tumor virus proteins. Nature. 2012; 487(7408):491–495.
Vermeulen, M., Eberl, H.C., Matarese, F., et al. Quantitative interaction proteomics and genome-wide profiling of epigenetic histone marks and their readers. Cell. 2010; 142(6):967–980.
von Mering, C., Krause, R., Snel, B., Cornell, M., Oliver, S.G., et al. Comparative assessment of large-scale data sets of protein-protein interactions. Nature. 2002; 417(6887):399–403.