
Clinical developments
Abstract:
Modern medicine has progressed alongside the accumulation and refinement of knowledge of human biology and pathology. This book has shown how new knowledge can be obtained by studies of deep phenotyping and various omics approaches. The next critical challenge is to efficiently translate this knowledge into clinical practices, including diagnostics, prediction methods and therapies. We will explore the clinical developments from three angles:
1. how to define unmet medical needs and also fulfill them;
2. how to develop clinical products;
3. how clinicians can employ the current knowledge to facilitate their practice.
Three different types of genetic tests were used as a demonstration. These tests were unavailable until a decade ago.
6.1 Fulfilling unmet medical needs
Despite a large increase in the volume of medical knowledge in modern times, many unmet medical needs remain, which can be broadly categorized into three types:
The importance of diagnosis for clinical practice cannot be over-emphasized. Only when diseases are precisely diagnosed, can they be properly treated. As there are hundreds or even thousands of commonly encountered diseases with a wide spectrum of personal variation in severity, it is very challenging for a clinician to accurately diagnose the disease in a short time, and come up with a personally optimized treatment strategy. Furthermore, many diseases have very subtle, easily overlooked symptoms, meaning they are diagnosed when they are already at a late stage. An improvement would be if we could devise new diagnostics tools, which are more clinically accessible and sensitive at the earlier stages.
Apart from diagnostics, precise prediction of future clinical outcomes, such as treatment responses, disease progression or relapses, is no less important. A prediction of different courses of disease progression under various treatments would be extremely useful for optimizing personal treatment strategies.
To fulfill these unmet needs, we first need to define them. Thus, an efficient use of new knowledge is required to advance clinical practice with earlier diagnosis and smarter medical intervention.
6.1.1 Status quo vs. future events
In previous chapters, we saw that the combination of multiple omics technology can illuminate the molecular workings of biological systems. They are equally powerful in addressing specific unmet medical needs. But what type of study is adequate, and which is the right omics platform? We must first be clear about whether the need is about the “status quo”, such as the current disease state or the underlying mechanisms, or about the future events, such as disease onset or progression. A typical transcriptomics or proteomics study involves the examination of biological specimens under different conditions, for example, cancer vs. non-cancer. The detected gene expression differences may reflect the underlying disease mechanism or indicate the current stage (or severity) of the disease. This so-called “status quo” investigation can be used to reveal currently altered genes and decipher disease mechanisms. New treatment strategies and diagnostic methods can then be derived. However, the disease vs. non-disease comparison is often not useful for capturing biomarkers to predict disease events ahead of time, because the detected gene alteration often occurs after rather than before the onset of the disease (Figure 6.1). To capture predictive biomarkers, a prospective study is often required to correlate the baseline gene (i.e. biomarker) alterations with imminent clinical events occurring later on. Another approach is by the use of germline variants. Genotypes of germline variants are fixed at birth, presumably ahead of disease onset.
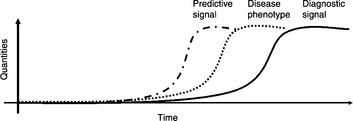
Figure 6.1 A time-course illustration of disease phenotype and biomarker quantities. The dotted curve shows the onset and progression of the disease phenotype. The solid curve represents a quantitative biomarker, which is often detected in comparison of diseased and non-diseased samples. This biomarker may offer diagnostic signals. The dash-dot curve represents a prediction biomarker which arises ahead of disease onset. This type of biomarker usually cannot be found in conventional case vs. control studies
6.2 Translational medicine
The utilization of existing biomedical knowledge into medical practice is called “translational medicine”. One typical scenario is to validate the promising hypotheses derived from exploratory cell-line experiments, animal models or clinical observations, using human samples with adequate sample size, which is no trivial task. Multiple steps are required in sequence for translational medicine. First, if the prior evidence is established on cell lines or animal models, corresponding human studies need to be conducted. Alternatively, if the exploratory knowledge is already derived from retrospective clinical observations or from prospective clinical studies, then we can move on to the next step (validation) directly.
Second, a validation of the exploratory findings is required. This could be done in either the retrospective study of an independent cohort of patients, or prospective study, depending on the task. Prospective validation is usually required to establish the drug efficacy biomarkers (Patterson et al., 2011).
Third, before moving on to clinical trials, the practical format of the product, such as the drug, treatment, biomarker device, etc. needs to be designed and manufactured (and even approved by authoritative agencies) with consistent performance. Finally, a series of adequately powered clinical trials are needed to test the product in human subjects so as to demonstrate its clinical use.
6.2.1 Challenges and tips for translational medicine
The first challenges encountered in translational medicine are about effect size. Exploratory findings are often justified by small P-values, representing that observed biological effects are genuine as opposed to random fluctuations. P-values are defined statistically as the probability of rejecting the null hypothesis when the null hypothesis is true. In other words, P-values are related to the probability of false positives (Fp). They do not quantify the effect size. A genuine etiology of disease will be seen as a small P-value, as long as the sample size is sufficient, no matter how small the effect of the size is. This will pose a problem for clinical utilization because we need an effect which is both “genuine” and “large” for practical clinical applications. Since most claimed biomarkers capture genuine but small effects, a collection of them are often required to cover most of the important etiologies of a certain subtype of disease. Even though such a collection of biomarkers (also called biosignatures) can be identified, we still need to combine them and construct clinically useful prediction models and demonstrate their performance. Multivariate analysis is thus required and performance indexes need to be established.
The second challenge is that the validation may require prospective studies, as opposed to the retrospective study design which is often employed in exploratory studies. A prospective study means that the classification or prediction is made (often at baseline) before the clinical result is manifested. A review of FDA approved biomarkers prediction treatment effects shows that efficacy related biomarkers are mostly validated by prospective studies, while the safety related biomarkers are validated by retrospective studies (Patterson et al., 2011). Survival analysis is particularly useful for analyzing longitudinal data often produced by prospective studies.
The third caveat on translational medicine is the need to replace relative values with absolute values. Gene expression differences obtained by exploratory transcriptomic and proteomic studies are often based on relative values. We need to estimate the absolute gene abundance by different quantitative assays. The conversion of assay platforms means that some original observed effects may not be seen in new platforms.
The fourth caveat is that translational medicine may only improve scientific knowledge but cannot guarantee clinical application in a short period of time. For example, mutations on CFTR were discovered to be responsible for cystic fibrosis in 1989 (Rommens et al., 1989). Since then, a variety of translational medicine strategies has been imposed but none has actually resulted in a routine therapy so far, despite a drastic increase of knowledge on ion channels (Pearson, 2009). Hopefully, the knowledge can be successfully translated into clinical use in the near future.
6.2.2 Regression based methods for biosignature
Many biomedical investigations are designed to detect clinical variables (e.g. age, gender, body weight), biochemistry measurements (e.g. serum CRP levels), genomic variants, gene expression levels, or peptides abundance, which show significant differences in different clinical conditions (e.g. health and disease). A step toward clinical use is to classify subjects into clinical conditions based on the variables. Often one variable is not enough to classify subjects correctly, because of limited effect size. In biomedical terms, this variable captures only one of the etiologies of the complex phenotype. A combination of multiple parameters may achieve a better result of classification. Regression based methods are one class of multivariate analysis, which has two general purposes:
These methods include linear regression, logistic regression, ordinal regression and Cox regression. For example, a logistic regression equation can depict the relationship between clinical phenotypes (dependent variable) and abundance of peptides (independent variables).
How many independent variables (e.g. number of serum proteins) are suitable for a logistic regression model? This actually depends on the sample size of the two groups. An empirical index, called events per variable (EPV) is defined as the sample size of the smaller group divided by the number of variables. Peduzzi et al. (1996) suggested that EPV should be larger than 10.
The independent variables can be both quantitative and binary. Hence, they have the potential to combine clinical variables, proteomics, transcriptomics and genotype data.
6.2.3 Survival analysis
So far we have seen analysis of association between omics variables and clinical phenotypes. Such a study basically examines the cross-sectional connection, where the number of subjects in clinically distinct groups provides the power for statistical analysis. Though useful, this type of analysis does not use a very important dimension of the patient: the time dimension. In fact, many biomedical effects are illustrated longitudinally where time is an important factor. Examples include the expected time of tumor relapse after surgery, the expected length of time before death, etc.
Survival analysis is the analysis of such data. It has three main uses:
1. presentation and visualization of longitudinal data;
2. the prospective (and also retrospective) demonstration of the difference in clinical progression of distinct groups;
A survival analysis starts with the definition of events, which are critical phenotypic change and the time to which this is evaluated. An event could be, for example, tumor relapse, death, an enlargement of tumor, etc. Evaluation of overall survival is by the event of death. Overall survival is particularly important in clinical studies of cancer, as the extension of survival time is a critical goal for late-stage cancers.
Kaplan–Meier curves are important tools for the presentation and visualization of longitudinal data in survival studies (Figure 6.2). The horizontal axis shows the time (months) to event. The vertical axis shows the percentage of subjects who have not yet encountered the event.
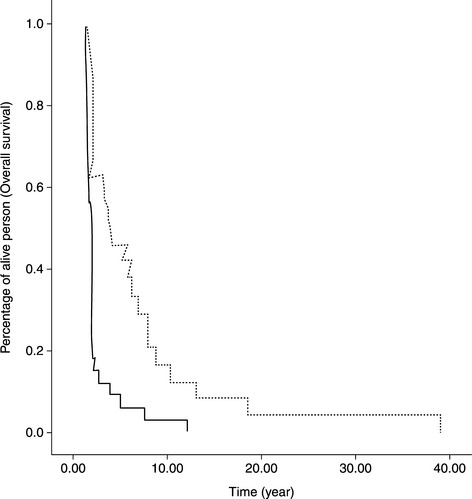
Figure 6.2 A typical Kaplan–Meier plot of survival curves. Solid and dotted curves represent two different groups of biomarker stratified patients
An incidence of event is revealed as a sudden drop in the curve. A Kaplam–Meier plot can show a single curve or multiple curves, representing different subject groups, such as patient groups stratified by a biomarker. Survival analysis could be used for both the exploration and validation of potential clinical biomarkers. Statistical tests, such as the log-rank test and the Wilcoxon test, could be used for comparison of two groups. The tests examine whether two curves are different, representing different clinical manifestation in time of two groups.
Exploration of associated markers is basically done by the Cox proportional hazard model when the variables are continuous (as the gene expression measurements). Cox regression can also be used when there are two or more independent variables.
In survival analysis, two terms are frequently confused, the “progression free survival” and “time to progression”. They are different when death occurs before progression. The former considers it as an event, while the latter considers it as censored data (Saad and Katz, 2009).
6.3 Clinical product development
6.3.1 Performance indexes
Clinical products such as drugs, prediction assays and diagnostic devices all need to demonstrate clinical availability and clinical utility before they can be used. A diagnostic device also needs to present assay utility. Clinical performance indexes reflect the level of clinical utility. The indexes include sensitivity, specificity, positive predictive value (PPV) and negative predictive value (NPV). They are based on the counts of samples, which were accurately or erroneously classified by a diagnostic or prediction test. Four important counts include Tp (true positives), Tn (true negatives), Fp (false positives) and Fn (false negatives). The subjects with positive clinical status are either truly declared as positives (Tp) or falsely declared as negatives (Fn). However, subjects with negative clinical status are either truly declared as negatives (Tn) or falsely declared as positives (Fp). The total number of predicted positives is Tp + Fp. The total number of predicted negatives is Tn + Fn (Table 6.1). The total number N = Tp + Tn + Fp + Fn.
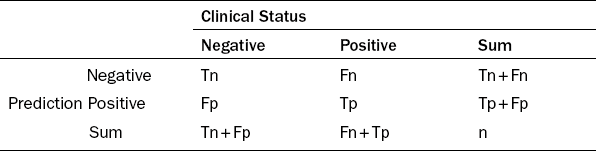
The sensitivity is defined as the portion of Tp within all clinical positives, i.e.:
PPV is defined as the portion of Tp within all the predicted positives, i.e.:
The importance of indexes and their acceptable ranges depends on clinical applications. Sensitivity may be more important than specificity if the assay is developed for an early diagnosis of cancer, and the positive results can be confirmed by further medical examinations. A typical example is the prediction of the adverse drug reaction known as the Steven Johnson syndrome by an HLA allele. The sensitivity, specificity and NPV have all reached above 90%, an extraordinary performance. Yet the PPV is very poor, at less than 10%. This is because the particular HLA allele is rare in the population. This does not hurt the clinical application of this test, because as long as the test is negative, we are confident that the adverse drug reaction will not occur due to the high NPV of this test.
It is important to note that the proportion of positive cases can affect the values of PPV and NPV. In such cases, meaningful PPV and NPV are derived only when the proportions of positive cases are similar to the incidence, defined as the risk of developing a clinical status within a specified period of time. A prospective study is usually preferable for estimating PPVs and NPVs, because the clinical status automatically follows the incidence.
A diagnostic test usually gives a quantitative measurement, and a cutoff value is used to decide which range will be considered as positive and which range as negative. For example, when the logistic regression equation is used to render a probability of (positive) occurrence, which is in the range 0 and 1, then a cut off in between can dissect the range into positive and negative zones. The performance value is thus a trade off between these indexes, which is controlled by a cut off value. At one extreme, if we assign all subjects to be positive by setting the cut off at 0, then sensitivity will be 100%, yet specificity will be 0%. Alternatively, if the cut off is to be 1, then sensitivity will be 0%, yet specificity will be 100%.
Using a series of cut offs (usually with a constant increment such as 0.1), a series of corresponding performance indexes can be generated and plotted in a receiver operating characteristic (ROC) curve, an 2-D plot where the vertical axis is the sensitivity and the horizontal axis is 1-specificity. The area under the curve (AUC) is a value between 0 and 1, which estimates the general classification performance using a series of cut offs.
In practice, a test still requires a fixed value of cut off so as to be clinically useful. The cut off can be determined by maximizing one of the following combined measurements:
1. Accuracy: the proportion of accurately predicted subjects amongst all subjects, i.e. (Tp + Tn)/N.
2. The sum of sensitivity and specificity: the goal of which is to maximize both indexes.
3. Youden index: which is sensitivity + specificity − 1.
4. F1 score: Tp/(Tp + Fp + Fn) (note that there is no Tn in the equation).
5. Matthew correlation coefficient: (Tp*Tn−Fp*Fn)/sqrt((Tp + Fn) *(Tp + Fp)*(Tn + fp)*(Tn + fn))
6.3.2 Clinical trials
Clinical trials are critical stages that demonstrate comparatively better performance and manageable adverse reactions of clinical products. They are categorized into four consecutive phases. A phase-one trial usually involves healthy individuals to test the potential toxicity of investigational new drugs (INDs) on the human body. A phase-two trial usually includes a dose escalating study to examine the best dose in terms of maximized drug effects and minimized adverse reactions. A phase-three trial aims to demonstrate the superior or non-inferior treatment effect of the IND compared with a placebo or existing drugs. This is done by comparison of different treatment protocols called arms. As the treatment of the placebo may have ethical issues, many current trials choose to compare the drug with existing drugs and try to establish superior or non-inferior effects and with less adverse drug reactions. A phase-four trial is often conducted after the drug is already on the market.
Clinical trials are designed to ensure objectivity. Basically, trial subjects need to fulfill several defined criteria (called inclusion criteria) before they can be enrolled. Then they are randomly assigned to trial arms in randomized clinical trials so as to guarantee objectivity. Double-blind studies represent another measure to ensure objectivity if possible. Both the doctor and the patients do not know which arm the patient is assigned to. Also, the pharmacist who prepares the drug does not know which specific patient the drug is to be given to. The clinical design needs to consider the practical applicability of the design. If a clinical trial aims to compare drugs of different types of administration, such as an oral drug and a subcutaneous injection drug, then the patients and doctors will know which drug the patient is taking.
In terms of statistical analysis there are two different types, the intended to treat analysis and the per protocol analysis. The major difference of the two types is on how to deal with subjects who have dropped from the analysis or do not quite follow the protocol. The former will include all subjects who are intended to be treated according to the protocol into the final analysis, while the latter will remove those subjects who do not follow the protocol for various practical reasons.
It is common practice to estimate the sample size of each arm before the trial. The estimation will be based on information such as effect size obtained from previous studies.
6.3.3 Biomarker and drug co-development
This is a lengthy process of drug development from cell-based assays, animal models to the clinical trials, which usually takes more than a decade. Unfortunately, many INDs are failed at various stages of development, and the fail rates are high. Cancer is the field with the highest fail rate since IND (> 85%). One reason for such a high fail rate is that the disease is often heterogeneous and the drug is only effective to a subtype of the heterogeneous disease. One possible solution is to employ biomarkers, which can screen the right subgroup of patients for the drug. It is expected that such a design can more easily demonstrate the effect of a drug, thereby improving its success rate.
In the past decade, we have witnessed a rapid progress in Pharmacogenomics, the study of genetic effects on the efficacy and toxicity of treatment toward various diseases. The progress is particularly prominent in the findings of associations of germline variants on drug metabolizing enzymes (e.g. the Cytochrome P450 family) to the half life of small molecule drugs, and in cancer treatments where the somatic mutations on the drug targets (e.g. EGFR, HER2) and their down streams (kRas) in the cancer tissue play a large role in drug responses. The search of genomic variants and their relationship with protein–drug responsiveness are exemplified by the responsiveness of interferon treatment to Hepatitis B patients.
6.4 Critical use of clinical information
Clinical reports are literally produced daily. New concepts are constantly replacing old concepts, which have been accepted for a long time but then turned out to be wrong. A clinical practitioner needs to employ such a wealth of resources to improve their clinical care of patients. However, these clinical reports are of different quality, which needs to be selected. It is important to check the study design, the statistical result and the conclusion. The P-value is the first value to be checked, to see whether the new proposition is confidently established against the null hypothesis. Effect sizes, such as odds ratios and hazard ratios, will then be checked to see how strong the observed effect is. It is important to discover whether the new proposition is validated in adequate studies. Finally, the performance indexes can be used to gauge whether the reported effect does exist, but also demonstrate the clinical usefulness of classifying patients.
6.5 Case studies
6.5.1 Exploring genomic variants associated to hepatitis C treatment
Chronic hepatitis C is a global pandemic disease affecting 170 million persons worldwide. The hepatitis C virus HCV can be classified as type 1 virus and non-type 1 virus. The former is more difficult to treat. Currently, the standard therapy is a 48-week course of pegylated recombinant interferon subcutaneous injection, combined with the oral antiviral agent Ribavirin. The treatment response is evaluated based on DNA viral load after the treatment course and a 24-week follow-up period. However, treatment responses manifest a great diversity among patients and across populations. Considering the synergistic antiviral effect by the host immune activity and the drug mechanism, the human DNA genotypes may be an important indication to the variability of treatment responses. It would therefore be justifiable to investigate the genome-wide associations between host (human) genotypes and the clinical outcome of standard therapy, a typical Pharmacogenomics study.
Two recent reports, published online in August and September 2009, respectively, represent two success stories of GWAS in this direction. The first report was an achievement of collaboration between Duke University, Schering–Plough Research Institute and Johns Hopkins University (Ge et al., 2009). A cohort of 1671 subjects was recruited from three ethnic groups: the European American, the African American and Hispanics. The subjects were classified into two groups, the sustained virological response (SVR) group and the Non-SVR group, based on the serum viral load detected at the end of the follow-up time. Genome-wide genotypes were obtained using the Illumina Human610-quad BeadChip. A series of quality filters, primarily based on SNP call rates, were employed to safeguard the data quality.
The SNP rs12979860, residing in the 3 kb upstream region of the IL28B gene (also known as Interferon lambda), is strongly associated to the treatment response. The significance level of association (P-value) is 1.37 × 10⁻²⁸, which is based on the trend test calculated by the logistic regression method. Comparing subjects with the risk genotypes CT or TT vs. those of the protective genotype CC in the European-American cohort, the (genotype based) odds ratio of being Non-SVR is 7.3.
Despite the varied allele frequency among different ethnic groups, people with the risk genotypes CT and TT consistently show lower rates of SVR, compared with people with the protective genotype CC. The consistency of association across populations demonstrates that the detected SNP reflects an underlying biological mechanism occurring in all these populations. This suggests the legitimate use of cohorts with mixed population for the detection of biological effects.
However, the authors also observed counter-intuitive findings that the protective CC allele is also associated positively to a higher baseline viral load. Intuitively, higher baseline viral loads represent more serious disease. The contradictory results show that the complex underlying mechanism defies simple explanations.
The second study was reported by Japanese scientists Tanaka et al. (2009). They recruited 142 Japanese subjects infected by Type I HCV for a genome-wide screen. Among them, 64 subjects had null virological response and 78 subjects had virological response. Here null virological response was defined as with less than a 2-log-unit decline in the serum HCV RNA level from the baseline value within the first 12 weeks and with detectable viremia in the 24th week after treatment. Affymetrix SNP 6.0 arrays were used for the genome-wide association to the therapeutic response. They further recruited a cohort of 172 subjects for the validation on a focused set of SNPs. The original GWAS data were filtered by quality filters mainly based on call rates, as well as the Hardy–Weinberg equilibrium tests in the virological response group.
Several SNPs in the IL28 gene were once again detected. The leading SNP rs8099917 (T/G) were detected with the minor allele G being the risk allele of null response. Comparing GG plus GT vs. TT in the genome-wide screening cohort, the chi-square test showed a P-value of 3.11 × 10− 15. The (genotype-based) odds ratio is 30.0.
The repetitive detections of SNPs in the same IL28 region, with different study cohorts across several populations, offer a mutual validation. It is now substantiated that SNPs in the IL28B gene can serve as a predictive biomarker for the treatment efficacy of peg-interferon and ribavirin combination on HCV patients. These studies unveil the role of host immune genes on the antiviral effect, and also demonstrate the credibility of the GWAS approach for pharmacogenomics studies. Most importantly, this test has now been commercialized for clinical use.
Despite the invention of several nucleoside analog anti-HBV drugs, Interferon still remains an important medication for treating HBV infected patients. Interferon is an endogenous innate defense agent against virus infection. The administration of Interferon can theoretically boost the immune system to fight against the viruses. Compared with various nucleoside-analog drugs, Interferon is less likely to invoke drug resistance capability of the viruses.
However, the responsiveness of Interferon for treating HBV patients remains uncertain, because patients usually have to be treated for several months before knowing whether the drug is effective. This motivates us to study the genetic associations to drug responsiveness.
6.5.2 Genetic tests for the adverse effect of Warfarin
Warfarin is the most widely used anticoagulant, which is used to decrease blood clot formation in human blood vessels. It has a variety of medical uses such as in the prevention of clots in patients who have implanted artificial heart valves, the treatment of deep vein thrombosis, pulmonary embolism, and antiphospholipid syndrome.
For years it has been difficult for doctors to give proper doses of Warfarin. If too much of the drug is given, the risk of hemorrhagic stroke and heavy internal bleeding is increased. If too little is given, the expected anticoagulation effect cannot be achieved. Yet, due to the personal difference in the metabolism of this drug and the response to the drug effect, the appropriate dose of Warfarin can vary by a factor of 10 among patients. Until now doctors adjust the dose of Warfarin by their experience and by patients’ responses.
It has been gradually understood that many genomic variants in a gene responsible for the metabolism of Warfarin, namely CYP2C9 (cytochrome P450, family 2, subfamily C, polypeptide 9), and in a gene related to the drug response, such as VKORC1 (vitamin K epoxide reductase complex, subunit 1), are associated to the disease (Yuan et al. 2005). Repeated studies have demonstrated the associations with small P-values (i.e. the association is not likely to be false positive). The challenge for the clinical use of this piece of knowledge is defined as a prediction equation to identify the optimum dose for each subject.
A recent study was conducted to meet such a challenge (Klein et al., International Warfarin Pharmacogenetics Consortium, 2009). This study enrolled 4043 subjects for building the prediction equation (80% of all subjects), and used 1009 subjects for validation of this equation (20%). The best dose for each subject was known and used to train the parameters of the equations. The R2 was used to test the accuracy of prediction. A Warfarin dose algorithm based on several clinical and genetic variables such as height, weight, age and genotypes was developed. This algorithm is more precise than the clinical algorithm and fix-dose approach, especially for the population that required 21 mg or less of Warfarin per week or 49 mg or more per week for therapeutic anticoagulation. Besides, this genetic test result can tell us why the average Warfarin dose for Asians is lower than the dose for Europeans.
6.5.3 Tests for the need of preventive treatment after surģery
The Oncotype test aims to estimate the probability of post-operative distance recurrence (i.e. metastasis) in women with early stage breast cancer. It was developed against the background that preventive chemotherapy (i.e. Tamoxifen) was prevailingly prescribed to breast cancer patients after surgical treatment, for the sake of avoiding distant recurrence. The probability of post-operative distant recurrence with Tamoxifen treatment is about 15% in 10 years. It is thus suspected that not every patient will have recurrence and require preventive chemotherapy. A reliable predictive test is thus in great demand to indicate whether the preventive medication is required for a particular patient.
Unlike the two aforementioned tests, which are based on genomic (DNA) information, the Oncotype test relies on RNA information. A reverse transcriptase polymerase chain reaction (RT-PCR) method was developed to assess RNA expressions on surgical tumor tissues. The expression measurements of a panel of 21 genes (16 cancer-related genes and 5 reference genes) were combined using a regression model, and the estimated probability was given by a recurrence score between 0 and 100. This model was first developed on 447 subjects, then prospectively validated on 668 subjects (Paik et al., 2004). Due to the relative nature of RNA measurements, the reference genes were selected for normalization purpose. Expression levels of cancer-related genes were first divided by those of reference genes to provide a comparable measurement across subjects. The normalized measurements were basically ratios, which then were taken logarithmically before entering into the equation.
The Oncotype test is commercialized by the company of genomic health (Nasdaq: GHDX). The list price for a test is in the range of $3200 to $3500. The Oncotype test has been on the market since 2004. The revenue of Oncotype DX was $5.2 million in 2005 and $29.2 million in 2006. Major patents were granted in 2006 and 2007. A new test for colon cancer has been available on the market since 2010.
6.6 Take home messages
![]() Diagnostic biomarkers reflect the “status quo”, while predictive biomarkers reflect the probability of future events.
Diagnostic biomarkers reflect the “status quo”, while predictive biomarkers reflect the probability of future events.
![]() Different omics platforms are required for different goals. Case vs. control comparison of gene expression usually cannot find predictive biomarkers.
Different omics platforms are required for different goals. Case vs. control comparison of gene expression usually cannot find predictive biomarkers.
![]() Regression based methods are an important class of multivariate analyses, which jointly analyze multiple factors.
Regression based methods are an important class of multivariate analyses, which jointly analyze multiple factors.
![]() Performance indexes include sensitivity, specificity, PPV and NPV, and the requirement depends on applications.
Performance indexes include sensitivity, specificity, PPV and NPV, and the requirement depends on applications.
![]() Study design, sample size, P-values, effect sizes and validation studies are important aspects to evaluate the information in published literature for enhancing clinical practice.
Study design, sample size, P-values, effect sizes and validation studies are important aspects to evaluate the information in published literature for enhancing clinical practice.
6.7 References
Ge, D., et al. Genetic variation in IL28B predicts hepatitis C treatment-induced viral clearance. Nature. 2009; 461:399–401.
Klein, T.E., Altman, R.B., Eriksson, N., Gage, B.F., Kimmel, S.E., et al. International Warfarin Pharmacogenetics Consortium. Estimation of the Warfarin dose with clinical and pharmacogenetic data. N. Engl. J. Med. 2009; 360(8):753–764.
Paik, S., Shak, S., Tang, G., et al. A multigene assay to predict recurrence of Tamoxifen-treated, node-negative breast cancer. N. Engl. J. Med. 2004; 351(27):2817–2826.
Patterson, S.D., et al. Prospective-retrospective biomarker analysis for regulatory consideration: White paper from the industry pharmacogenomics working group. Pharmacogenomics. 2011; 12(7):939–951.
Pearson, H. Human genetics: One gene, twenty years. Nature. 2009; 460(7252):164–169.
Peduzzi, P., Concato, J., Kemper, E., Holford, T.R., Feinstein, A.R. A simulation study of the number of events per variable in logistic regression analysis. J. Clin. Epidemiol. 1996; 49(12):1373–1379.
Rommens, J.M., Iannuzzi, M.C., Kerem, B., et al. Identification of the cystic fibrosis gene: chromosome walking and jumping. Science. 1989; 245(4922):1059–1065.
Saad, E.D., Katz, A. Progression-free survival and time to progression as primary end points in advanced breast cancer: often used, sometimes loosely defined. Ann Oncol. 2009; 20(3):460–464.
Tanaka, Y., Nishida, N., Sugiyama, M., et al. Genome-wide association of IL28B with response to pegylated interferon-α and ribavirin therapy for chronic hepatitis C. Nature Genet. 2009; 41(10):1105–1109.
Yuan, H.Y., Chen, J.J., Lee, M.T., et al. A novel functional VKORC1 promoter polymorphism is associated with inter-individual and inter-ethnic differences in warfarin sensitivity. Hum Mol Genet. 2005; 14(13):1745–1751.