
11
Measuring Success: You Like Me, You Really Like Me!
A score in a personal branding campaign can be defined as numbers, followers, Facebook friends, blog posts, engagement with fans, and so on. The more engagement you have with your followers and friends, the more success you will have with your personal brand strategy.
Everything in this part of your life needs to be measured, scrutinized, and changed to find that success. As people, we lean on the concept of change to define how and where to focus our energy. If we don’t change or improve, it’s difficult to make an impression to our industry and the public at large.
We don’t want to go all “live your best life now” prosperity guru on you, but measuring your personal brand is crucial to its success. If you are involved in any type of business role, you understand the importance of measurement. You measure the sums on a balance sheet. You track the shipping routes of a transportation company to adjust timing and ship packages on time. You develop measurable systems to track your closing rate through the sales funnel.
Your personal branding campaign is another marketing campaign. The training, planning, and development lead to a set of results about the success of your campaign. The measurement system you use helps you identify whether you’re winning or losing in the world of personal branding.
Why Should You Measure?
Say you have a huge week on your blog, Facebook, and Twitter pages. Your traffic is through the roof. Congratulations! Your follower and friend counts are growing, and people are congratulating you on your awesomeness.
@edeckers: People never congratulate me on being awesome.
@kyleplacy: Fine. Congratulations on being awesome.
You think, “They’re right. I am awesome! My personal brand is going to be the deciding factor in my ability to accomplish my dreams.”
Good for you. You deserve it. We definitely pat you on the back. But let’s back up for a minute. Do you know what the trigger was for that growth? Do you know what you did to elicit those responses? If so, you want to repeat the action and get that boost again.
Finding that nugget of information or that one post that sparked your readers’ interest can be tricky. When you understand what works and what doesn’t, you can build on multiple measures of influence and promotion to supercharge your brand’s growth.
What Should You Measure?
You should measure plenty of metrics in accordance with your personal blog, but the most important ones are reach and engagement.
Reach
Reach is the total number of your connections on every social network. A few hundred on LinkedIn, a few thousand on Twitter, and a few hundred on Facebook—that’s a decent reach. Provided you’ve actually got some kind of relationship with these people, you actually have a decent reach.
Of course, you want to have solid relationships with the people in your networks. You want them to know you, like you, and trust you. That translates into success, because these are the people who want to support you. They want to buy your book, attend your show, read your article, help you find a job, and so on. You’re better off with a small but caring audience than you are with a football stadium full of people who wouldn’t recognize you from Adam. (Hint: Adam didn’t have a belly button.)
Just don’t cheat. We talked in Chapter 5 about yo-yo following, where people follow and then un-follow hundreds and thousands of people just to boost their numbers.
That is not what good reach is! That’s cheating, and it does nothing to boost your personal brand, except to lie to people who don’t actually know whether your numbers are good or not.
We’ve seen plenty of people with tens of thousands, if not hundreds of thousands, of followers, but they’ve only published a few hundred tweets. No one’s tweets are that interesting. The only people who can attract that kind of attention are famous movie stars who go on talk shows and announce, “I just joined Twitter. I don’t know how it works yet, but I’m on it and I’m having fun.”
Those people have unusually high follower-to-tweet ratios. But if they’re not famous, then they’re cheating, and it doesn’t actually do them any good. They’re being followed by people who probably aren’t even paying attention to them, which means any time they actually need something, their so-called fans are nowhere to be seen.
When your actual friends connect with you, click on your links, and share your work, that’s called engagement.
Engagement
What happens when you send a tweet or post a Facebook update? Do people “like” it? Do they share it and retweet it with their own connections? That’s engagement. Do they reply or leave comments? Do they click the links you post and read the work you share? That’s engagement.
Engagement is the basic act of people interacting with one of your messages in some way. Rather than ignore it or let it slip by, they engage with it because they thought it was witty, insightful, or interesting.
The more people who engage with your social messages, the better job you’re doing. For one thing, it means you’re becoming more recognized and more interesting to the people in your networks.
How many new people have you discovered because a friend shared her work? How many new friends have you made because another friend introduced you?
Not only is that real networking, but it’s also social media engagement, which means it’s from real people who are really interested in what you have to say.
You can have a high reach with tens of thousands of followers, but if no one actually engages with what you’re doing, then what’s the point? You could have celebrity-level reach, but no one will react to what you’re doing, so all of your effort and work has been in vain.
Erik has seen several authors who have yo-yo followed their way to hundreds of thousands of followers. He saw one recently who had 336,000 followers and was following nearly that same amount. If even one percent of those followers actually engaged with his tweets, that would have been impressive. But that’s unlikely because there’s no way this writer engaged with his own followers. In fact, a quick check of his Twitter stream revealed that he was not. He was just filling his stream with random tweet after random tweet, with no real conversations with anyone. Any books he would have sold would likely have been by accident, because we doubt his strategy was the least bit effective.
In a case like this, quality triumphs over quantity.
Quality versus Quantity
You might be skeptical of the whole “quality, not quantity” argument. However, it does make sense in this new relationship marketing world. The more connected people are to a brand, the more valuable the brand.
Yes, the quantity of your followers on your social profiles is important, but only if you have a high number of the best people. These are the people most likely to support you and your brand. They’re the people in your tribe, in your niche of the world. They like what you like, and they like what you do. If you’re in a 20-something trombone punk band, your audience will not be people your grandparents’ age.
Now, you can build a giant network using yo-yo following (and Erik will spam-block you because he really gets upset by this), but you’re never going to reach all those people.
But if you build an audience of the only 1,000 people in the country who love trombone punk music, you’re going to do well for yourself selling new videos and albums of your concerts for $5 each month.
As Dan Schawbel, author of Me 2.0, said, “Quantity opens doors. Quality opens wallets.”
Visibility
And what about your search engine ranking? Basically, this is your ranking on Google, Yahoo!, Bing, and any other search engine. It’s where your website appears in the different search engine results when a keyword is searched. It’s safe to say that if you’re ranked high on Google (you appear on the first page), you’re doing well!
Remember, your search engine rank varies based on the different topics on your blog. Erik may rank first for “humor blog Indiana” but rank thirteenth for “humor blog.” Erik has to decide which keywords and topics best promote his personal brand story. Determining that involves using Google Analytics to measure how many people have visited certain search engines. But remember, bloggers are no longer measuring specific keywo rds, only topics. So pay attention to which pages people are visiting and forget trying to figure out the specific keywords.
@edeckers: Four years ago, my blog ranked #1 for "animal
fart gene."
@kyleplacy: That sounds about right.
As you have probably already gathered, your visibility depends on your reach. It’s safe to say that the better the quantity and quality of your network, the more visibility you’ll have. Whether you write interesting blog articles or thoughtful tweets, visibility depends on your content and where you share it. The more reach and visibility your brand has, the greater the chances of your followers spreading your brand message.
Influence
Influence is a measure of your online power. How easily can you get someone else to take an action on your behalf?
This idea of influence has been circulating for years and has been debated over and over again. The notion of influence is nebulous and difficult to define. Because it’s more than simply the number of followers and friends you have, you need to define your influence based on your objectives.
Measuring Influence
What does it mean to be influential? What does it mean to push your followers and friends to action in accordance with your personal brand plan? Brian Solis, a thought leader in the world of social currency, defines influence this way:
“Influence is the ability to cause desirable and measurable actions and outcomes.1”
In Chapter 12, “How to Network: Hello, My Name Is…,” we talk about promotion, but the idea of influence needs to be defined based on your objectives. At a basic level, influence is the percentage of people who act upon a specific call to action. Fundamentally, influence is the number of people who do what you ask of them.
Many would say that actor Ashton Kutcher (@aplusk) has more influence than Kyle in the world of social media based strictly on the sizes of their audiences. At the writing of this book, Kyle has 35,800 followers on Twitter, and Ashton has more than 18 million followers. (We rounded Ashton’s number down so Kyle wouldn’t feel bad about himself.) We’re talking about an extreme gap, but who has more influence? It depends on the subject matter and the goal.
It’s easy to assume that if Ashton tweets about entertainment or his latest show on Netflix, he is going to have more influence than Kyle. Ashton is going to get a larger number of people retweeting, sharing, and commenting on his thoughts because he’s a celebrity, and that’s his element. But if Kyle were to tweet something about the tech industry in Indianapolis, he would have more influence than Ashton. (However, Ashton is getting more involved in tech himself, investing in several companies, so he may give Kyle a run for his money.)
This is an important distinction: Influence is not just a raw measure of fame. Your influence is based on your ability to inspire your followers to take action—not anyone and everyone on Twitter, just your followers.
You create your personal brand story to increase your influence within your network. Whether you influence a room at a networking event or get multiple retweets from a blog post, the influence you have depends on where you focus your content and create change.
You can also measure your network’s actions based on the number of visitors your blog receives: The more visitors, the more highly valued your content is. If one of the goals in your personal branding campaign is to increase traffic to your blog, you can measure progress and growth to see if you meet that goal. We discuss measuring yourself with Google Analytics later in this chapter, but it also helps to measure against your competitors. You can gauge what content is right, wrong, or indifferent for your followers and your competitor’s followers.
How Should You Measure?
From Facebook to Twitter to your own blog, each networking site and tool provides opportunities to measure your effectiveness. Armed with this information, you can then measure your effectiveness—and possibly your influence—across the entire Internet.
Measuring Your Blogging Effectiveness
Remember, the blog is the central point of all content on the Internet. It is the hub of your social media branding strategy. It’s the place where stories are told and your personal brand is built from the ground up. You need to know how to measure your effectiveness as a writer and content distributor. You must understand what posts are the most effective and what content your followers and network like and appreciate.
A blog is most effective when you monitor these four extremely important metrics that help measure your personal brand influence:
1. Number of backlinks: A backlink is a link that goes back to your site from an outside site. The more backlinks from trusted, high-value sites you have, the higher your site ranks on the search engines. Search engines like Google use backlinks as one way to measure a site’s credibility. At their simplest, backlinks can come from other authors and readers writing about you on their own blogs and linking back to your own. Think of them as footnotes in a research paper. If Erik writes an article about something Kyle said, Erik links to Kyle’s post to give him credit for the original.
![]() Note
Note
Backlinks used to be a significant tool of search engine optimization (SEO) for helping your blog rise to the top of the ranks. Because of Google’s Panda update in 2011, backlinks are less easy to earn as they once were. Google only counts backlinks from other websites that have been proven trustworthy; shady backlinks on websites that were created just for link farming are often dropped or penalized in Google’s ranking system.
2. Number of posts: No one agrees on the effectiveness of posting several times during a week. The Internet gods have not laid down the law on how often you should post, but the consensus is that more is often better. Once a week is the minimum, but unless you’re part of a media company, several times a day is going to be counterproductive because you presumably have other work you could be doing.
3. Number of comments: This used to be important, but so many spammers have clogged up the comments, it’s not really a factor anymore. We used to work with clients who strongly believed comments were crucial, but we’ve known several popular bloggers who just turned comments off because they not only did nothing, but they were getting clogged with spam.
4. Number of visitors: This is self-explanatory. If your blog has visitors, you have some influence and are compelling people to come and read your posts. Generally, the more visitors a blog has, the more influential it is.
The best way to measure and track all this data is with analytics software. We particularly like Google Analytics, (though it’s not the only system available), which gives you information about things like:
• Which referring sites send you the best traffic?
• Which visitors are most likely to subscribe to your email list?
• Which pages have the highest number of visits?
• Which articles have the lowest bounce rate?
• Where are most of your readers coming from?
• How long are they spending on your site?
Using Google Analytics for Your Blog
Google Analytics can be an extremely powerful tool to increase the effectiveness of your personal brand. These features are easy for even the least tech-savvy blogger:
• The Google price tag: This is the best part. It’s free!
• Usability of the application: Google Analytics is easy to use. Unlike other analytics platforms, Google Analytics is easy to implement, there’s no need for development support, and you can immediately start to collect data that can help you. For more information, check out the Google Analytics Academy.
• Unbelievable amount of data collection: Google Analytics organizes gobs and gobs of data at your fingertips. The system is extremely comprehensive and lets you track all forms of information from visitors to bounce rates. You can create a custom dashboard to easily find the information that’s most important to you.
• Conversion tracking: Conversion tracking helps you measure the effectiveness of your calls to action, which are the actions you want a visitor to take, like buying a product or signing up for a newsletter. You can track and cross-reference that information against other factors on your site. For example, a consultant can use conversion tracking to track visitors to her blog, the campaigns they follow, and how they happened upon the site. She can learn that visitors who find her through Google are twice as likely to sign up for a newsletter than those who come from Twitter. This means she should focus more energy into getting additional visitors from Google and cut back on the amount of time she spends bringing in people from Twitter.
There’s only one reason to use Google Analytics to gather all this data: to tweak your site and your content to create a better user experience. No matter what tweaks are made to your site, you can see what happened based on the changes you made. If Kyle uploads new content and switches around his ads, he can instantly see whether the new positions are more or less effective. From there, he can decide whether to move them back or leave them in their new place.
Setting Up a Google Analytics Account
Before you can use Google Analytics, you need to set up your account.
When you go to the Google Analytics website (www.google.com/analytics), you are asked to access Google Analytics with a big blue button. Click on “Sign Up Now,” located directly beneath the blue “Access” button. This takes you to a page where you can sign in with your Google account. (If you have not set up a Gmail or Google account, be sure to do this first. If you already have a Gmail, YouTube, or Google Drive account, sign in with that account.)
In the next window, provide Google with the URL of the site you want to analyze. As shown in Figure 11.1, fill out the remaining data, including country and time zone, and provide your contact information. After you provide the necessary information to Google, you are given a block of code. Copy the code, and then sign in to your blog. We’ll tell you what to do with that code in a minute.
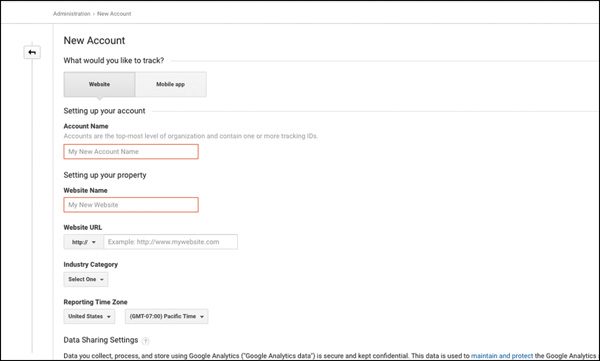
Figure 11.1 Be sure you have the correct information on hand to fill out Google Analytics quickly and easily.
Installing Google Analytics
Now you need to install the analytics code you just copied into your blog. By installing this code, you give Google Analytics permission to pull data from your site and organize it in the analytics dashboard.
Now that you’re in your WordPress blog, click “Appearance” in the left sidebar, and then click “Editor.” Next, go to the right sidebar and click “Theme Header.” Finally, search for the line “</head>” and paste your code right above that. And that’s that!
Most blogs have plug-ins or other easy ways to install Google Analytics. For example, WordPress has more than 250 different easy-to-install plug-ins for Google Analytics. Kyle prefers Google Analytics for WordPress, while Erik uses the Ultimate Google Analytics plugin on his professional site. By using a plug-in on your WordPress account, you can change the setting for the Google Analytics account in your WordPress dashboard. You can also just hand-install the analytics code in your site’s CSS (Cascading Style Sheets) code, but the copy-and-paste method we just did is a little easier.
With the exception of a WordPress.com blog, most blog platforms have instructions on how to install Google Analytics code on your blog. (WordPress.com allows Google Analytics only in their Business package) Find those instructions on your blog platform, and follow them.
Remember the difference between WordPress.com and self-hosted WordPress from Chapter 3? Self-hosted WordPress is where you host the blog on your server. WordPress.com is where they host it on their server. You can’t install Google Analytics on WordPress.com unless you have a Business account.
Getting an Overview of Your Website Performance
You are well on your way to data bliss. Your Google Analytics platform is ready to provide you with the information and data discussed earlier in this section, from bounce rates to conversion tracking. However, the service may take up to 24 hours to begin pulling data from your site.
You first need to pull information to give you a basic overview of your site’s performance. When you log in to your Google Analytics account, you are presented with a dashboard that gives you a snapshot of your data from the last seven, 28, or 90 days or from a custom date range you specify.
At the top of the page is a line graph chart that represents the site traffic over the specified date range. It can compare traffic over a certain period or change the data to show page views. Immediately beneath the chart are further charts which give information on everything from user acquisition to page views. You can also click on the “Audience Overview” link to see additional data and metrics. For definitions of terms in the Google Analytics dashboard, refer to Table 11.1.
Table 11.1 Google Analytics Vocabulary Defined
Visits |
How many visits there were to your page. A visit is defined as a page view when a particular user has viewed no other page on your site in the past 30 minutes. |
Page views |
How many times the pages on your site have been viewed. |
Pages/visit |
How many pages, on average, users view when they come to your site. |
Bounce rate |
What percentage of users left after viewing only one page on your site. |
Average time on site |
How long each user spent on your site |
New visits |
What percentage of your users have not visited your site before. |
Below the “Site Usage” area is the “Visitors Overview” graph, which shows how many people have visited your site. The number is usually lower than the visits figure because many people will be repeat visitors.
You can tell from Figure 11.2—the dashboard from Erik’s company page—that there is a ton of information to take in and analyze. On the left sidebar of the dashboard window (see Figure 11.3), you can click any of the links to read a more detailed report on the information at hand.
It is up to you to spend enough time to fully realize the potential of Google Analytics. Google made some big improvements to Google Analytics between the second and third editions of this book, so it’s now even more useful and powerful for both personal branding and company branding.
Google Analytics also tracks users reaching your site from social networks, like Facebook, Twitter, and LinkedIn—that is, referring sites. These are links you shared on a social networking site (or someone shared it for you), that get clicked on by a new user. By improving your Twitter, Facebook, and LinkedIn use, you can increase your referring sites and create a system to further your personal brand.

Figure 11.2 The Google Analytics dashboard has a tantalizing amount of information for you to read and measure. This is a custom dashboard where you can choose which widgets appear on your dashboard.

Figure 11.3 The dashboard sidebar. This is where you can drill down to find different reports of your analytics, whether it’s the country of origin, the browsers, the keywords, and so on.
Measuring Your Twitter Effectiveness
Of the three major social networking sites, Twitter is the easiest one to measure for your personal brand effectiveness. Although the site has fewer data points to measure, Twitter has made sure to grant access to the most important ones: impressions and total engagement (which includes likes, retweets, link clicks, and replies, to name a few).
You can look at the statistics for all of your tweets for the past 28 days or any of the previous four months and the current month, as well as any custom date ranges. Figure 11.4 shows what the Twitter Analytics dashboard looks like.
Twitter also lets you see some valuable insights into your Twitter followers, including their primary languages, main interests, demographics, buying habits, and even wireless companies.
You can see what kinds of events people are talking about the most, and then develop campaigns—or at least blog content—around those interests. You can even spot some of the recurring trends getting hashtagged, like #TBT (throwback Thursday) and #FollowFriday.
@edeckers: My favorite is #FealtyFriday.
@kyleplacy: Don't you mean #FollowFriday?
@edeckers: It's kind of the same, but with more fanatical
commitment.
Even though most of this information won’t be important to your personal brand, it can be extremely valuable if you run a small company or are a professional marketer. It’s also useful if you want to advertise or promote anything via Twitter—it will give you an idea of the kinds of people you want to reach and whether your product is part of a Twitter trend.
Bottom line: Focus on the basic Twitter analytics. Look closely at your impressions and total engagement data. This will not only tell you what kinds of tweets your audience prefers from you, but you can also measure the times and days that earn you the most traffic, letting you schedule your most important tweets (for example, “I have a new blog post for you to read!”) at the best times, then schedule additional tweets for the other good times.

Figure 11.4 These are some of Erik’s most popular—that is, most engaged—tweets from March 2017.
Measuring Your Facebook Effectiveness
Facebook has a long way to go toward helping individual users measure their marketing effectiveness. You simply can’t measure effectiveness with personal profiles, apart from how many new friends you have.
But if you’re a marketer, there are measurements galore! You can measure effectiveness with insights on your brand’s page. (See “Chapter 6, Facebook: Developing a Community of Friends,” for more information on when you might need a brand page.)
If you launch a brand page, you can check out its reach for the last seven to 28 days as well as today and yesterday. You can see which of your posts have had the biggest reach as well as what kind of engagements they had.
You can also measure the number of page views, followers, and likes for different posts. Remember, however, that Facebook has throttled a brand page’s reach to roughly one percent of its total audience, or one out of every 100 people. So if you’re not very active on Facebook with your page, or you don’t pay to promote your posts, you’re not going to see much activity here.
Measuring Your LinkedIn Effectiveness
LinkedIn gives you the fewest tools to measure your brand’s success. Unlike Twitter, LinkedIn doesn’t provide code to allow programmers to develop measurement applications. But you can measure your personal brand effectiveness on LinkedIn in a couple ways.
A small section within your LinkedIn profile is “Who’s Viewed My Profile.” Here, LinkedIn identifies how many visitors have viewed your profile in a certain number of days by name, title, or industry. If you are looking for a job, the number of profile views you receive should be extremely important to you. The more profile views, the better for your LinkedIn profile. You can see up to five of your profile visitors with the free version (although one or two of them always seem to be “Anonymous,” which reduces the amount of effective information), or all of your visitors with the premium version. Occasionally, “free month” offers let you try the premium version, so you may want to wait for one before you commit to anything.
Next to the profile views section of your LinkedIn profile page is one that lists how many connections you have and how many new people have joined your network in a given number of days. You should pay attention to how many connections you have, because that’s a sign of the strength of your overall network.
Kyle has 1,730 connections, which links him to 8,402,000 people. That means he’s no more than three degrees separated from 8.4 million people, so he can, theoretically, reach that many people via introductions.
In the same area is a line that tells you how often you have shown up in searches over the past day, plus a few of the companies where the people who looked at your profile work, along with their job titles. Of course, you don’t get to know who those people are, but if you’ve applied to some companies that show up on your search results, that can tell you who may be interested in your résumé. Similar to Twitter’s analytics, LinkedIn provides information on the likes and shares of your status updates, as well as those of any articles that you write and publish. Figure 11.5 shows a recent article by Erik about the time he helped the Prancercise Lady with some SEO issues.

Figure 11.5 LinkedIn analytics can give you some insights that the “Who Viewed My Profile?” section cannot.
Measuring Your YouTube Effectiveness
YouTube has its own analytics tool, which lets you see not only how many views your videos have had, but who saw them—including their geography and demographics and the technology they used—as well as subscriber growth, likes and dislikes, and even traffic sources.
To get to your analytics, either:
• Go to your channel home. At the top of the screen is the number of subscribers and views you’ve had. Click the “Views” link.
• Go to your channel, select a video, and then click the “Analytics” button associated with that video (see Figure 11.6). You can do this if you followed the previous step, too.
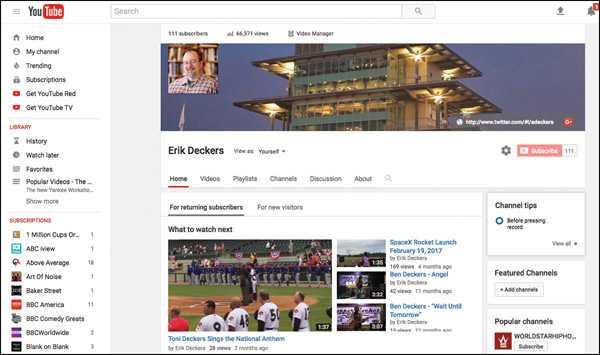
Figure 11.6 The YouTube Video Channel screen. Click the “Analytics” button above the banner photo and avatar photo. You can see it there above Erik’s head.
By examining a particular video’s reports, you can learn a few important factors about how people reacted to it. First, go to the “Audience Retention” section (under “Watch Time Reports”) and watch your video with the audience retention graph. You can see where people have abandoned the video and stopped watching. If you see a spike of departures at a particular point in a video, you can either edit the video to remove the unsuccessful section, reshoot the video, or just know what not to do next time. Figure 11.7 shows the audience retention graph of a video Erik took at the 2016 Indianapolis 500 post-race press conference, after Alexander Rossi won for the first time.
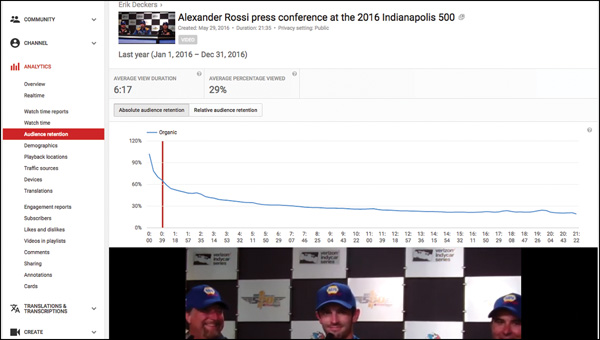
Figure 11.7 The Audience Retention screen on YouTube Analytics lets you watch your video and see when most people abandon the video. This view is for the entire 2016 year. (Video taken by Erik Deckers.)
Also, check “Traffic Sources” to see where people are coming from. In Figure 11.8, you can see the traffic sources for Erik’s Alexander Rossi video. YouTube-suggested videos are those that appear to the right of a video you’re watching.
YouTube’s traffic sources tell you where most people found a particular video. YouTube-suggested videos are always a big source, but YouTube search can tell you what people were looking for when they found your video.
YouTube search results are an important measurement, especially because YouTube is the second largest search engine in the world. Knowing what terms people used to find you can help you optimize future videos.
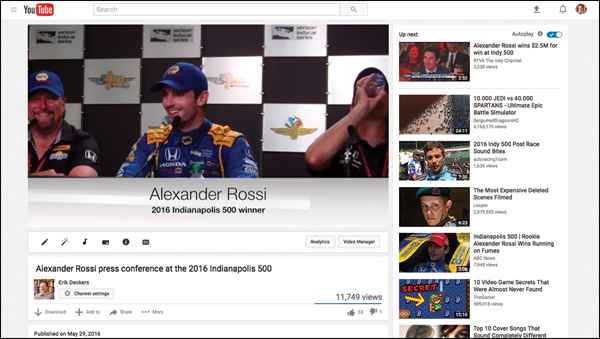
Figure 11.8 Alexander Rossi won the 100th running of the Indianapolis 500, becoming the 10th rookie ever to win the race. Erik’s video of the press conference appears to be the only full press conference video available on YouTube.
If you want to reach people with videos, especially by embedding the videos on your blogs, you can get only so much information from Google Analytics. So pay close attention to YouTube Analytics as well.
Four More Measurement Tools
With so much content and data to measure and track in the world of social media, it’s hard for anyone to keep track of it all. Getting a handle on all the data is made easier when you use tools in addition to those provided by social media sites.
By using different tools to track the information, it becomes easier to become successful in this world of instant communication. Some of this data is fairly accurate, some isn’t very important, but it all sometimes adds a nice boost to your ego. However, most third-party measurement tools charge subscription fees. We recommend only the tools that have a good free option:
1. Website Grader: This tool is brought to you by the same people who created Twitter Grader, HubSpot Marketing. Website Grader enables you to compare your website to a competitor; the report includes blog analysis, blog grade, recent blog articles, Google index pages, and readability level. It also helps you optimize your content from headings to images. It is a comprehensive and worthwhile report.
2. Keyword Position Monitoring Report Service: This tool is a way to check the rankings for a domain for a particular set of keywords or phrases. This is a suitable tool for tracking the progress and ranking for your particular keywords or phrases.
3. HootSuite: We’ve talked at length about this tool. HootSuite offers an analytics suite that helps you track links and create analytics for several different tools. The free version is very limited, only allowing you to connect to three social media networks. At the Professional level, you get full access to all their analytics data. However, you’ll need to use HootSuite as your main posting portal, so you can take advantage of their Ow.ly link shortener.
4. Klout: This was one of the first serious tools designed to measure influence. It takes into consideration your true reach (your engaged audience), amplification, and network influence. Of course, Klout has its detractors because people tend to drop and rise over the slightest changes to their activity—if any of your social networks disconnect from your Klout account, your score will drop, and reconnecting it won’t immediately solve the problem.
5. Bitly: This used to be one of the top link shortening tools available, and the free option was more than enough for any personal branding practitioner to keep track of past tweets, website URLs, and other shared links. But their latest tool only lets you search the last 30 days of your links, and doesn’t share nearly as much information as it used to. If you use it, remember its 30-day limitations.
Effectively Measuring Your Personal Brand
We want to give you the necessary tools to empower you on the road to personal branding success. The tools may seem complicated or difficult to use, but they are designed to be used by regular people, and they can empower your personal brand story. Your main goal throughout this entire process is threefold:
• Understand your social media engagement: Twitter, Facebook, LinkedIn, and even YouTube let you measure your reach, readers, visitors, and connections.
• Use Google Analytics: Get to know Google Analytics if you have a blog or personal website. A ton of data is processed through this system, but you need to understand the implications it has on your personal brand. There are even videos you can watch to better understand how Google Analytics works.
• Use one tool for each network: You have an overall system in Google Analytics, but you need to use at least one tool for each social network. For Twitter, there’s Twitter analytics, and Facebook has its Insights. We like Klout for a overview of trends, but look at each tool individually to be sure.
Overall, it’s about the information you glean from the site and not the measurement tool you use. Data is the most important thing you can get because the numbers and metrics will tell you how influential your personal brand is (or is becoming). Check and track the data to make the most out of the time you have spent developing your personal brand story.
How Can Our Heroes Use Analytics and Measurement?
In the other chapters, our heroes have used our tools and ideas in different ways. However, for measurement and analytics, they each need to measure the same thing: how many people visit their different profiles on Facebook, LinkedIn, and blogs, as well as where they come from and what they look at.
One thing each of our heroes can do is promote their blog posts on their different networks using Google campaign codes. Posts can be promoted via LinkedIn, Twitter, and Facebook, but each time, our heroes should use different headlines or promote them at different times of the day as a way to see which are the most effective. Then, once they know how well a certain type of headline performs or the best time of day to promote a post, our heroes can improve on that.
They can also use individual Bitly or Ow.ly links to promote their posts to specific hiring managers or decision makers and then track whether those managers have opened those links.
Finally, they can use the map function on Google Analytics to see if people from their chosen cities—hiring managers and decisions makers—have visited their websites and blogs.
Do’s and Don’ts for Analytics and Measurement
• Do measure the metrics that give you actionable data: Pay attention to the measurements around your social media activity, such as the posts that get the most click-throughs.
• Do focus on metrics that help you determine your influence in your network: Visits to your blog or the number of Twitter followers or LinkedIn connections are the most useful.
• Do focus your blog’s topics: Track those that give you the best visibility through Internet search terms.
• Don’t use every measurement tool on the Internet: Focus on just the ones that are easy to use and give you the results you need to improve your personal brand.
• Don’t measure every metric available to you: Figure out what it is you need to know to determine your effectiveness and ignore the rest.
• Don’t obsess about your numbers: Check only every couple of days. You don’t need to focus on your numbers hour after hour. Remember, this is about trends, not actual figures. As Erik likes to say, “You want the little line to go up, not down. If it goes down, make it go up.”
Analytics Tips in 140 Characters
• Don’t take it too seriously. —@slicklaroo
• True influence is measured by the conversations you’re having, not the # of followers, Klout score, etc. —@paigeworthy
• Use Klout’s metrics, not its number. Make sure things trend upward. Pay attention to unfollows only if you follow them, too. —@allisonlcarter
• Even if you don’t analyze the data now, make sure to set up the mechanisms to compile it. —@prebynski
• Drive traffic and check measurements on specific landing pages.
—@lorraineball
• If you want to see how influential you are on social media, try helping someone else raise money for their cause. —@charlesbivona
• Klout can provide rough figures, but I don’t worry about small score changes. There may be issues if your score seriously drops long term.
—@joshhumble
• Be concerned more with people and productive, targeted engagement—not purely stats from machines. —@edeckers
• Keep current on your measuring tools’ latest algorithmic changes and updates, and how they can impact your reported influence.
—@edeckers
1. www.briansolis.com/2010/09/exploring-and-defining-influence-a-new-study/.