
Chapter 12. Chargeback, Billing, and Reporting
This chapter covers the following exam topics:
2.0 Chargeback and Billing Reports
2.1 Describe the chargeback model
2.1.a Describe chargeback features
2.1.b Describe budget policy
2.1.c Describe cost models
2.1.d Describe adding a cost model to a tenant
2.2 Generate various reports for virtual and physical accounts
2.2.a Execute billing reports
2.2.b Execute system utilization reporting
2.2.c Execute a snapshot report
This chapter discusses two tightly related components of cloud administration: reporting and chargeback. Having a solid understanding of how well any IT system is operating has been a key part of system and network administration for years, and because of the self-service and automated nature of a cloud, having that understanding is even more important. Details about the current status of the cloud infrastructure, trending information about usage, and historical data are all critical to building and maintaining a private cloud. Robust reporting capabilities are important not only for cloud administrators, but also for the end users and consumers of the cloud as part of the self-service ordering and management of cloud resources.
A key element in distinguishing a cloud model from other networking models is the way in which cloud services are consumed and paid for. Along with providing end users the ability to provision and manage their resources through a self-service portal, generally cloud computing involves having users pay for the resources they are using as an operating expense (OpEx for short). Depending on the cloud provider, users may be charged a one-time fee for ordering a resource; fees based on how long and how many resources they have active; fees based on performance characteristics such as CPU, RAM, and disk; or fees based on some combination of these and other metrics. Chargeback and the related concept of showback refer to the capability of a cloud platform to track metrics, assign them a dollar value, and generate billing reports for individual customers or groups. If an organization uses the billing reports for informational purposes but does not actually implement any financial transfers based on the reports, it is using a showback model. If the organization’s governance model changes such that users and groups begin paying for the usage of cloud services, it has moved to a chargeback model.
“Do I Know This Already?” Quiz
The “Do I Know This Already?” quiz allows you to assess whether you should read this entire chapter thoroughly or jump to the “Exam Preparation Tasks” section. If you are in doubt about your answers to these questions or your own assessment of your knowledge of the topics, read the entire chapter. Table 12-1 lists the major headings in this chapter and their corresponding “Do I Know This Already?” quiz questions. You can find the answers in Appendix A, “Answers to the ‘Do I Know This Already?’ Quizzes.”
Caution
The goal of self-assessment is to gauge your mastery of the topics in this chapter. If you do not know the answer to a question or are only partially sure of the answer, you should mark that question as wrong for purposes of the self-assessment. Giving yourself credit for an answer you correctly guess skews your self-assessment results and might provide you with a false sense of security.
1. Data from an infrastructure report in UCS Director can be exported in which formats? (Choose three.)
a. PDF
b. Comma-separated values (CSV)
c. Microsoft Excel (XLS)
d. Extensible Markup Language (XML)
2. Which action within an infrastructure report typically opens a new report drilling down into more details about a particular object in a table?
a. Open
b. View Details
c. Expand
d. Explore
3. Under which administrative menu option would you find details on UCS Manager accounts added to UCS Director?
a. Administration > Compute Accounts
b. Infrastructure > Physical > Compute
c. Physical > Compute
d. Site > Pod > Compute
4. What types of objects can be assigned to a user or a group in UCS Director? (Choose all that apply.)
a. Virtual machines
b. UCS service profile
c. VLAN
d. LUN
e. Volume
5. Where would you find a report showing the number of virtual machines within a cloud account over the last month?
a. Within a Trending Report under More Reports
b. As part of a Historical Usage report for a virtual data center
c. Within a Summary dashboard
d. This information is not available within UCS Director
6. A Map Report for a cloud account in UCS Director displays which of the following?
a. A graphical topology representation indicating the relationship between VMs, hosts, clusters, and vCenter
b. A color-coded heat map showing relative usage of different components within the cloud
c. Integration with Google Maps to highlight where a selected piece of infrastructure is located
d. A graphical representation of the physical compute cluster, highlighting which physical server is hosting workloads
7. CloudSense Analytics provide administrators with which capabilities not available in other report options in UCS Director? (Choose three.)
a. Combine information from multiple infrastructure reports into a single view
b. Snapshot and save details about the cloud infrastructure at a particular point in time
c. Construct custom executive reports from data throughout the cloud that can be emailed to users
d. Provide forecast and what-if analysis across the cloud infrastructure
8. True or False. Chargeback refers to an IT governance policy where metrics and costs of IT resource consumption are tracked per user or group, and bills for that usage are paid to reimburse corporate IT for supporting applications.
a. True
b. False
9. Within a UCS Director Cost Model, which of the following metrics can be used to calculate costs? (Choose all that apply.)
a. One-time fixed cost
b. CPU cores
c. Memory consumed
d. Network bandwidth used
10. What steps are needed to implement and enforce budgets for a group? (Choose three.)
a. Create and apply a Cost Model to vDCs
b. Enable Budget Watch per group
c. Create monthly budget entries per group
d. Create approval policies and designated approvers for groups
Foundation Topics
UCS Director Reporting
Within UCS Director there are two broad types of reports available. We have referred to and looked at examples of the first type of report many times within this book already. These cloud infrastructure reports encompass all of the different tables and data available within the UCS Director administrator and end-user portals. Each time you have investigated a table of virtual machines, service requests, or VLANs, you were working with a cloud infrastructure report. The second type of reports are CloudSense Analytics, and they provide visibility into the utilization and performance across the infrastructure supporting the private cloud. These reports are leveraged to help answer questions related to utilization, trending, and forecasting. The examples in this chapter show how to access and view the reports through the UCS Director web interface; however, all of the information is also available through the REST API.
Cloud Infrastructure Reports
Cloud infrastructure reports are ubiquitous within UCS Director, and account for nearly all the screens and views both administrators and end users navigate within their interfaces. These reports show a snapshot of the current status of the infrastructure in question based on the most recent inventory polling data. This means there is always the potential for the data being shown to be slightly out of date for details that have recently changed or up-dated. In cases where you know a change has happened in the infrastructure outside of UCS Director, you can manually run an inventory task through the Administrator > System > System Tasks page. Search for Inventory and you’ll see a list of each of the inventory tasks and their details, and be able to kick off an immediate run of the task.
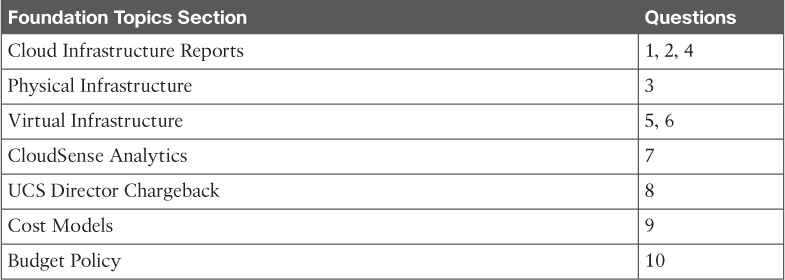
A typical cloud infrastructure report, along with annotations for the common attributes found on all reports, is shown in Figure 12-1. This is the UCS Servers report for a UCS Manager account within UCS Director where the details of the physical servers (not service profiles, but the actual servers) are displayed in a tabular format. No matter what report you are viewing, all will have the following commonalities:
![]() The table can be sorted by any column by clicking the column name and then the up/down arrow to indicate sort direction.
The table can be sorted by any column by clicking the column name and then the up/down arrow to indicate sort direction.
![]() Two methods for searching or filtering the data are available:
Two methods for searching or filtering the data are available:
![]() Entering text in the search box in the title bar for the table will limit the view to only rows that contain the text in any column.
Entering text in the search box in the title bar for the table will limit the view to only rows that contain the text in any column.
![]() Clicking the Advanced Filter button displays the Search in Column dialog box, where you can provide more granular search criteria.
Clicking the Advanced Filter button displays the Search in Column dialog box, where you can provide more granular search criteria.
![]() The default view of the report may or may not show all available columns. Click the Customize Table Columns button, represented by a gear icon, to display or hide individual data columns.
The default view of the report may or may not show all available columns. Click the Customize Table Columns button, represented by a gear icon, to display or hide individual data columns.
![]() The data for the report can be exported from UCS Director for independent view and manipulation. Supported formats are PDF, comma-separated values (CSV), and Microsoft Excel (XLS). Note that the entire report will be exported, including all hidden columns and rows.
The data for the report can be exported from UCS Director for independent view and manipulation. Supported formats are PDF, comma-separated values (CSV), and Microsoft Excel (XLS). Note that the entire report will be exported, including all hidden columns and rows.
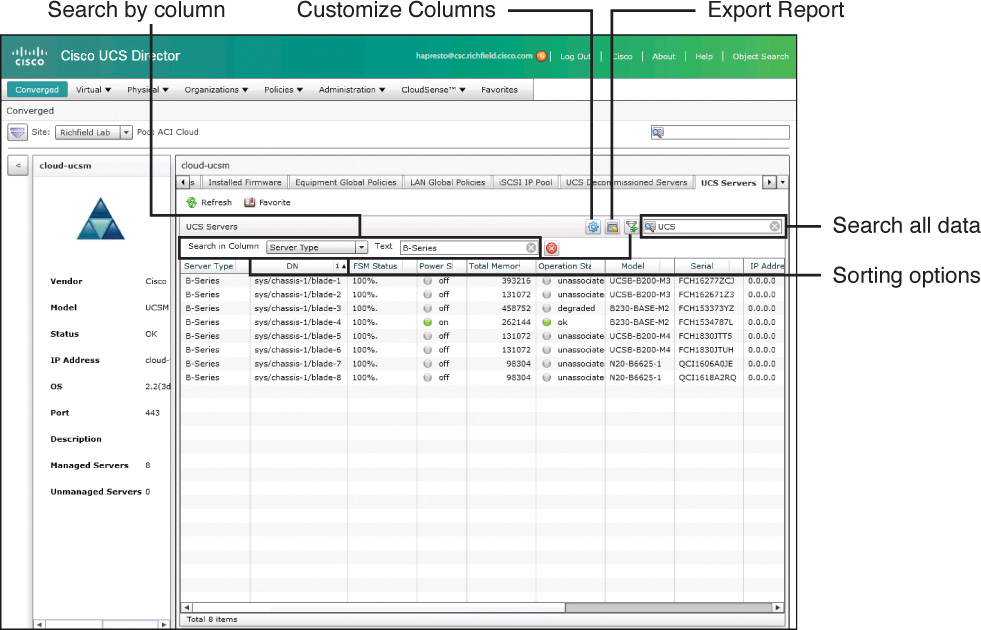
Another important characteristic common to many cloud infrastructure reports is the capability to take action or drill deeper into the infrastructure being displayed. Figure 12-2 shows the same UCS Server report, but this time it has been filtered down to a single blade that has been selected. Once an item in the table is selected, UCS Director shows contextual actions available for the infrastructure being investigated. As shown in the figure, you can take several actions on an individual blade, including Power On or Off and Associate or Disassociate.
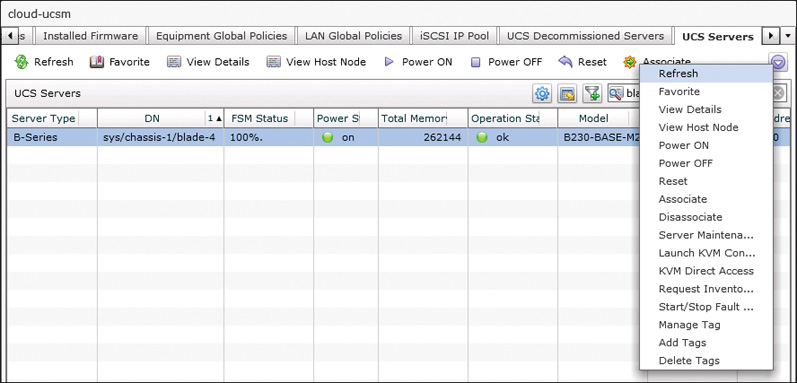
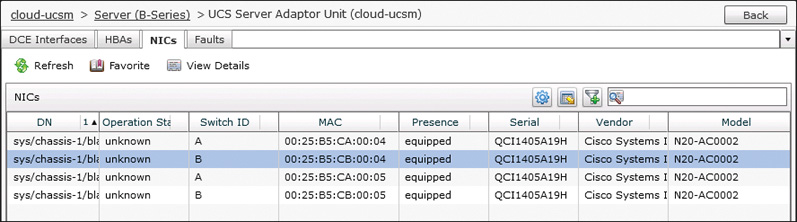
Take note of the option to view details of the blade, an action that is typically also available by double-clicking an item in a table. This action is what will drill deeper into the infrastructure in question. Figure 12-3 shows some of the details available for an individual blade within UCS Director, in particular the type of interface cards installed in the blade. You can see in the figure that once again we can click View Details to see details of the VIC itself, and in Figure 12-4 the logical network interface cards (NIC) that have been created on the Cisco VIC are displayed. It is important to remember when working with cloud infrastructure reports that there is often more information available than what is originally displayed. Get into the habit of looking for links and buttons to view details.
Now that you have an understanding of how to work with cloud infrastructure reports, let’s explore some of the most useful reports that you will leverage within UCS Director when managing both physical and virtual infrastructure.
Physical Infrastructure
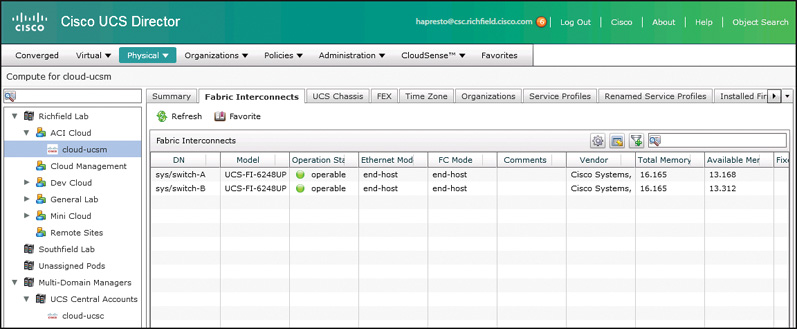
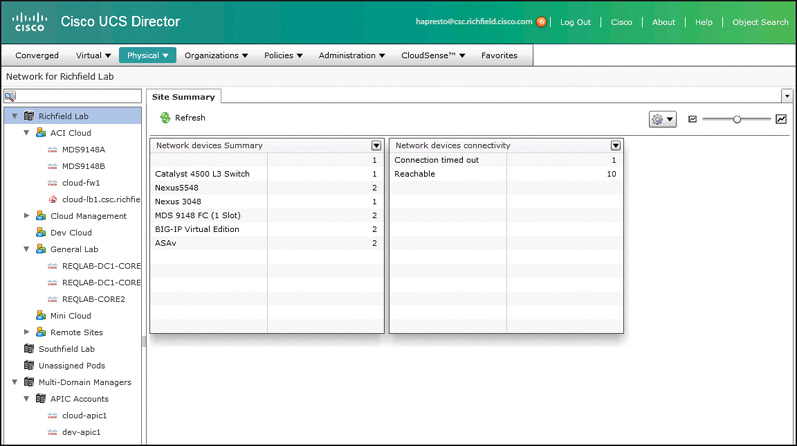
Within the Physical interface menu, you will find options for Compute, Storage, and Network. Each option will enable you to drill into and investigate the physical infrastructure making up your deployment. You can see the Physical > Compute view in Figure 12-5 with a UCS account selected. The first thing to note about the interface is that the organization in the left panel is based on the Site > Pod > Account hierarchical structure used within UCS Director. For example, the deployment used in the figure has two sites, Richfield Lab and Southfield Lab. Within the Richfield Lab site, there are six pods, ACI Cloud, Cloud Management, Dev Cloud, General Lab, Mini Cloud, and Remote Sites; however, not all pods contain compute accounts. Also note that there are two top-level objects that are not sites themselves. The first is Unassigned Pods, which is a special object that will contain any pods that are not specifically assigned to a site object. And the second is Multi-Domain Managers, where you will find accounts like UCS Central that can potentially span across multiple pods and sites.
UCS Compute Reports
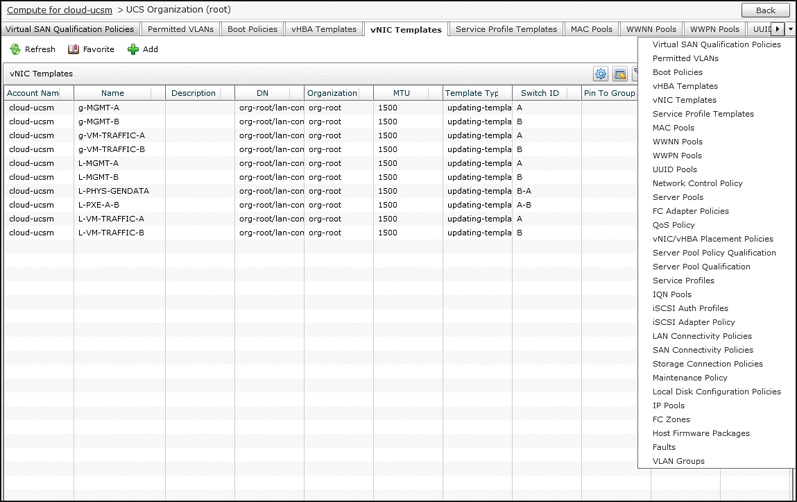
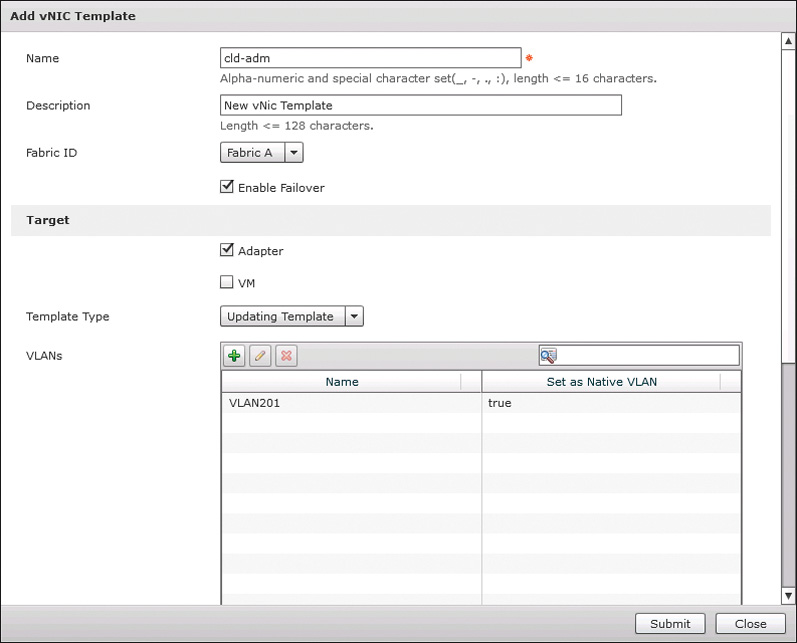
When working with Cisco UCS accounts, you will find many of the interesting reports and interfaces available within an organization. Service profile templates, policies, and pools all exist within a specific organization because the UCS data model is inherently multitenant in structure. In Figure 12-6 you can see all the report options for a specific organization, the root org in the figure. Displayed is the vNIC Templates report, and take note of the Add button available in the display. Another key feature you can leverage in many, but not all, infrastructure reports is the ability to make ad hoc changes to the configuration of infrastructure elements. Here, if you choose to add a new vNIC template within UCS Director, the dialog box shown in Figure 12-7 will be displayed. Within this interface you can specify all the details related to the new template, and upon clicking Submit, it will immediately be configured within the UCS Manager account.
Service profiles are probably the most important object within UCS Manager, and UCS Director makes it very easy to view, manage, and add new service profiles using the Infrastructure Reports. In Figure 12-8 we have moved to the Service Profiles tab under the same root organization view. Here you can see the four service profiles currently created within the system, along with many important details, including association state and assigned server.
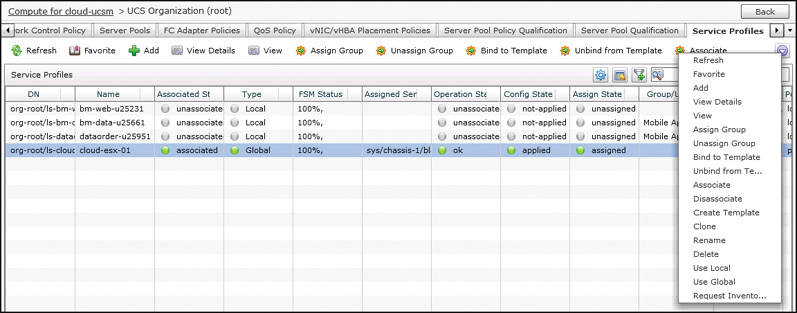
Take special note of the Group/User field in the display. Many objects within UCS Director can be assigned to a specific user or group. When an object like a service profile is assigned to a group, there are two main results. The first is that when a member of the group, or the user, logs in to the end-user portal, they will be able to see the object in their interface under physical resources and take any supported actions on the object. The second is that all chargeback reports and billing calculations will start including that object. Some of the objects that can be assigned to a user or group include virtual machines, UCS service profiles, VLANs, and LUNs.
Physical Network Reports
Now let’s move to Physical > Network and investigate some of the valuable reports features for administrating that part of the infrastructure. The initial view presented here, shown in Figure 12-9, is similar in organization to what we saw with Physical > Compute in Figure 12-5. Figure 12-9 also highlights an important characteristic of UCS Director: its multivendor capabilities. UCS Director supports not only Cisco infrastructure in compute, network, and storage, but also many other vendors used in enterprises (to see the hardware compatibility list for UCS Director, visit Cisco.com). In Figure 12-9 you can see that an F5 BIG-IP Virtual Edition Load Balancer has been added to the ACI Cloud pod.
Within UCS Director, physical network objects include both Ethernet and Fibre Channel switches, security devices, load balancers, and SDN controllers such as the Cisco Application Policy Infrastructure Controller (APIC). In Figure 12-10 you can see the VLANs report for a Cisco Nexus 5000 Series Switch. Though it would be more common to leverage the infrastructure automation capabilities to build a workflow to add a new VLAN to all switches in your data center, you can very easily view and add or remove VLANs within the cloud infrastructure report view of UCS Director.
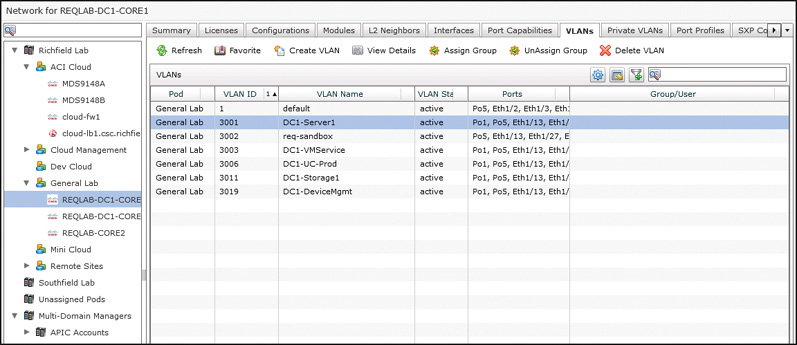
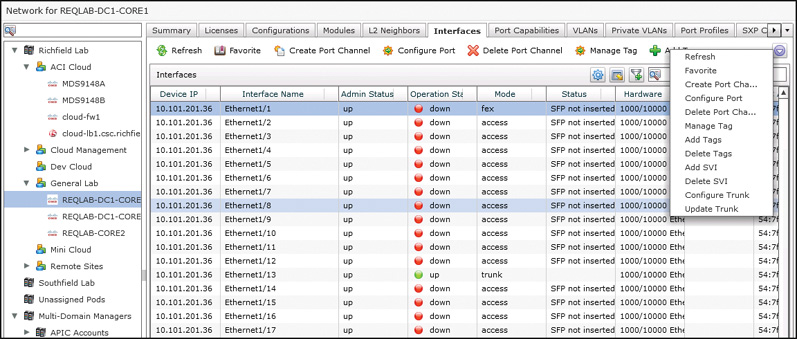
Figure 12-11 shows the Interfaces report on the same physical switch. This view makes it very easy to see the current state of all the interfaces on an individual switch, as well as make live configuration changes. Some of the useful actions available in the interfaces context include
![]() Create and manage port channel interfaces
Create and manage port channel interfaces
![]() Enable/disable ports (that is, no shutdown/shutdown)
Enable/disable ports (that is, no shutdown/shutdown)
![]() Configure and update VLAN trunk interfaces
Configure and update VLAN trunk interfaces
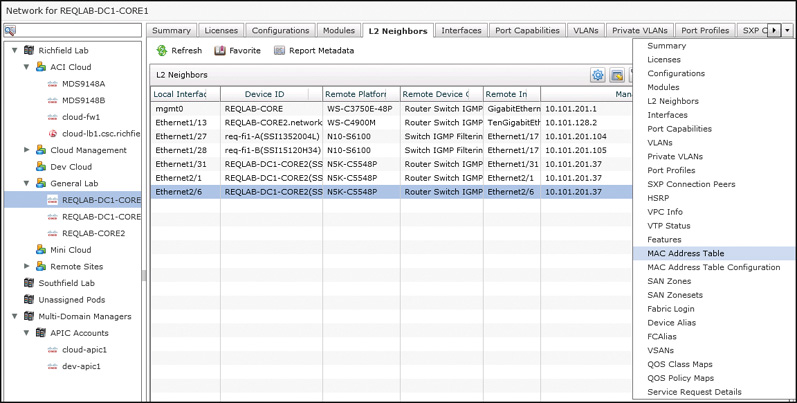
The last report we’ll look at with this Nexus switch is the L2 Neighbors report shown in Figure 12-12. A common operations task for network administration is to identify connected devices to an individual switch. This report displays details from Cisco Discovery Protocol (CDP) and Link Layer Discovery Protocol (LLDP) tables on the switch. And in cases where you need to locate a device that may not run one of these protocols, a MAC Address Table report is also available.
When working with Fibre Channel switches, including both Cisco MDS/Nexus and Brocade switches, UCS Director includes reports for viewing and managing SAN zones, zonesets, and device aliases just as easily as managing VLANs and trunks.
Network Service Devices
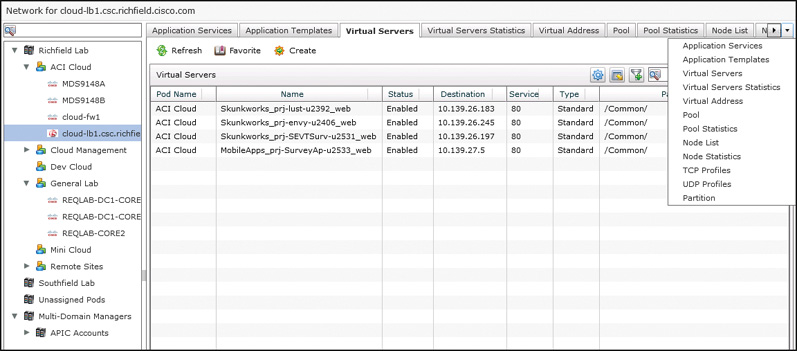
Moving to network service devices, let’s take a look at what UCS Director provides for an F5 BIG-IP device. UCS Director will never fully replace or replicate the features available in an underlying element manager for any supported device, and that is true for both Cisco and third-party devices. With this in mind, UCS Director’s support for the BIG-IP appliances is targeted at enabling basic levels of self-service for private cloud use cases where load-balancing features are desired. Figure 12-13 shows the Virtual Servers report, including a Create button to create new virtual servers. UCS Director also supports the ability to modify or delete a selected virtual server.
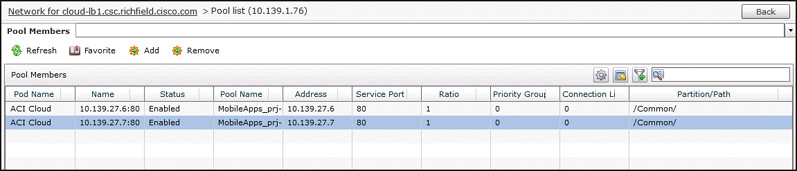
A virtual server requires a pool of real servers that are actually providing the service being load balanced. In Figure 12-14 you can see the Pool Members report available by double-clicking, or by clicking View Details, an individual pool from the Pool report. UCS Director also provides the ability to add and remove entries from a pool, along with displaying the current details.
Cisco Application Centric Infrastructure
Application Centric Infrastructure (ACI) is the Cisco software-defined networking (SDN) platform for the data center and enables network configuration and management to be done through a policy definition, rather than via explicit per-device configuration. A data center network fabric built with ACI may include anywhere from four to hundreds of individual physical switches, but the entire network is managed as a single object through the APIC. This makes ACI an excellent network for building an enterprise cloud, or simply for data center automation.
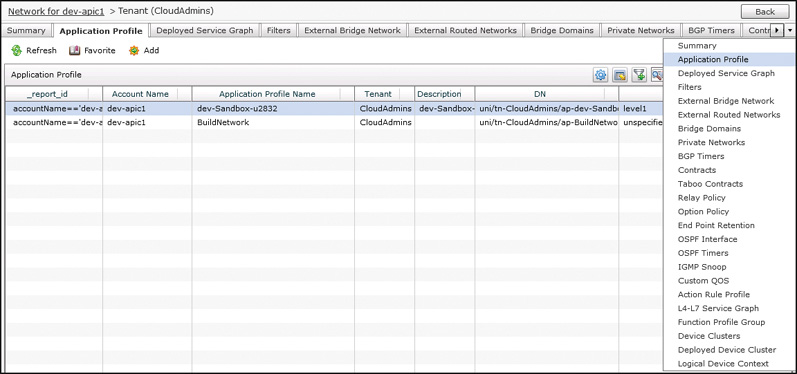
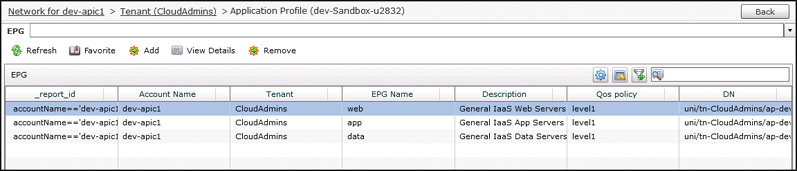
Although ACI’s use of policy and objects to define and describe network configurations is beyond the scope of this book and the CLDADM exam, we will highlight some key cloud infrastructure reports available within UCS Director. Similar to the use of organizations within Cisco UCS Manager, APIC is built to be a multitenant network fabric, and the most important reports and policy elements are found within a Tenant object. Figure 12-15 shows the Tenant details for a tenant called CloudAdmins in this fabric. You can see in the figure the large number of reports available at the Tenant level, with the Application Profile report visible. The Application Profile (also called Application Network Profile, or ANP) is the main object within ACI that describes an individual network construct. If you click View Details on an individual ANP, you will be able to investigate the endpoint groups (EPG) that make up the tiers of the Application Profile, as can be seen in Figure 12-16.
Physical Storage
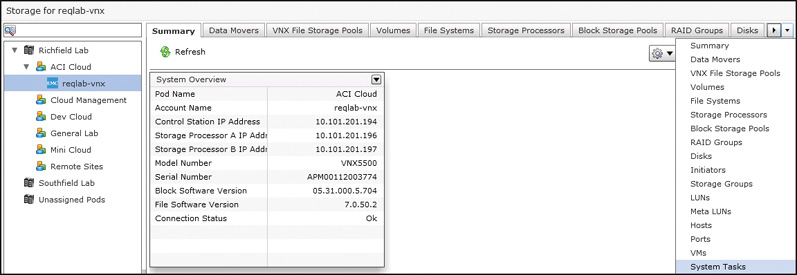
Out of the box, UCS Director supports storage arrays from several vendors, including EMC, NetApp, and IBM. In Figure 12-17 you can see details for an EMC VNX 5500 that is being managed by UCS Director. As with the compute and network components, reports are available for many of the different elements of the storage configuration, including the disks, volumes, and file systems providing the storage resources being consumed by servers and applications.
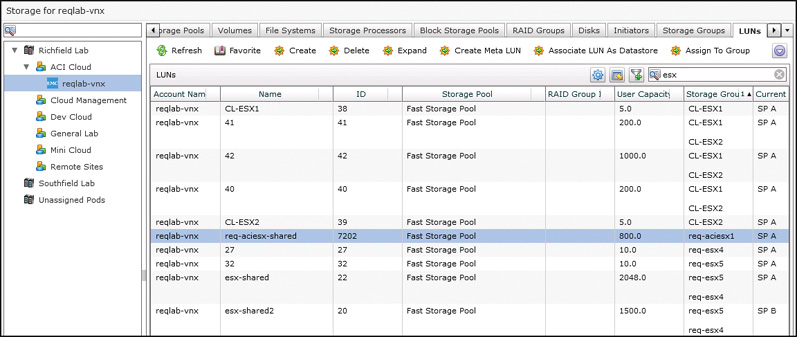
Similarly to how you can add and manage elements such as VLANs and service profiles from within UCS Director, you can use UCS Director to manage LUNs inside of a storage account, as shown in Figure 12-18.
In addition to the storage vendors supported natively by UCS Director, other vendors are using the available Software Development Kit (SDK) for UCS Director to provide installable plug-ins to manage other third-party storage. Hitachi, Pure Storage, and Nimble all have built and made plug-ins available.
Virtual Infrastructure
Cloud infrastructure reports for virtual infrastructure are organized and leveraged just like their physical infrastructure counterparts. Located under the Virtual interface menu are options for Compute, Storage, and Network that lead to the details for the different virtual accounts, or cloud accounts, added to UCS Director. Although the specific reports available depend on the hypervisor platform in use, many, but not all, of the following examples from VMware vCenter–based clouds apply to Microsoft Hyper-V and Red Hat KVM clouds as well.
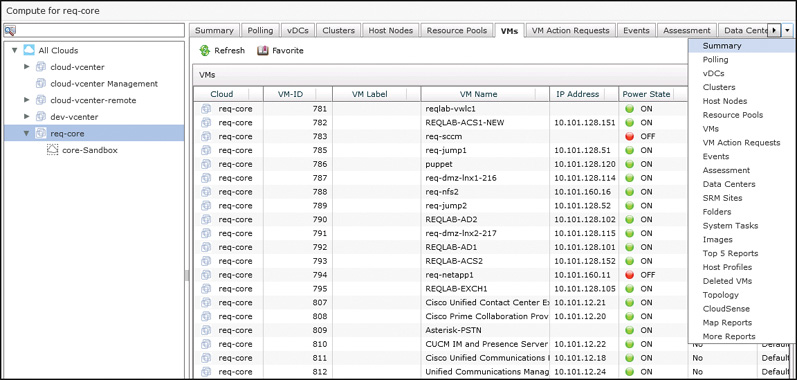
You will most likely find the most valuable and useful reports under Virtual > Compute. Under this menu, details related to the clusters, host nodes, virtual machines, templates, and much more are all available, as shown in Figure 12-19. When looking at the cloud account at the top level, the individual tabs for items such as VMs (displayed in the figure) will include all objects in the cloud. Often you will find that you are interested in a subset of details pertaining to a specific vDC, cluster, or host. Though you could use the Advanced Filter options in the report to find the data you are looking for, you will likely find it easier to drill into a cluster or host and view the VMs report from within that context first.
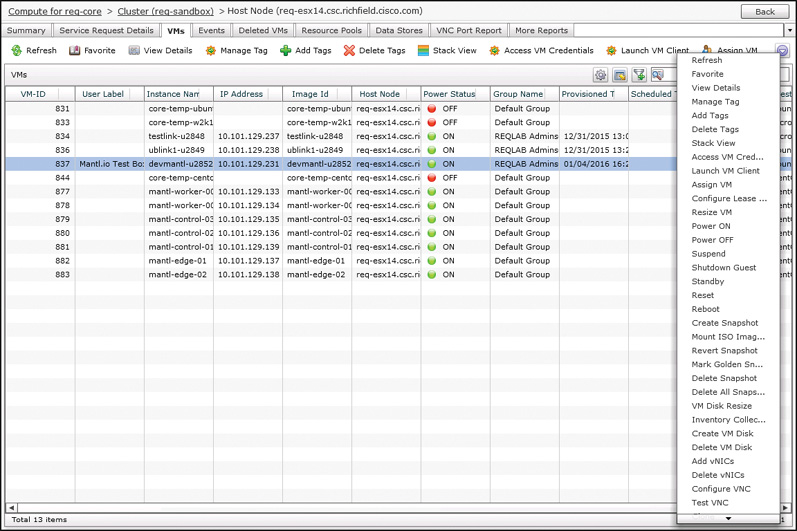
In Figure 12-20, you will find another VMs report, but this time it is based on drilling first into a cluster, and then into a host node of that cluster. You will find it important to be able to quickly narrow down the large scope of physical and virtual objects to what is relevant at a given point in time, and this technique will make it much easier to do so. Also notice in Figure 12-20 how these reports are actionable as well as informative. By selecting VMs from the list, you have access to a large number of lifecycle actions through UCS Director’s administrator and end-user portals.
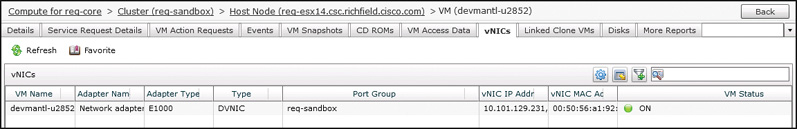
And to show the depth of details available within UCS Director, Figure 12-21 shows the result of double-clicking one of the VMs in the previous report to investigate further. Tabs such as vNICs (shown in the figure), Disks, VM Snapshots, Service Request Details, and more are all available to view more details.
Virtual Infrastructure–Specific Reports
Numerous very useful reports are available for virtual compute, storage, and network that mirror the reports available with physical infrastructure. However, there are also some reports and options available only for the virtual accounts that are worth spending time looking at.
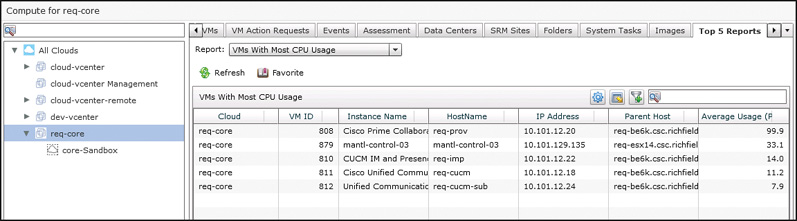
First, there are the Top 5 Reports, available from the tab of the same name when looking at a cloud account in the Virtual > Compute menu. Figure 12-22 shows an example of the Top 5 Report named VMs With Most CPU Usage. There are Top 5 Reports available that look at characteristics at the VM, group, host, and vDC levels that will allow you to find the largest consumers of cloud CPU, memory, and disk resources. The Top 5 Reports for groups and vDCs with the most VMs are also great for finding the biggest overall consumers of the cloud.
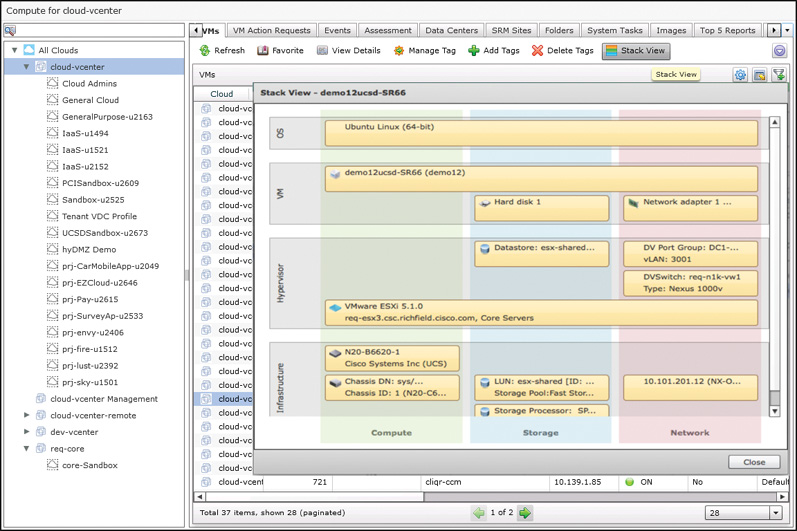
The second type of unique report worth looking at is the Stack View available for individual virtual machines. The Stack View takes advantage of UCS Director’s unique look across the data center infrastructure stack, and combines details from the virtual machine, hypervisor, and physical infrastructure into a single view that indicates all the resources across the data center that are involved in delivery of an individual virtual machine. You can access the Stack View as a toolbar action after you’ve selected a virtual machine, as shown in Figure 12-23. The report will open within the UCS Director window, also seen in Figure 12-23. Starting at the top with the VM’s operating system and then moving down through the layers, Stack View describes the hard disks and network adapters used by the VM, which hypervisor hosts, data stores, port groups, and virtual switches are being leveraged, and then finally the physical compute blade, LUN and Storage Process, and physical switch involved. This unique look at a virtual machine’s resources can be very powerful when identifying potential causes for problems, or scope of impact during a failure.
Another collection of reports that can be very helpful to a UCS Director administrator are the Map Reports. Like Top 5 Reports, Map Reports are available at the Virtual > Compute cloud account level. Map Reports present a color-coded view of the utilization of the physical cloud resources, including hosts, CPU, memory, and storage. Figure 12-24 shows a sample Map Report called CPU Utilization Map, which depicts the CPU utilization across a cloud account. In this single view, each hypervisor host is represented by a box in the image. The relative size of the box indicates the overall CPU capacity for the host in relation to the other hosts. This makes it very easy to see the hosts with the largest and smallest overall CPU horsepower. Within a host, each virtual machine active is represented by a box, where the size relates to the number of vCPUs configured and the color represents how utilized they are. The colors range from green to red, with red indicating a VM with fully utilized vCPU resources. In Figure 12-24, the host represented by the box in the lower-right corner has a VM (Cisco Prime Collaboration) in the middle with a very highly utilized CPU (displayed in red).
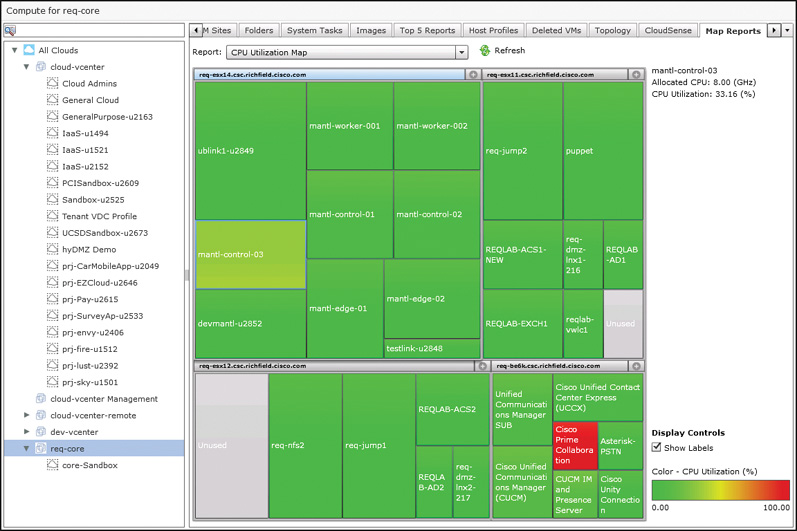
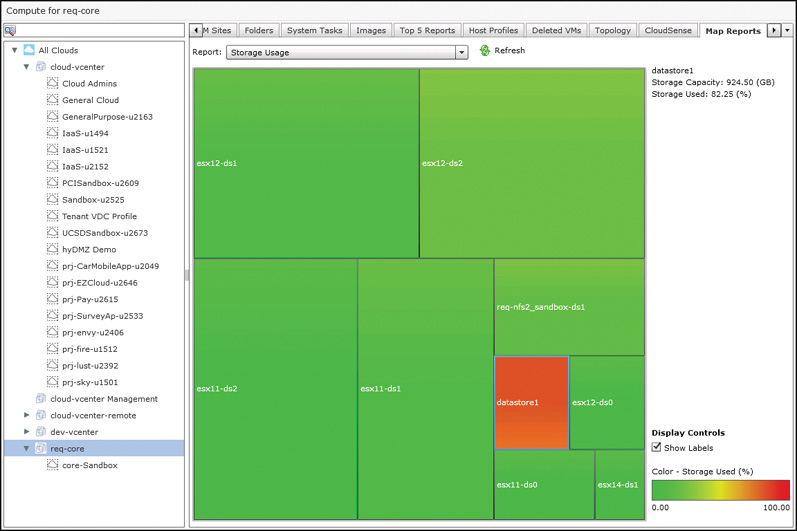
Figure 12-25 shows the Storage Usage Map Report. In this report, each data store is represented as a box one time, no matter how many hosts the data store may reside on. In this image, there is once again a single element (datastore1) that is very highly utilized, and it has been selected in the view so that its details are shown in the upper-right corner.
The five Map Reports available in the Report drop-down list are
![]() CPU Utilization Map
CPU Utilization Map
![]() Memory Utilization Map
Memory Utilization Map
![]() VM Density
VM Density
![]() Inactive VMs
Inactive VMs
![]() Storage Usage
Storage Usage
The last of the unique reports available in the Virtual > Compute interface to cover are found on the More Reports tab with a cloud account selected. You will find a More Reports tab when looking at several other types of virtual and physical infrastructure; however, the variety of reports is unique to virtual compute accounts.
Three types of reports are available in More Reports:
![]() Tabular Reports: Provide details such as licensing, end of support, compatibility, and general status information across the cloud.
Tabular Reports: Provide details such as licensing, end of support, compatibility, and general status information across the cloud.
![]() Instant Reports: Provide graphical representations of the performance of the cloud; these reports are covered in more detail in Chapter 14.
Instant Reports: Provide graphical representations of the performance of the cloud; these reports are covered in more detail in Chapter 14.
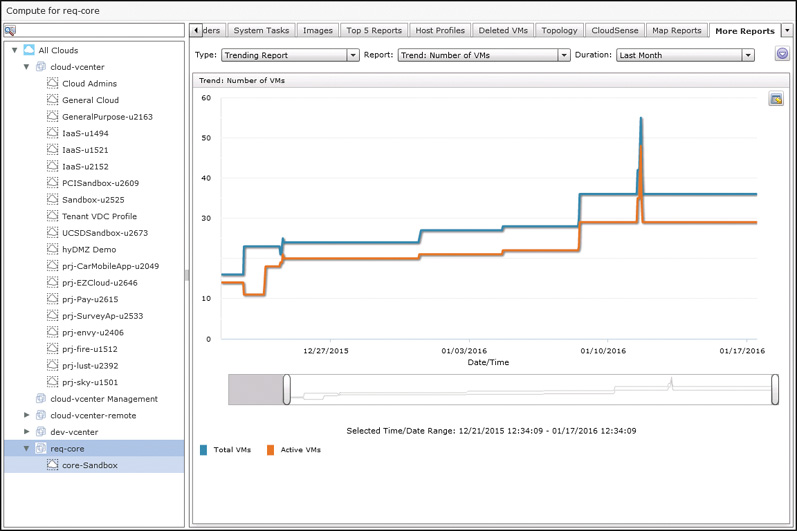
![]() Trending Reports: Provide some visibility into the historical performance and changes to the environment over time. There are Trending Reports that look at VM numbers and changes, CPU and memory utilization, snapshot file sizes, and host nodes. You can view the data over configurable time ranges up to a month back. Figure 12-26 shows an example Trending Report for the Number of VMs over the Last Month. The slider bars below the graph enable you to drill in and adjust the view of the report to narrow the scope to look at spikes and valleys in the trend.
Trending Reports: Provide some visibility into the historical performance and changes to the environment over time. There are Trending Reports that look at VM numbers and changes, CPU and memory utilization, snapshot file sizes, and host nodes. You can view the data over configurable time ranges up to a month back. Figure 12-26 shows an example Trending Report for the Number of VMs over the Last Month. The slider bars below the graph enable you to drill in and adjust the view of the report to narrow the scope to look at spikes and valleys in the trend.
CloudSense Analytics
The cloud infrastructure reports available within UCS Director are very powerful and informative, but they do not provide all the reporting functionality needed for cloud administration. One limitation is that they are always very limited in scope, as they target a single element of the cloud. For example, you can get a report of all virtual machines assigned to a group or a report of all service profiles assigned to a group, but there is no infrastructure report that will show you both in a single report. Second, with the exception of the trending information available for cloud accounts, all the infrastructure reports show the current state of the cloud infrastructure when you pull up the report. Outside of exporting the data from UCS Director, there is no way to capture historical information using infrastructure reports.
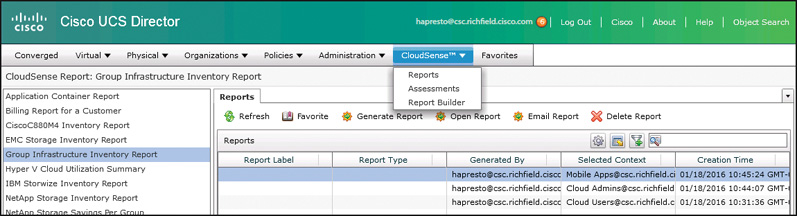
CloudSense Analytics provide another mechanism for reporting within UCS Director that can help fill the gaps in capabilities of basic cloud infrastructure reports. A CloudSense report combines data available from different UCS Director infrastructure reports into a single view, and allows reports to be generated and saved to store a snapshot of the state of the cloud at any point in time. For example, the Group Infrastructure Inventory Report provides the administrator a single report for an individual group identifying all the servers, service profiles, storage volumes, virtual machines, and port groups assigned to that group across all the sites and pods managed by UCS Director.
The primary method to access the CloudSense reports is from the CloudSense > Reports menu, as shown in Figure 12-27. However, you will find a CloudSense tab available when looking at some virtual and physical accounts in other areas of UCS Director. Also under the CloudSense menu are two other options, Assessments and Report Builder. Report Builder is just what its name implies, a method to construct your own CloudSense templates from different reports available within UCS Director. Under Assessments you can generate the Virtual Infrastructure Assessment report that provides feedback on several checks that UCS Director performs on the health of the underlying infrastructure to gauge its capability to support a private cloud with VMware vCenter. These checks include verifying clock synchronization between vCenter, UCS Director, and vSphere hosts, VMware Tools presence in templates, and compliance to hardware compatibility lists for the physical servers in use.
The CloudSense reports available out of the box with UCS Director (as of version 5.3) include
![]() Application Container Report
Application Container Report
![]() Billing Report for a Customer
Billing Report for a Customer
![]() Cisco C880M4 Inventory Report
Cisco C880M4 Inventory Report
![]() EMC Storage Inventory Report
EMC Storage Inventory Report
![]() Group Infrastructure Inventory Report
Group Infrastructure Inventory Report
![]() HyperV Cloud Utilization Summary
HyperV Cloud Utilization Summary
![]() IBM Storwize Inventory Report
IBM Storwize Inventory Report
![]() NetApp Storage Inventory Report
NetApp Storage Inventory Report
![]() NetApp Storage Savings Per Group
NetApp Storage Savings Per Group
![]() NetApp Storage Savings Report
NetApp Storage Savings Report
![]() Network Impact Assessment Report
Network Impact Assessment Report
![]() Organization Usage of Virtual Computing Infrastructure
Organization Usage of Virtual Computing Infrastructure
![]() PNSC Account Summary Report
PNSC Account Summary Report
![]() Physical Infrastructure Inventory Report for a Group
Physical Infrastructure Inventory Report for a Group
![]() Service Request Statistics
Service Request Statistics
![]() Service Request Statistics Per Group
Service Request Statistics Per Group
![]() Storage Dedupe Status Report
Storage Dedupe Status Report
![]() Storage Inventory Report for a Group
Storage Inventory Report for a Group
![]() Thin Provisioned Space Report
Thin Provisioned Space Report
![]() UCS Data Center Inventory Report
UCS Data Center Inventory Report
![]() VM Activity Report By Group
VM Activity Report By Group
![]() VM Performance Summary
VM Performance Summary
![]() VMware Cloud Utilization Summary
VMware Cloud Utilization Summary
![]() VMware Host Performance Summary
VMware Host Performance Summary
![]() Virtual Infrastructure and Assets Report
Virtual Infrastructure and Assets Report
Once a report is generated, it is saved within UCS Director and available to be accessed at any point in the future until it is deleted. Reports can be viewed or emailed in either HTML or PDF format. CloudSense reports can be generated manually by the administrator or automatically based on a schedule.
Now that you have an understanding of what CloudSense reports are, let’s take a look at some sample reports available.
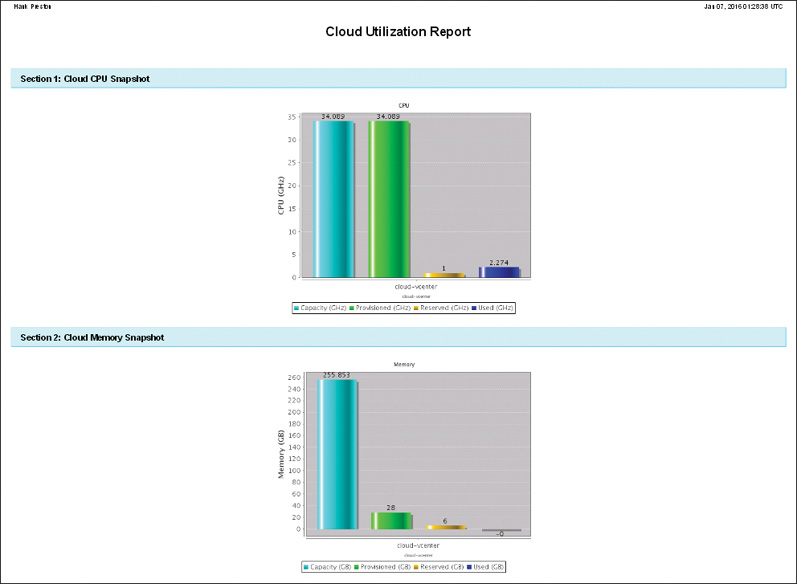
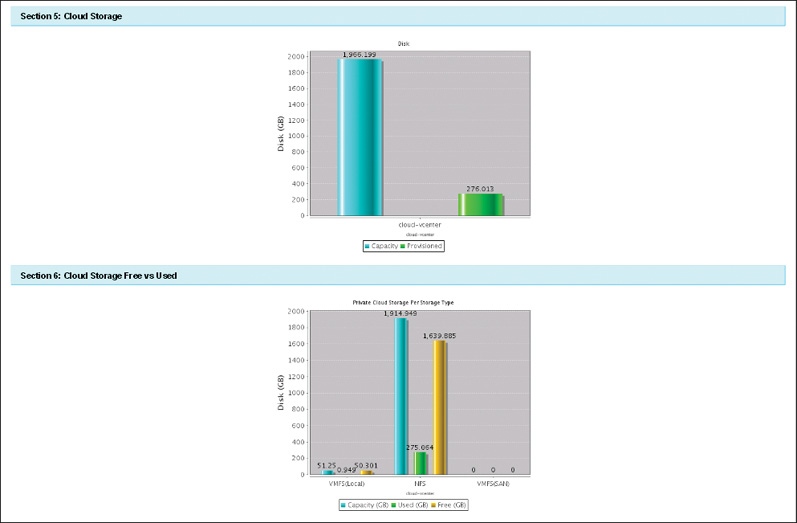
As your cloud grows and is used, you will need to monitor its utilization and track its consumption and available resources such as CPU, memory, and storage space. The VMware Cloud Utilization report is very useful for tracking this information on a per cloud account basis. Select the report in the menu and generate it for one of your cloud accounts. Figures 12-28 and 12-29 show some of the data that is provided by this report. In this report, overall capacity, provisioned capacity, reserved capacity, and used capacity are all indicated in easy-to-read graphs.
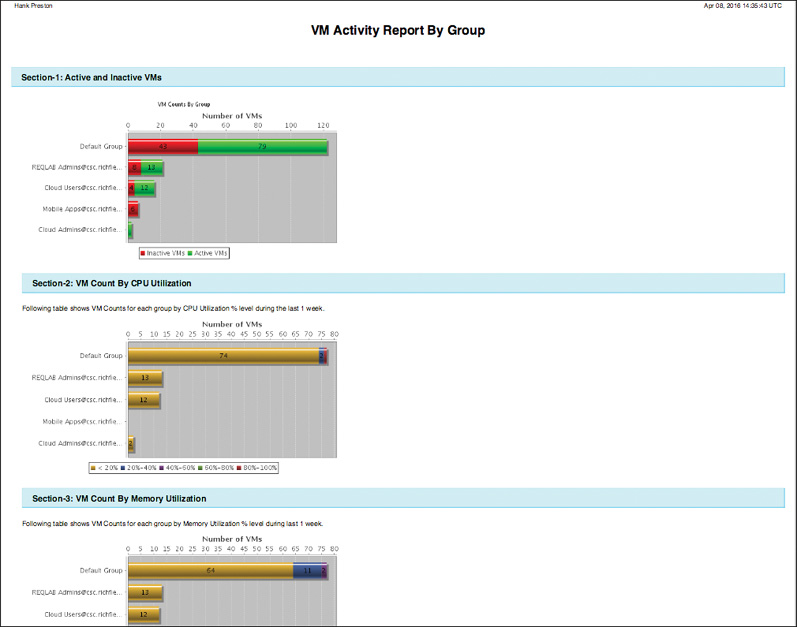
A second useful report is VM Activity Report By Group, which can highlight the groups that have deployed the most VMs to your cloud, including details on active/inactive VMs, CPU utilization, and memory utilization. Figure 12-30 is an example of this report showing the distribution of the consumption among several groups in our cloud. The entries for Default Group indicate virtual machines discovered by UCS Director but currently not assigned to any particular group.
The last CloudSense report that we will look at is Billing Report for a Customer, which is best discussed as part of the “UCS Director Chargeback” section coming up next.
UCS Director Chargeback
A major goal of most enterprise IT executives as part of a cloud initiative is to implement some form of chargeback to the business. The traditional method for budgeting and paying for hardware, software, maintenance, and manpower to design, build, and maintain data centers and IT systems has focused on IT as a cost center or as a simple cost of business. When an enterprise’s governance is modeled in this way, a project to implement or upgrade a major system may include some incremental budget for the IT needs at inception; however, ongoing maintenance and support of the infrastructure are often the responsibility of enterprise IT going forward. This results in a constant pressure on IT staff to learn how to do more and more with less budget and resources, and this is not seen as a viable long-term strategy in most organizations.
Many organizations are using private cloud projects as a catalyst for changing this traditional model, enabling them to begin to replicate the operating expense model of IT that is the standard for public cloud providers. In this model, application owners, lines of business, or developers pay for their consumption of IT resources based on some agreed-upon metric and rate scale. This has benefits for both the consumers of the private cloud and the enterprise IT staff who is building and managing it.
For the consumers of cloud services, their initial investment is much lower than in a traditional project. Many projects today have unclear potential for success or impact on the business, and the typical model of large initial investment before a project proves its worth has pushed these projects to services such as public cloud. With a private cloud modeled for operating expenses like a public cloud, the line of business can align its spend with the value the project is offering through its lifetime.
With a private cloud, enterprise IT no longer is burdened with the cost of never-ending support and maintenance of applications and services that are deployed to their data centers. There is a monetary incentive for lines of business to diligently age out and move to end-of-life status systems that are no longer providing value, rather than maintain them indefinitely. Enterprise IT can also begin to move away from being seen as a cost center pulling money from an enterprise’s bottom line. Most organizations won’t want to see enterprise IT become a profit center, unless their business involves delivery of IT services to consumers. However, building a balanced IT budget where their expenses are offset by the paid consumption of services from the lines of business is a very reasonable and achievable goal.
To effectively implement chargeback or showback, an organization must tackle two challenges. First, there is a need for a technology platform that can monitor and track consumption of IT resources at a granular level that aligns with consumption, and then output this data as consumable reports. The metrics tracked will vary by organization, but common ones include the number of virtual machines and physical servers in use, CPU and memory consumption from the compute resources, data storage consumed, and network traffic generated. The granularity of billing will also be a major factor to determine. Hourly, daily, weekly, and monthly intervals for basing charges are all possible options for private clouds, while many public clouds track based on hourly usage.
Second, and significantly more difficult for most organizations, is determining what to actually charge for the consumption of resources in the cloud. The operation of a private cloud requires significant resources for design, engineering, and operations that are difficult, if not impossible, to directly bill to end users; however, they must be accounted for. Also, there are power, cooling, and facility charges that need to be addressed as part of the rate schedule. This means that even for organizations that have a good idea of what the compute, network, and storage costs are for a data center, work must be done to attach the less concrete costs into the rate schedule for the elements that can be easily tracked and metriced. Lastly, just because you could track and charge based on kilobyte of data transferred, megabyte of storage consumed, and gigahertz of process power utilized, that doesn’t mean that there is a benefit to the organization to track at that level.
Although very important in developing a chargeback strategy for an enterprise, discussing how an organization might answer the second of these challenges is outside the scope of the CLDADM exam and this book. You will learn in the following sections about the capabilities in Cisco UCS Director to build models and rate schedules for implementing a chargeback policy, how to ensure the policy is enforced by the platform, and options for generating bills and reports per group or tenant consuming resources.
Cost Models
Once your organization has determined which metrics to track, over what duration to bill, and how much to charge, the next step is to implement and enforce that Cost Model in your cloud. Cisco UCS Director offers you a very flexible method for building differentiated Cost Models based on a number of factors.
In Chapter 9, “Automating Cloud Infrastructure with UCS Director,” you learned about the virtual data center (vDC) and its related policies in UCS Director that govern details for how end users can order resources, as well as how they are deployed to the physical and virtual infrastructure. One of the optional configurable parameters of the vDC that Chapter 9 discussed is the Cost Model policy. Like other policies in UCS Director, a Cost Model is a reusable policy element that you configure and then apply to the vDCs to which it should apply. This means that in your deployment, you could have different Cost Models for different groups, or even for different vDCs for a single group. This is actually very typical and expected in a cloud deployment, as performance characteristics, service-level agreements (SLA), or response times could differ across groups and vDCs, justifying higher or lower costs.
Navigate to Policies > Virtual/Hypervisor Policies > Service Delivery to find the Cost Models tab. An initial installation of UCS Director will have a Default Cost Model with each possible metric set to zero dollars. Click the Add button to create a new Cost Model, as seen in Figure 12-31. The first decision and configuration you will need to make after providing a name and optional description for the policy is the Charge Duration, or how often UCS Director will take an average of consumption and record the charge to the database. Options include Hourly, Daily, Weekly, Monthly, and Yearly. This will have a significant impact on the chargeback policies for your organization. On one hand, the longer the charge duration, the less often and less data UCS Director will need to track while monitoring usage. Fewer bills would need to be generated, and IT might have an easier time determining costs per metrics. However, there is a downside to using a longer charge duration. End users could end up paying exaggerated bills for resources that were used for a very short time. Consider a developer who regularly creates and deletes virtual machines several times a day, each lasting only a few hours. With a charge duration of daily, each virtual machine would result in a full day’s charge, despite being in use for only a fraction of the day. This would be exaggerated for weekly or monthly durations. On the other hand, for a private cloud deployment, it might not make sense to track and bill based on hourly usage in the same way a public cloud provider might.
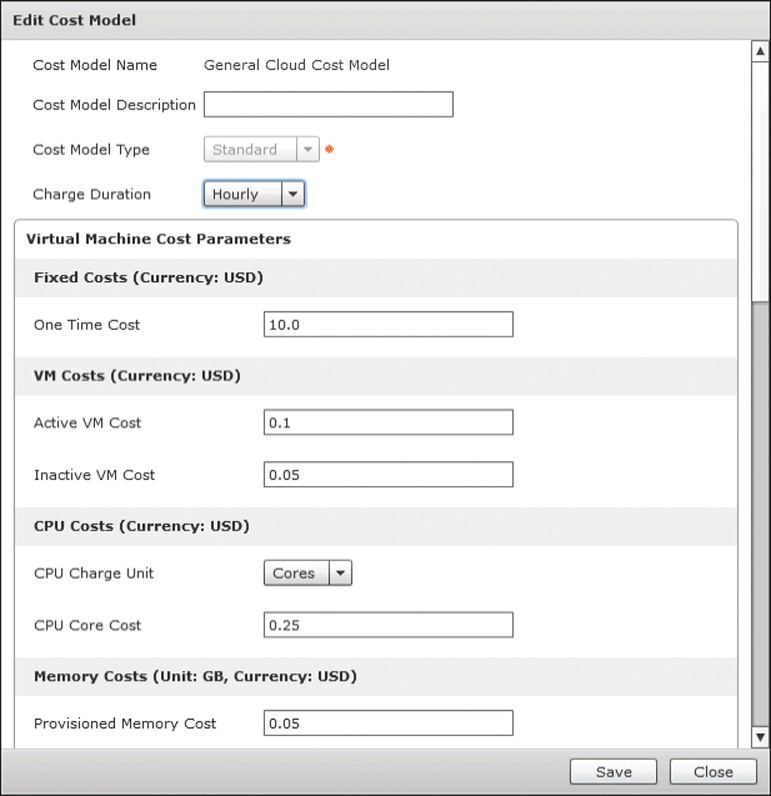
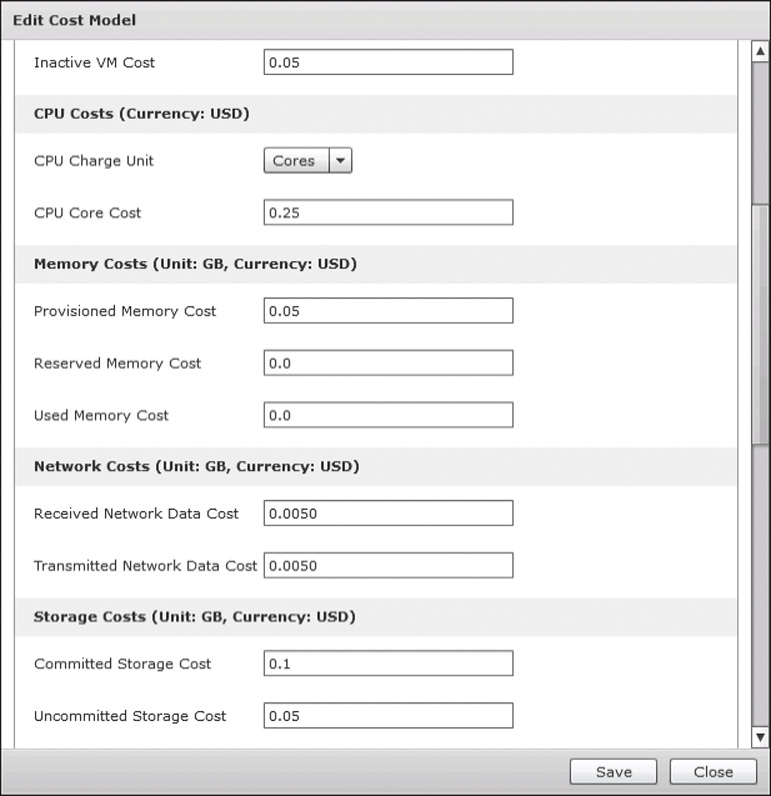
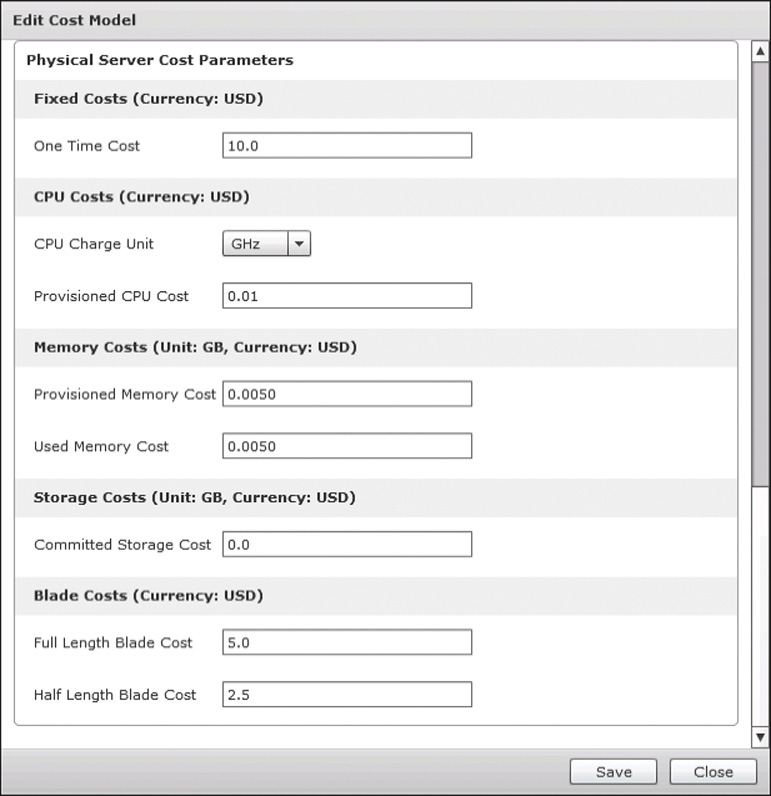
With the Charge Duration configured, you will then begin setting the actual dollar (or whatever local currency is in use) costs for the identified metrics. A UCS Director Cost Model is used to charge for both virtual and physical servers, and it provides both coarse and granular options for calculating costs. On the coarse end of the spectrum, you can assign a one-time, initial cost for ordering a new server, as well as options for tracking active or inactive (that is, powered on or off) virtual machines with different rates. More granular options are available for tracking CPU, memory, and storage consumption by virtual and physical servers. Virtual servers have an additional metric of network bandwidth consumption, while physical servers can assign costs based on full- or half-width blades. Figures 12-32 and 12-33 (along with Figure 12-31) show the full Cost Model interface.
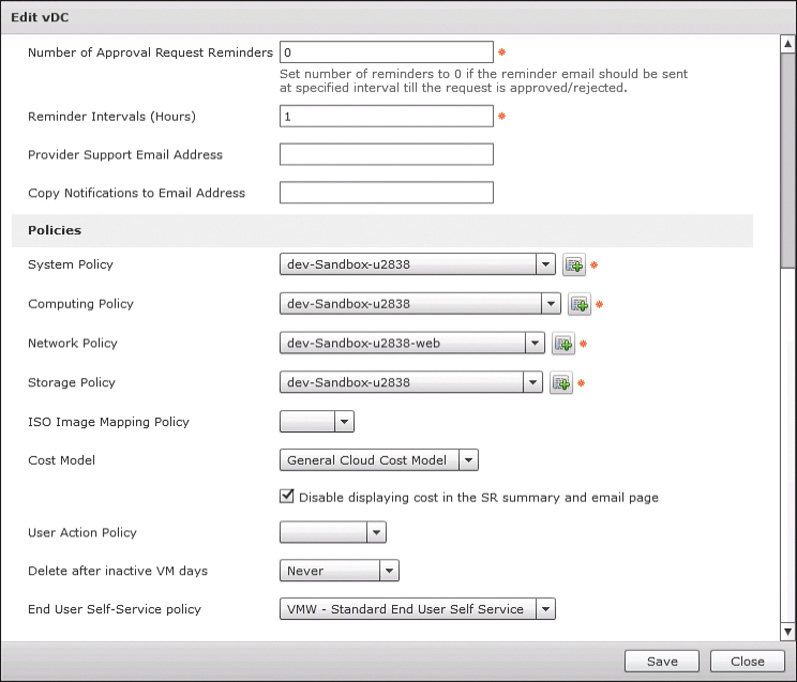
Once the Cost Model (or Cost Models) has been created, it won’t have any effect until it is applied to vDCs. As when applying other policies, navigate to Policies > Virtual/Hypervisor Policies > Virtual Data Centers and either edit an existing vDC or create a new one. Then, as shown in Figure 12-34, choose the appropriate Cost Model for the vDC. You can also indicate by checking the box whether you wish for cost estimates to be included in Service Request Summary tabs and email templates.
The decision to implement Cost Models is not an all or nothing one. In a given deployment, you could have some vDCs with no Cost Model, others with a very basic and coarse Cost Model, and others with complex and granular Cost Models all for a single group. This capability enables organizations to implement very flexible options as they begin to roll out chargeback solutions.
Chargeback Reports
Configuring and applying a Cost Model is just the beginning of the chargeback deployment. You must also have a way to investigate the metrics that are being tracked, and generate bills for customers, whether they are actually being paid or just used for informational purposes. The majority of the information you will want to see as an administrator is found under the Organizations > Chargeback menu. From this interface you can investigate chargeback details at the entire deployment level (All User Groups), at the group level, or at an individual vDC level. At each level you’ll find Current and Previous Month Summaries as well as several reports containing different levels of detail, ranging from month-by-month totals, down to individual metrics per virtual machine.
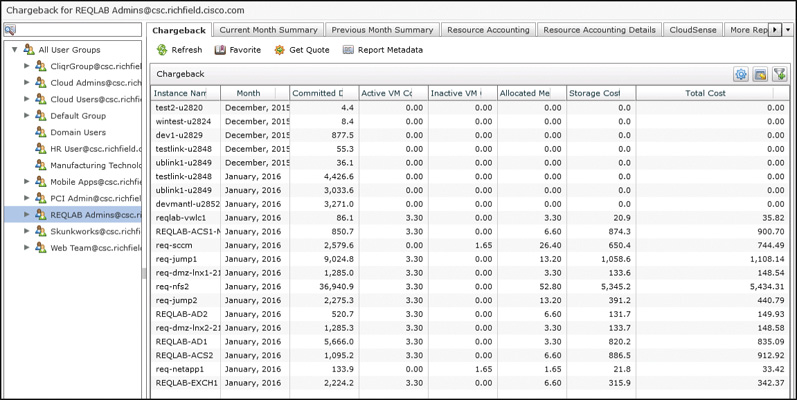
Figure 12-35 shows the Chargeback tab from an individual group. The number of columns displayed has been reduced to highlight several of the cost columns; however, by default the report includes the individual metrics used to generate the costs as well. In this report, notice how it provides details per virtual machine, per monthly billing cycle, the associated costs per metric (such as Active and Inactive status), and the total cost. This type of report can be very helpful for a group to identify which of their resources are resulting in the highest bills, and why.
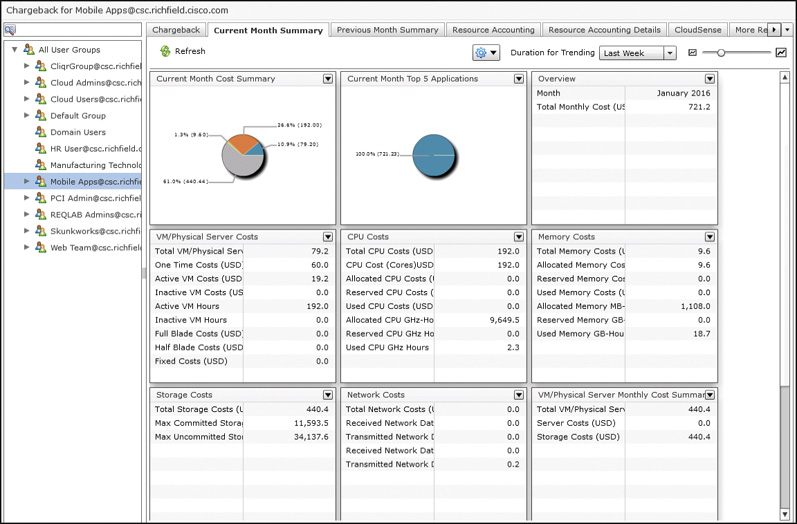
The Chargeback reports also include some very helpful Summary dashboards to get a glimpse at the current and previous months’ data. In Figure 12-36 an example Current Month Summary page is shown, providing a very quick one-page view to understand the overall status for the group’s current month utilization. A similar dashboard is available showing the Previous Month Summary.
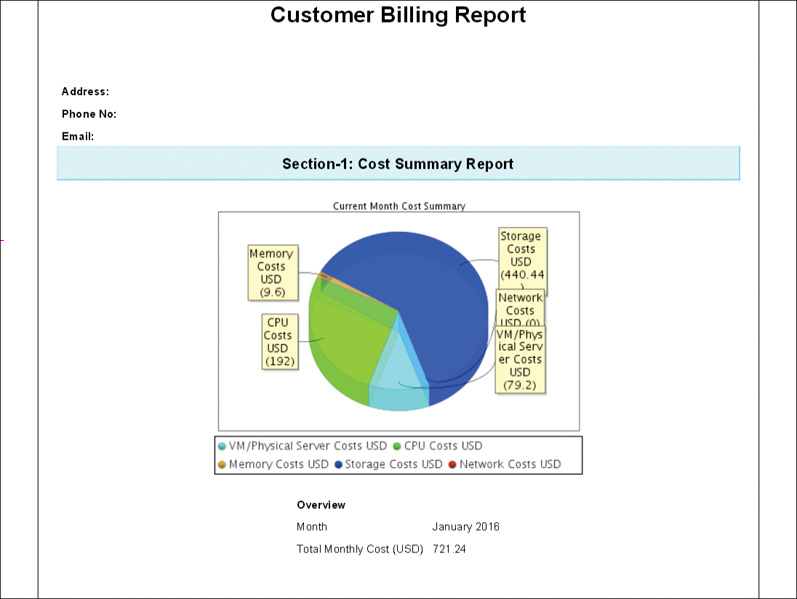
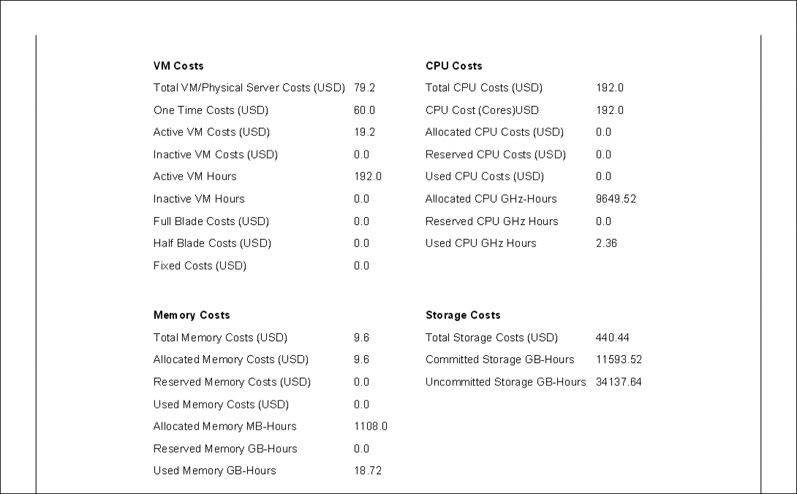
The last report to look at here is the CloudSense report mentioned in a previous section. The Customer Billing Report is intended to be generated monthly per group or tenant in the cloud and provides a breakdown of the charges accrued through the month by the group. Figure 12-37 shows a pie chart view of the costs across categories, and in Figure 12-38 the tables of raw data are visible for deeper analysis by the customers.
Budget Policy
Having configured and deployed Cost Models and viewed the consumption reports, the next challenge you will likely be assigned is to provide some mechanism to limit active cloud consumption by a group based on some predefined budget. UCS Director provides a mechanism for individual groups to be assigned a monthly budget to be tracked in real time when new virtual resources are being ordered.
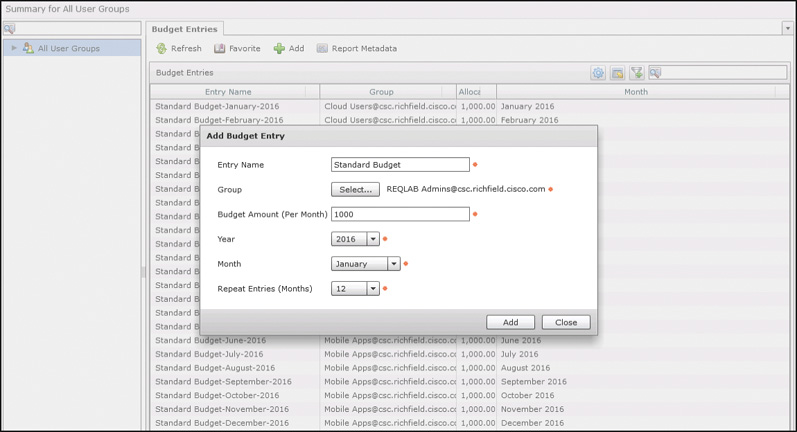
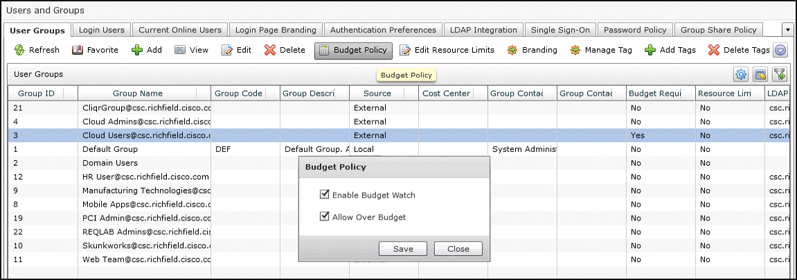
Before enabling the Budget Watch feature for a group, it is important to first establish the group’s monthly budget; otherwise, the group might find itself unable to order new re-sources due to lack of budget. Navigate to Organizations > Summary to view and enter new budget entries. A single budget entry is composed of three main values: the group the entry applies to, the month and year for the budget line, and the dollar (or local currency) amount allocated for the group and month. Click the Add button make a new entry and display the form shown in Figure 12-39. Provide an entry name (which will be suffixed with the month and year), the group and dollar amount, and the time frame for the new entry. UCS Director allows you to easily configure repeated budget entries by allowing you to indicate a repeat count. Click Add, and the indicated group now has a budget to be tracked against for the months indicated.
With the budget entries for your group or groups (once again, UCS Director allows budgets to be configured and enforced per group and not globally), you need to enable the Budget Watch feature on the group itself. This is done from the User Groups configuration tab located under Administration > Users and Groups. Select the group that will now be under Budget Watch and click the Budget Policy button to open the interface shown in Figure 12-40. Then check the Enable Budget Watch check box and indicate whether the group should be allowed to go over budget. If the Allow Over Budget feature isn’t enabled, a group will be prevented from ordering new resources once UCS Director’s chargeback calculations indicate the group is out of resources for the month.
Exporting Metering Data for External Integration
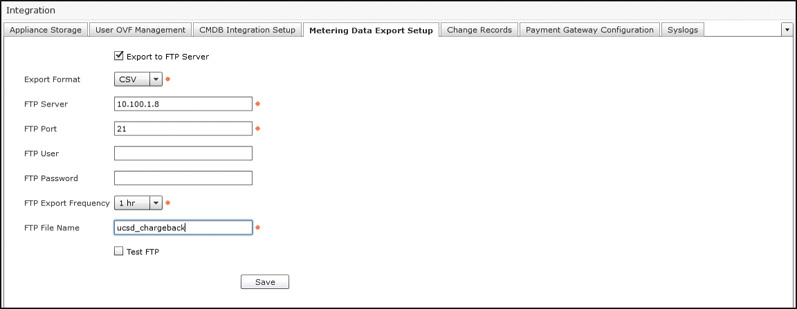
Although the chargeback and reporting capabilities in UCS Director are very flexible and powerful, UCS Director is not an accounting and finance system. Most enterprises truly looking to implement a chargeback strategy will want to have an integration to their corporate accounts payable system where actual bills and records of payment can be addressed as part of typical day-to-day IT management. Rather than build direct integrations into any number of potential finance systems customers may use, UCS Director provides a mechanism to export the metering and tracking data that can be ingested by the accounting system. Navigate to Administration > Integration and then to the Metering Data Export Setup tab and you will find a screen similar to the one shown in Figure 12-41. Here you can indicate whether to export to a CSV or Extensible Markup Language (XML) data format, an FTP server destination, and the rate at which to export data. With this setup, your accounting team can monitor this destination and import the data to be fed through the proper rules and policies before generating bills, or simply initiating internal budget transfers from the groups consuming cloud services to enterprise IT.
Exam Preparation Tasks
As mentioned in the section “How to Use This Book” in the Introduction, you have a couple of choices for exam preparation: the exercises here, Chapter 15, “Final Preparation,” and the exam simulation questions on the Pearson IT Certification Practice Test.
Review All Key Topics
Review the most important topics in this chapter, noted with the Key Topics icon in the outer margin of the page. Table 12-2 lists a reference of these key topics and the page number on which each is found.
Table 12-2 Key Topics for Chapter 12
Define Key Terms
Define the following key terms from this chapter and check your answers in the glossary: