
Chapter 14. Monitoring and Maintaining the Health of Your Cloud
This chapter covers the following exam topics:
4.0 Cloud Systems Management and Monitoring
4.5 Perform cloud monitoring using Cisco Prime Service Catalog, Cisco UCS Director, Cisco Prime Infrastructure
4.5.a Describe fault monitoring
4.5.b Describe performance monitoring
4.5.c Describe monitoring of provisioning outcomes
4.6 Create monitoring dashboards
4.6.a Configure custom dashboards
5.0 Cloud Remediation
5.2 Interpret Logs for root cause analysis
5.2.a Analyze fault logs
5.2.b Analyze admin logs
5.2.c Analyze application logs
5.3 Configure backups
5.3.a Configure database backup
5.3.b Configure database restore
Once you and your users become accustomed to the advantages of self-service ordering, management, and data center automation, maintaining a healthy environment will become a critical part of day-to-day administration. Tracking current usage statistics across the infrastructure supporting the cloud, monitoring faults and events, reviewing system logs, and managing backups will become routine activities. In this chapter we will explore the most common and important mechanisms for monitoring and maintaining the health of your cloud.
“Do I Know This Already?” Quiz
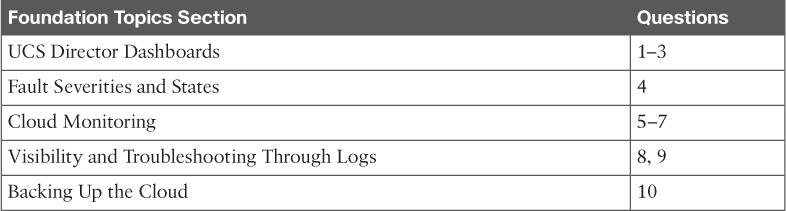
The “Do I Know This Already?” quiz allows you to assess whether you should read this entire chapter thoroughly or jump to the “Exam Preparation Tasks” section. If you are in doubt about your answers to these questions or your own assessment of your knowledge of the topics, read the entire chapter. Table 14-1 lists the major headings in this chapter and their corresponding “Do I Know This Already?” quiz questions. You can find the answers in Appendix A, “Answers to the ‘Do I Know This Already?’ Quizzes.”
Caution
The goal of self-assessment is to gauge your mastery of the topics in this chapter. If you do not know the answer to a question or are only partially sure of the answer, you should mark that question as wrong for purposes of the self-assessment. Giving yourself credit for an answer you correctly guess skews your self-assessment results and might provide you with a false sense of security.
1. What actions are available from an individual widget’s action menu in UCS Director?
a. Export Report
b. Expand View
c. Close View
d. Clone View
e. Add to Dashboard
2. Where would you find a view showing summary statistics comparing the consumption of resources across all virtual accounts in UCS Director?
a. CloudSense > Reports > Cloud Summary
b. Administration > Virtual Accounts > Dashboard
c. Virtual > Compute > All Clouds > Summary Tab
d. This information is not available within UCS Director
3. True or False. Dashboard views are only available in UCS Director on the administrator portal.
a. True
b. False
4. Which fault severity indicates a service-affecting condition that is causing severe degradation of services?
a. Critical
b. Major
c. Minor
d. Warning
5. Within UCS Director, where is the best place to look for the reason behind a service profile association failure?
a. Organizations > Service Requests > Service Request Details > Log
b. Organizations > Faults > UCS Manager Account > Service Profile
c. Physical > Compute > UCS Manager Account > Faults
d. Physical > Compute > UCS Manager Account > Service Profiles > Faults
6. Within UCS Director, where would be a good place to identify the most utilized vSphere hosts in your cloud?
a. System Dashboard
b. Virtual Account Hosts Report
c. CloudSense VMware Host Performance Summary
d. Virtual Account Top 5 Reports
7. Your manager wants to know the percentage of virtual machine deployments that have completed successfully since UCS Director has been in use. How could you quickly provide this information?
a. Review the Archived Service Requests report in UCS Director, filter for Virtual Machine Deployments, and calculate the success percentage.
b. Interview the users of the system and gather anecdotal data to give a report on general impression to your manager.
c. Export the data from the Service Requests Statistics report to Excel and use it to calculate the success ratio and build graphs to represent the overall data across all types of deployments.
d. There is no way to provide this answer to your manager.
8. Which UCS Director log would be useful in determining the cause of errors related to gathering the inventory of a storage array?
a. Authenticator Log
b. Patch Log
c. Infra Manager
d. Tomcat Log
9. Where could you go to gain access to the Orchestration Log for Prime Service Catalog? (Choose two.)
a. Log in to web as administrator and choose Service Designer > Logs
b. Log in to web as administrator and choose Administrator > Utilities > Logs and Properties > psc-c.orchestration.log
c. Log in to the Shell Menu and choose View Logs > View Orchestration Log
d. Contact Cisco TAC and open a case
10. True or False. Database backups for both UCS Director and Prime Service Catalog must be taken from the command-line interfaces, because there is no way to generate a database backup from their administration portals.
a. True
b. False
Foundation Topics
UCS Director Dashboards
Whether in an automobile or software system, a dashboard provides the user with immediate access to the most important pieces of information about the status of the underlying system. UCS Director leverages dashboards and summary views in many places to provide you, the cloud administrator, with the information needed to understand which areas may require further investigation. The dashboards, and widgets viewed on the dashboards, are in addition to the reports that were covered in Chapter 12, “Chargeback, Billing, and Reporting.”
Dashboard Widgets
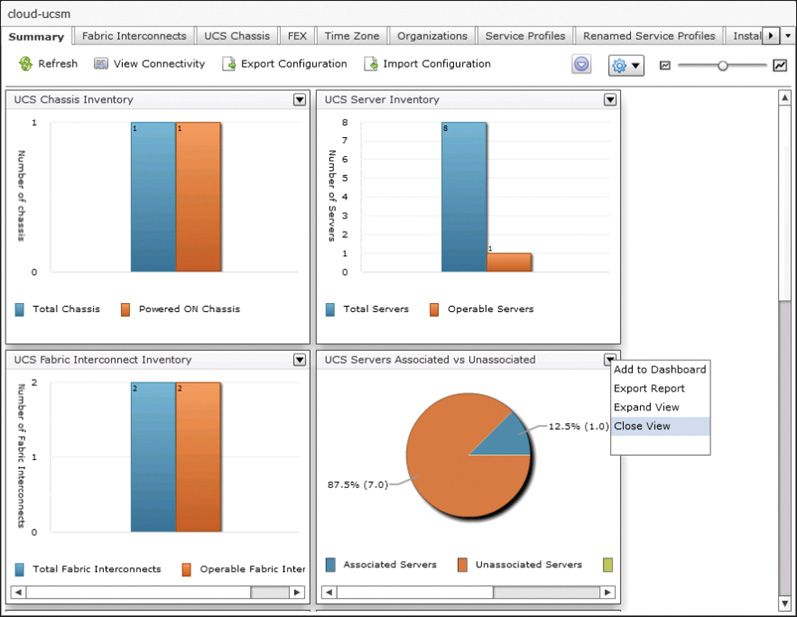
UCS Director dashboards are made up of one or more available widgets that bring together key data points for some element of the cloud. UCS Director has hundreds of available widgets that display details related to physical or virtual infrastructure, virtual data centers, groups, and more. Figure 14-1 shows four widgets that provide details related to a UCS Manager account from UCS Director. Each widget is designed to provide the administrator with the most important details in the easiest-to-consume fashion. In this case, details related to the equipment from the compute domain are presented in bar and pie charts. When viewing a dashboard with many widgets on the screen all at once, you may want to investigate a single widget closer. The Expand View action shown in the figure will take a single widget and zoom it out to full screen size temporarily. You can also use the Export Report option to pull the raw data that is feeding the widget into another system for more processing. Exports can be taken in PDF, CSV, or XLS format.
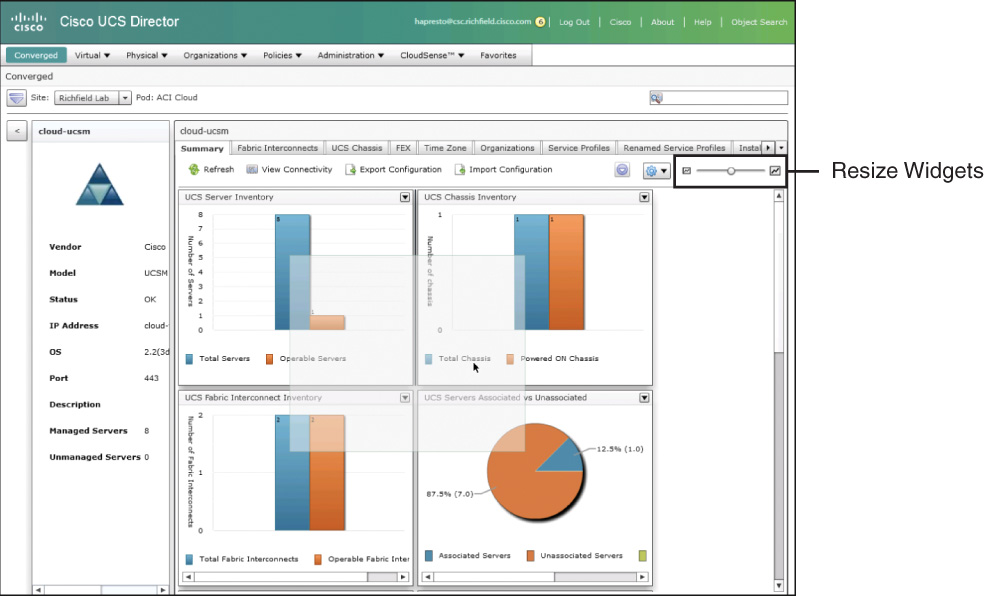
When viewing a dashboard and reviewing the data within the widgets, you have control over the order and size of the widget display on the screen. While viewing a dashboard, you can click and drag widgets around the screen as shown in Figure 14-2, allowing you to customize the layout of the dashboard. And to adjust the default size of the widgets, use the slider highlighted in the same figure in the upper-right corner of the dashboard. By making the widgets smaller, you will fit more widgets on the screen at once, providing more information in a single glance; however, as widgets get smaller, you may find the data difficult to comprehend.
Infrastructure Summary Dashboards
Widgets are mostly found throughout UCS Director on the Summary tab when viewing an element of infrastructure. Nearly all physical and virtual infrastructure types that can be added to UCS Director will have a Summary tab with at least one widget listed. Also, as you drill into the details of a component, you may find additional Summary tabs available at lower levels.
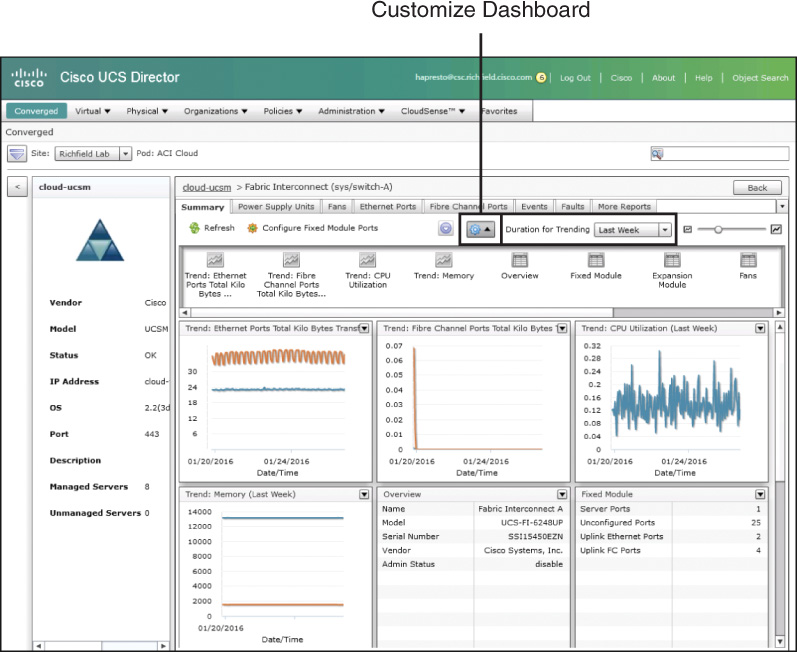
For example, Figure 14-1 displayed the Summary tab from a UCS Manager account, while in Figure 14-3, the details of an individual Fabric Interconnect from the same domain are being investigated and the Summary tab is displayed. The widgets available at the account level provide details across the domain, and the widgets available within an individual Fabric Interconnect are focused on just its characteristics. In Figure 14-3 we can see graphs related to data transmitted and received through the device, as well as CPU and memory utilization trends. For dashboards like this one where widgets provide trending details over time, the user is provided a drop-down list box to indicate the time range over which he would like to see the data. Finally, note in the figure that the Customize button has been clicked to display the drawer of available widgets. From this drawer you can drag currently closed widgets back onto the dashboard.
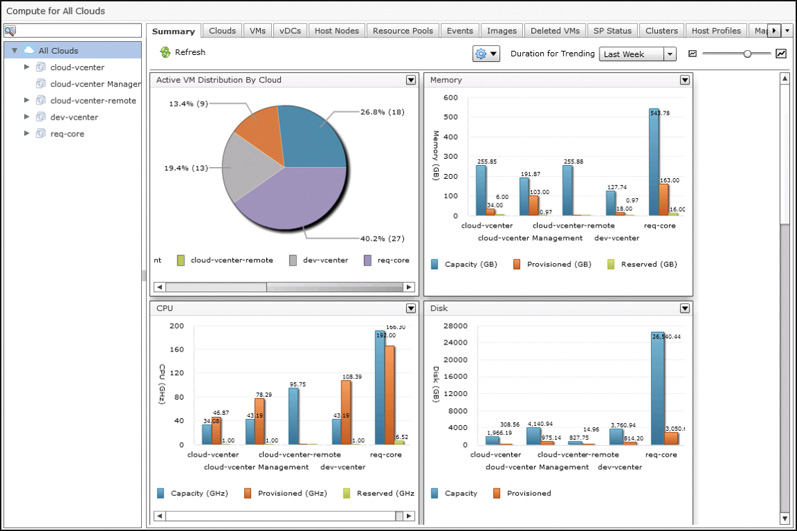
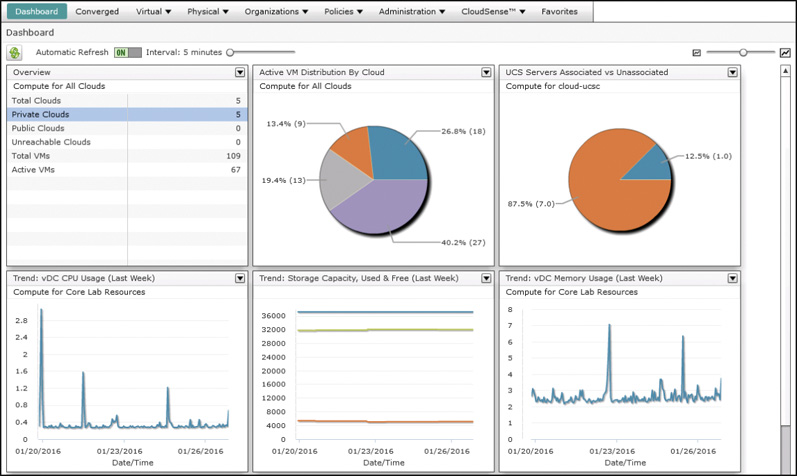
Dashboards are often used to get details at a very macro level before drilling down into details. For example, look at the Summary dashboard in Figure 14-4 displaying details across all clouds configured in this UCS Director deployment. As the administrator of this system, you should quickly be able to identify that there is one cloud account with a consumption level more than twice that of the others. Though this fact may or may not indicate an actual problem, the value of the dashboard is in the ability to quickly deduce trends and characteristics across the environment.
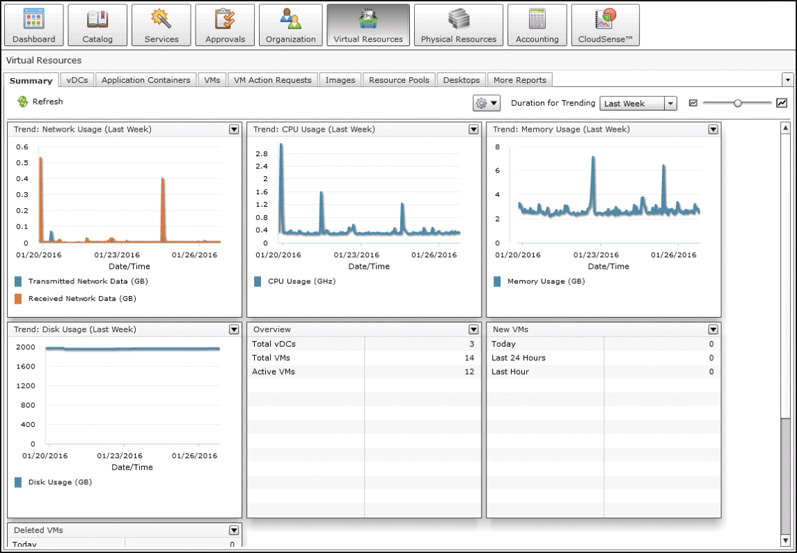
Summary dashboards are available not only in the administrator portal for UCS Director, but also in the end-user portal, which provides Summary tabs in several areas for individual users to understand the health of their group’s provisioned resources. Figure 14-5, for example, shows the Virtual Resources Summary tab of the end-user portal. In this dashboard, end users can view the amount of resources being consumed in the cloud. Particularly once your organization begins implementing chargeback or showback, users will find it very important to be able to get a quick glimpse of their cloud consumption.
System Dashboard
Each of the infrastructure Summary view dashboards available within UCS Director is loaded with widgets focused on the particular context being viewed at one time. These can be very helpful as you are investigating one part of the cloud or another, but what about when you want to get an overall view of the key details across the deployment? UCS Director offers a top-level, system-wide dashboard that can be enabled and populated with widgets from any individual dashboard.
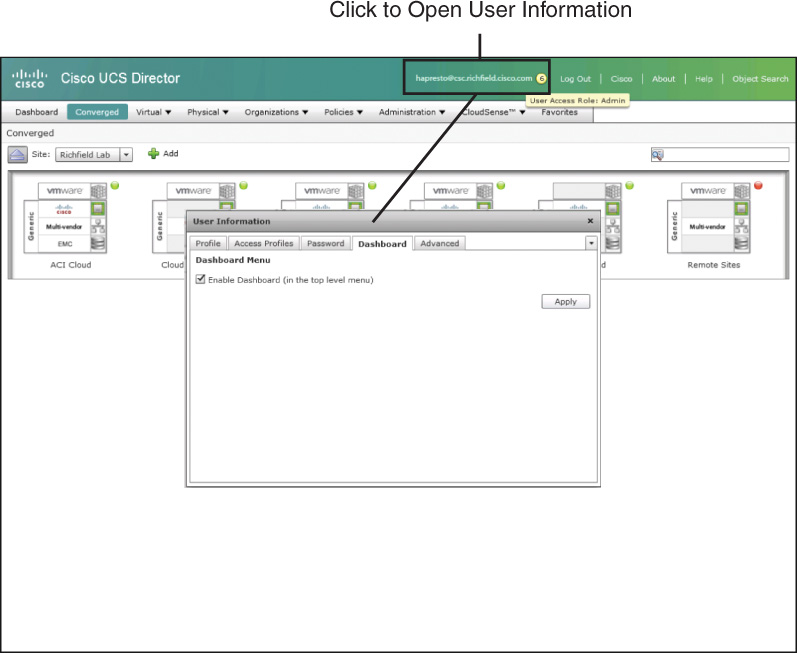
The System Dashboard is available within both the administrator portal and end-user portal and is enabled and customized per user login. To enable the Dashboard, access the user information dialog box by clicking your username in the web page header, highlighted in Figure 14-6, and clicking the Dashboard tab in the dialog shown. Simply check the Enable Dashboard check box and click Apply. This will add the Dashboard link at the very beginning of the main navigation bar within the portal. If you immediately navigate to the Dashboard, you will likely find it completely empty, as each user needs to identify which widgets they’d like to see on their Dashboard.
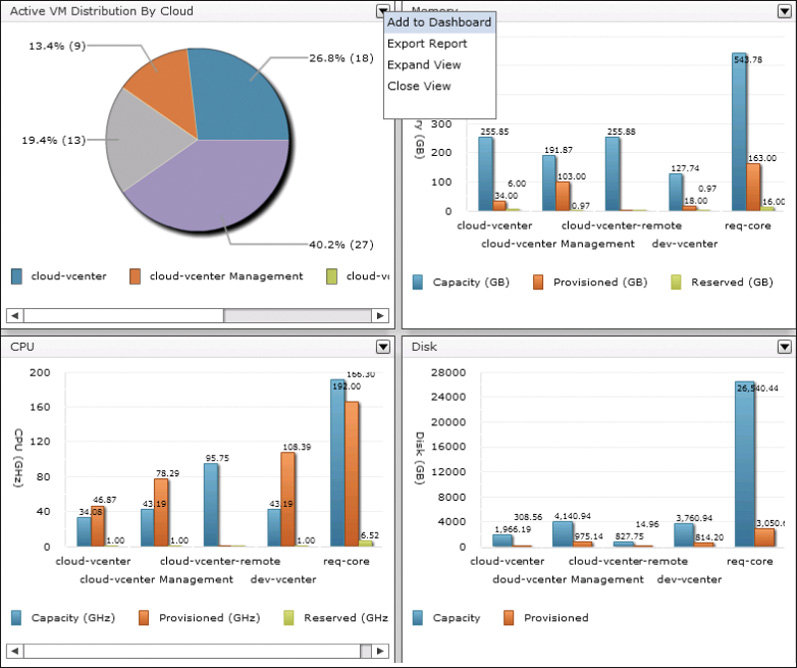
Once the Dashboard is enabled, return to the Summary dashboards containing the widgets you’d like to place on the System Dashboard. In the action menu for each widget, there is an option to Add to Dashboard, as shown in Figure 14-7. Continue adding whatever mixture of widgets will provide you with the details that will be interesting in your day-to-day administration of the cloud.
Once you’ve finished, navigate to the System Dashboard and you will see a nice cross-system Dashboard like the one shown in Figure 14-8. You can customize the display of the Dashboard by arranging the widgets in the desired order, adjust their size, and manipulate the time range over which any trending widgets are displayed. There is also an option to turn on auto-refresh of the Dashboard if you wish to leave it up in a browser tab throughout the day to make it easy to check the current status and health of your cloud.
Fault Severities and States
Part of the day-to-day administration of the cloud will be reviewing entries related to system events, faults, and debug logs. It will be important to be able to quickly understand the relative importance of each entry and identify those that are purely informational, and those that indicate a system state that requires remediation and action. Within the infrastructure and cloud management solutions leveraged in the cloud, there is a framework for classifying entries into monitoring systems to indicate their severity and state. Having a solid understanding of these classifications will be very important.
Table 14-2 breaks down the severity levels you will see related to events and faults within the UCS Director management reports, as well as within some of the available troubleshooting logs.
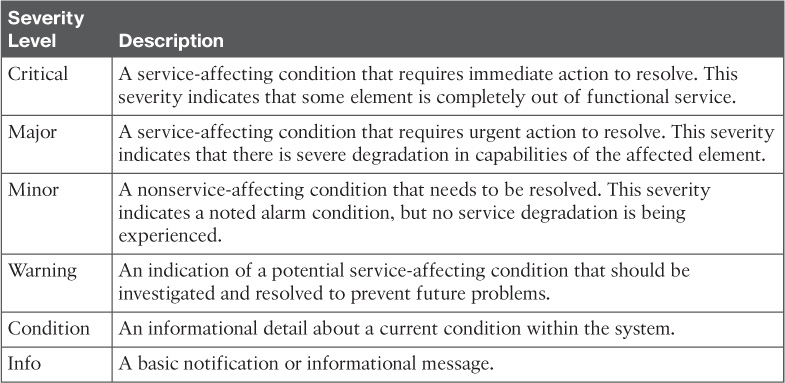
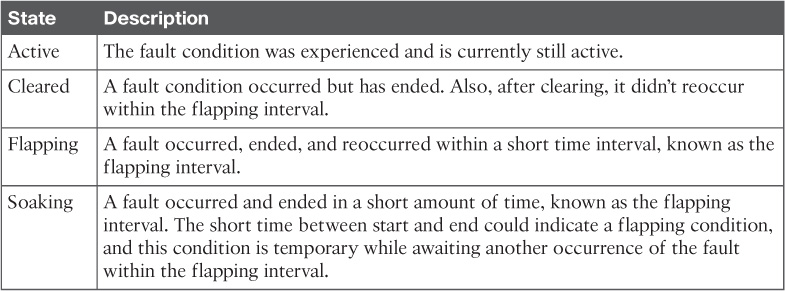
Table 14-3 identifies the different states that a fault condition could be in at a given point in time. Fault states are expected to change over time.
Cloud Monitoring
As the console for managing your private cloud, and the infrastructure it is constructed from, UCS Director provides several methods for monitoring the status and health of your cloud. In fact, we have covered many of them in previous chapters of this book, in addition to the coverage in the previous “UCS Director Dashboards” section. In this section we discuss three specific types of cloud monitoring that you should understand and leverage daily in your operations:
![]() Infrastructure event and fault monitoring
Infrastructure event and fault monitoring
![]() Performance monitoring
Performance monitoring
![]() Service request monitoring
Service request monitoring
Infrastructure Event and Fault Monitoring
It has been said that there is no cloud, just someone else’s computer. Though typically meant as a joke, there is definitely a kernel of truth within the statement. To be effective, every cloud relies on physical and virtual infrastructure operating efficiently and without error. A large portion of administering a cloud involves maintaining the storage, compute, network, and virtualization infrastructure in use. UCS Director isn’t meant to be a replacement for dedicated monitoring, alerting, and centralized logging tools you may be leveraging in your enterprise, but it does provide its administrators ways to check the status of infrastructure elements within the portal.
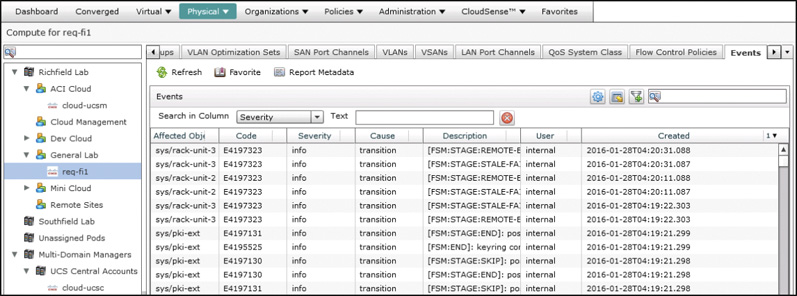
The Cisco Unified Computing System (UCS) is the leading computer platform for cloud builders, and one reason is the way it centralizes the monitoring within UCS Manager and exposes it through the open API. In addition to the policies, pools, equipment, and service profiles that are made available for management and automation within UCS Director, so are the faults, called events in UCS Director, at both the system and component levels. In Figure 14-9 you can see the Events report from a UCS Manager account within UCS Director. Even a stable, well-performing UCS domain will have lots of events at any point in time, so be sure to leverage the available filtering capabilities within UCS Director to narrow the scope of what is displayed.
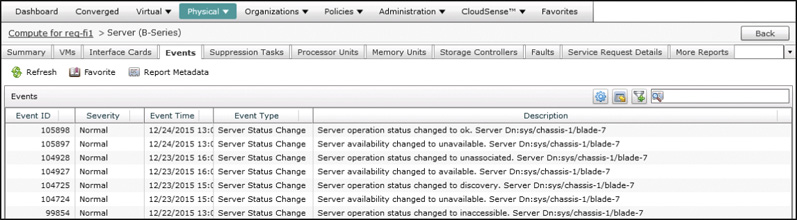
Another way to limit the displayed information is to look at the reports from within a particular component’s details. For example, in Figure 14-10 the Events page for an individual server blade is displayed.
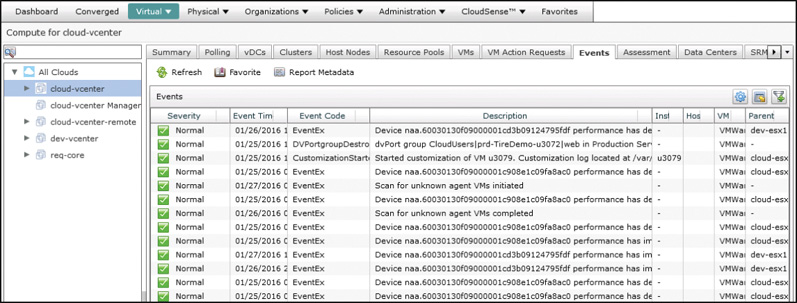
VMware vCenter provides similar centralized management and reporting for the virtual compute environment as UCS Manager does for the physical compute, and UCS Director likewise exposes events from the virtual accounts within its administrator portal. As key components of the cloud, having this information easily available, as shown in Figure 14-11, within UCS Director can make checking the current status and health a routine part of the cloud operator’s day. In cases where an event is identified as needing deeper investigation, the administrator will often decide to move from using the reporting and management capabilities of UCS Director to using individual element managers.
Performance Monitoring
Maintaining a well-performing cloud requires a way to understand and track cloud usage and reporting. Chapter 12 covered reporting options available within UCS Director in detail, and two of the reports discussed that can help you monitor the performance of the cloud are the Top 5 Reports and Trending Reports.
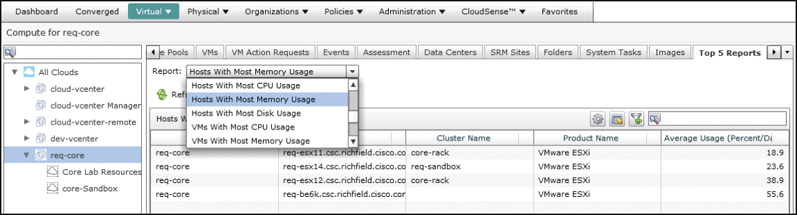
Top 5 Reports provide administrators with several options to look for elements of the environment that are overutilized, or simply find the largest consumers of cloud resources. Figure 14-12 shows the Hosts With Most Memory Usage report along with the drop-down list of other available host-focused reports. With these reports you can make determinations about when adding additional cloud capacity in the form of new hypervisor hosts may be necessary.
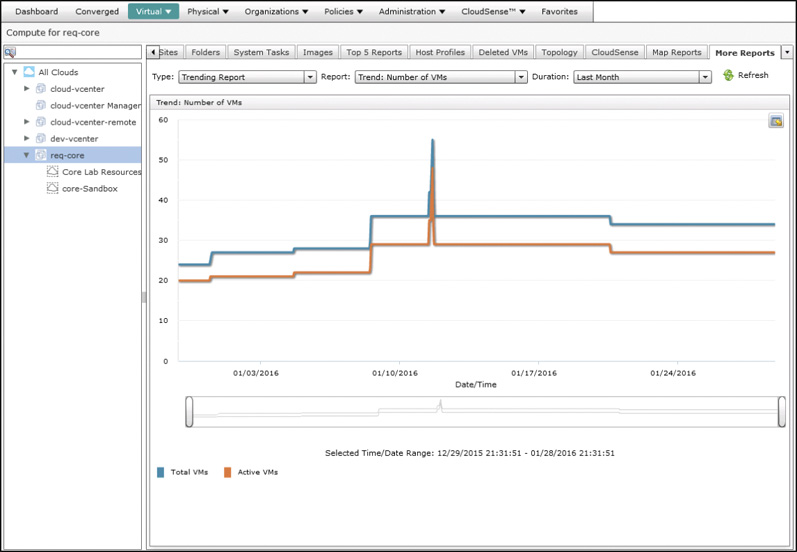
Most reports in UCS Director provide current details that are accurate as of the most recent inventory checks across the infrastructure. The one class of report that provides some historical details about the environment is Trending Reports. Trending Reports can show how a metric has changed over time, and allow the administrator to look for common patterns, or extrapolate what will likely occur based on past behavior. Figure 14-13 shows an example Trending Report for the Number of VMs over the Last Month. Other Trending Reports will show CPU, disk, or memory performance as well.
Service Request Monitoring
A successful cloud is a cloud that is being used, and that means you will spend a lot of time monitoring the status of service requests being executed by UCS Director. In the Chapter 9 section on service requests, you learned about how service requests provide the audit trail for all automation actions executed by UCS Director, as well as detailed information about each step of the workflow execution, and any objects created or modified. We’ll review some of the key elements related to monitoring cloud consumption in this section.
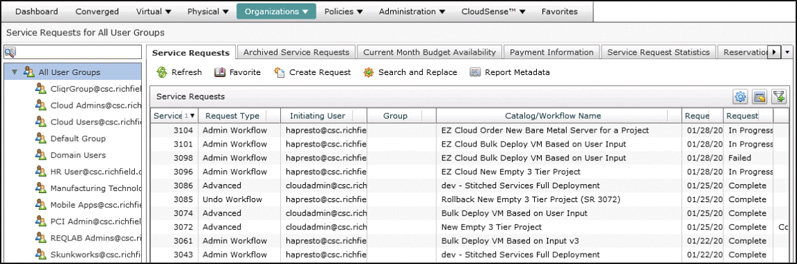
Navigating to Organizations > Service Requests from the administrator portal will show you all unarchived service requests in a display like that shown in Figure 14-14. In the figure, you can see in the rightmost column that there are several service requests that are Complete, three In Progress, and one that Failed. If you were to open one of the In Progress requests, you’d be able to track the automation as it progresses in real time through the Status and Log tabs in the display. This view will automatically update on a regular basis, but you can click the Refresh button to get the latest information at any time. That can be very interesting, but you will be far more likely to investigate Failed requests to identify and resolve the cause of the failure.
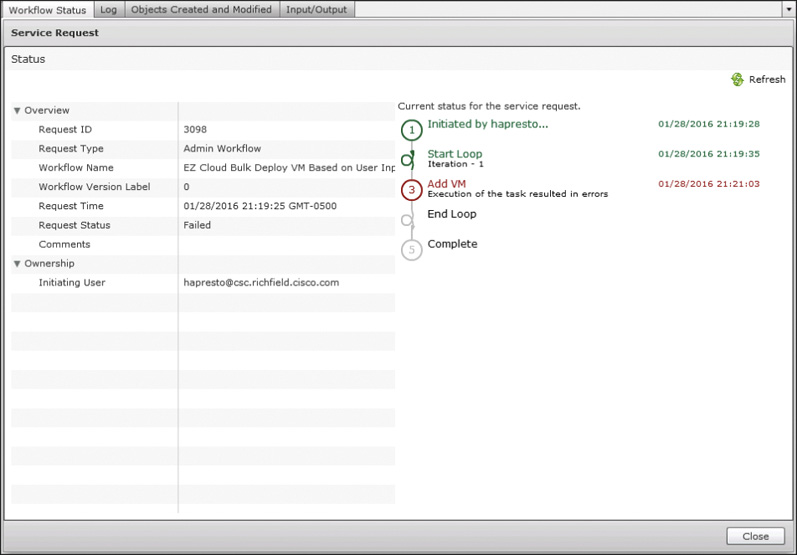
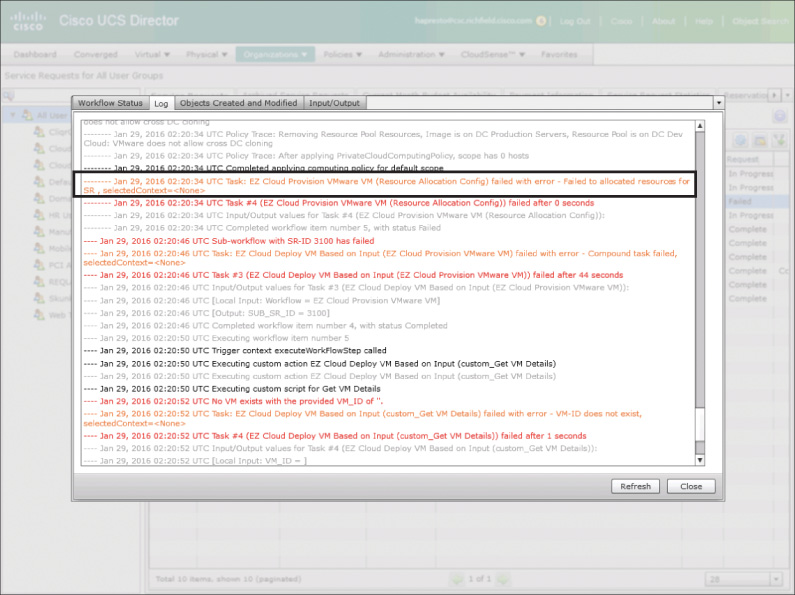
The Service Request Status view shown in Figure 14-15 will identify the step in the workflow that failed, but the real information is available in the Log tab shown in Figure 14-16. When you review the error messages and warnings (shown in red and orange in the log) and details in the log, the cause for the failure should be easily identified. In this example the problem, framed in the figure, is that UCS Director “Failed to allocate resources.” The service request was to deploy a new virtual machine, so this error indicates a problem identifying a compute, storage, and network to provision the new virtual machine into based on the vDC policies. This is often caused by a cloud that has run out of available capacity.
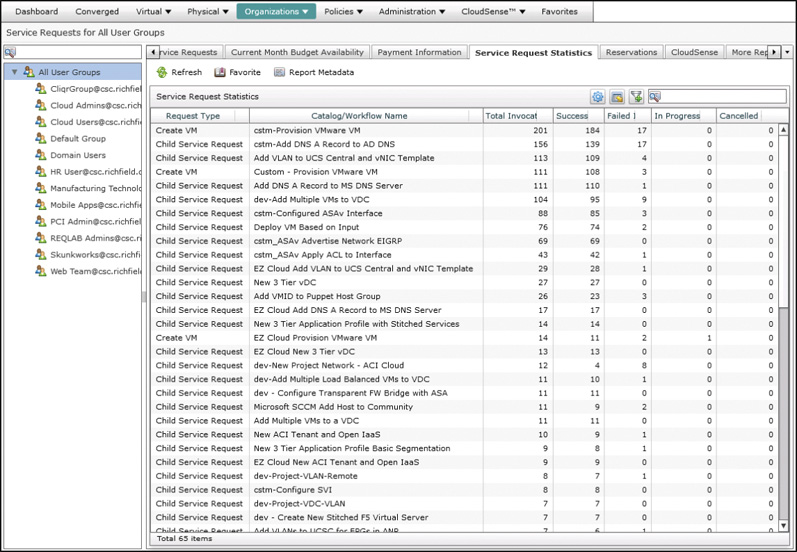
UCS Director also provides a CloudSense report for service requests that provides statistics about all the service requests that have been executed by the system. You can find the information available on the Service Request Statistics tab, shown in Figure 14-17, as an instant report, or from the CloudSense tab, where you can generate a point-in-time report to save for later analysis. The report provides details about the total number of service requests, including child service requests, that have been executed, the workflows they were running, and details on the numbers that were successful, failed, or are currently in progress.
Visibility and Troubleshooting Through Logs
Much of the day-to-day monitoring of cloud activities will involve leveraging the dashboards and reports that are readily available within the application portals. However, in some cases you may find yourself troubleshooting a system failure, installation problem, or some more challenging problem that requires you to look into the debug logs that are maintained by the appliances, but typically hidden from view. Often this will be at the request of Cisco TAC, but as you become more experienced with the components of the solution, you may find yourself consulting the logs on your own.
UCS Director Logs
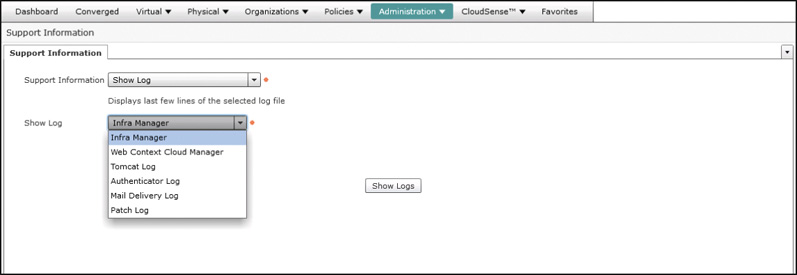
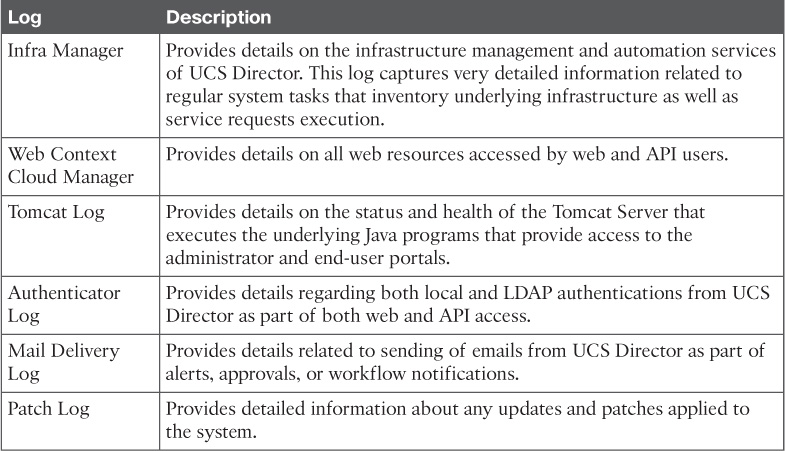
Under the Administration menu, navigate to the Support Information section of the portal. From this page you can generate one of several reports providing a deep look at the operational status of the UCS Director appliance as well as key logs from the appliance. The logs can either be displayed immediately or be downloaded for offline analysis. Figure 14-18 shows the list of different logs that can be generated, and Table 14-4 provides some details about what information each provides.
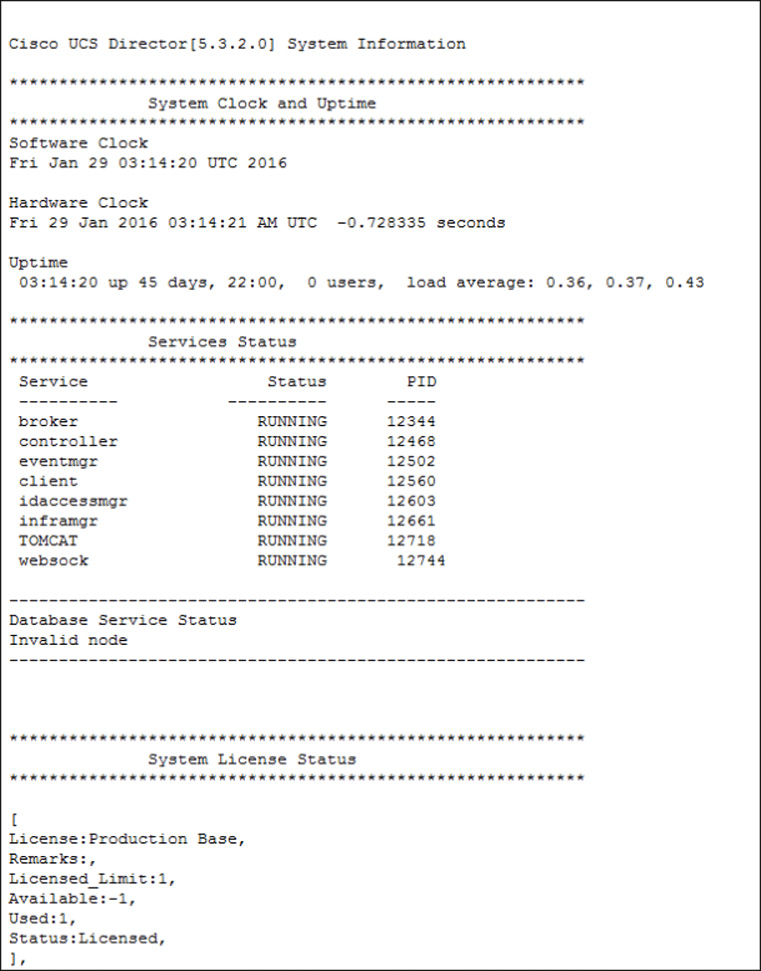
Along with the logs listed in Table 14-4, the System Information (both Basic and Advanced) report, generated from the Administrator > Support Information interface, is very helpful when seeking details related to the UCS Director appliance operation. A portion of the Basic report can be seen in Figure 14-19, but the full report provides information on the following:
![]() UCS Director Version
UCS Director Version
![]() System Clock and Uptime
System Clock and Uptime
![]() Service Status
Service Status
![]() Licensing Information
Licensing Information
![]() System Resource Usage (CPU/RAM)
System Resource Usage (CPU/RAM)
![]() Physical and Virtual Account Status
Physical and Virtual Account Status
![]() Catalogs Published
Catalogs Published
![]() Processes running
Processes running
![]() And much more
And much more
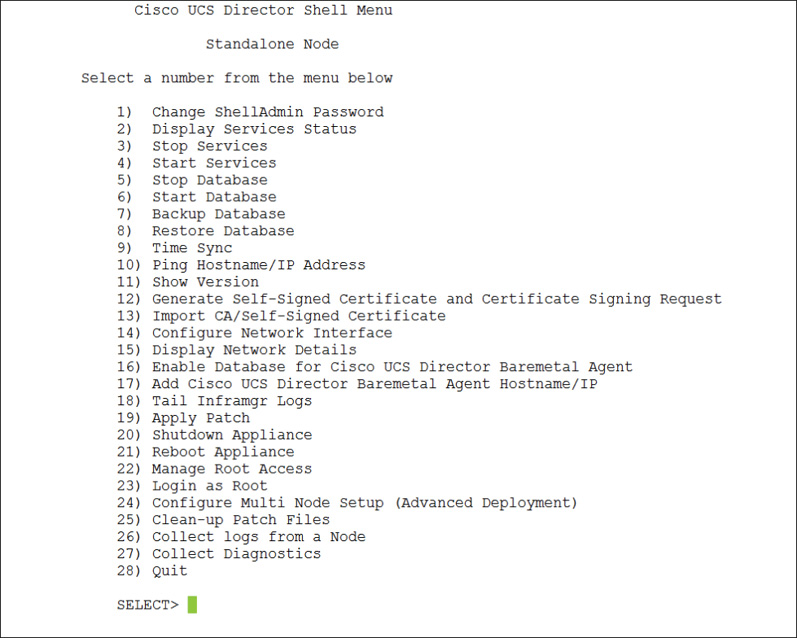
In the case of a major system failure, the administrator portal may be inoperable. In that case, you can access the same details by connecting to the appliance through Secure Shell (SSH) and accessing the command-line interface (CLI). From the main Shell Menu, shown in Figure 14-20, there is an option to view the Inframgr Log (option 18), but all the other information is available by gaining root access to the appliance (option 23).
Prime Service Catalog Logs
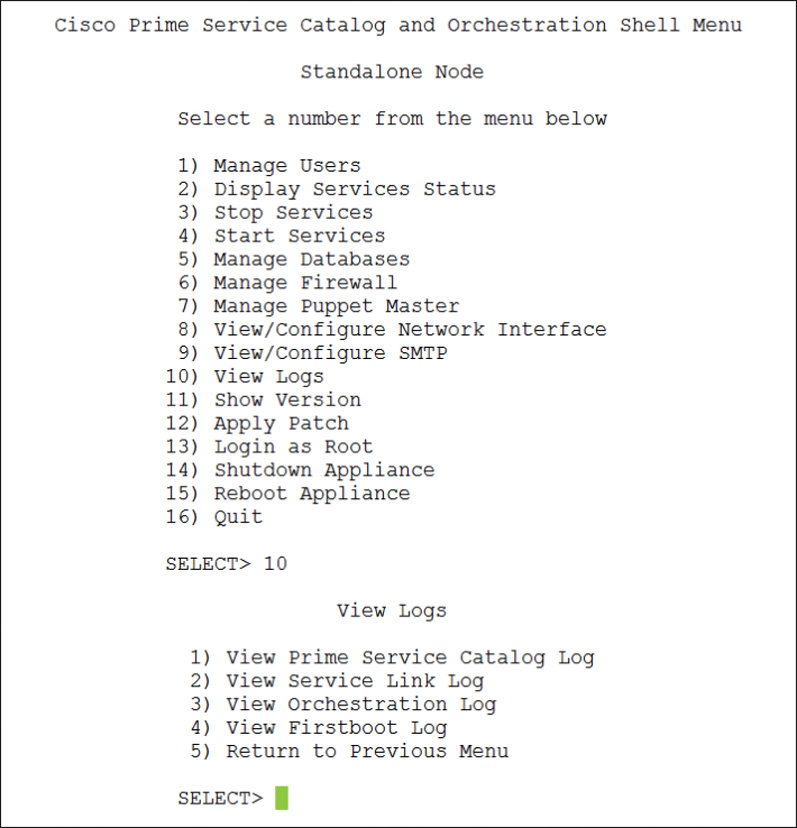
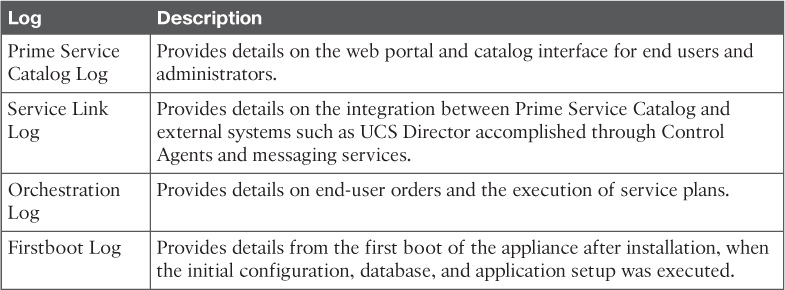
Similar to UCS Director, Prime Service Catalog provides access to logs through both the web interface and the Shell Menu. Figure 14-21 shows the Shell Menu for Prime Service Catalog with option 10 selected to reveal the View Logs menu, which provides quick access to key troubleshooting logs, descriptions for which are presented in Table 14-5. For deeper troubleshooting, the menu also provides the ability to log in as root (option 13), but doing so is recommended only under the advice and direction of Cisco TAC.
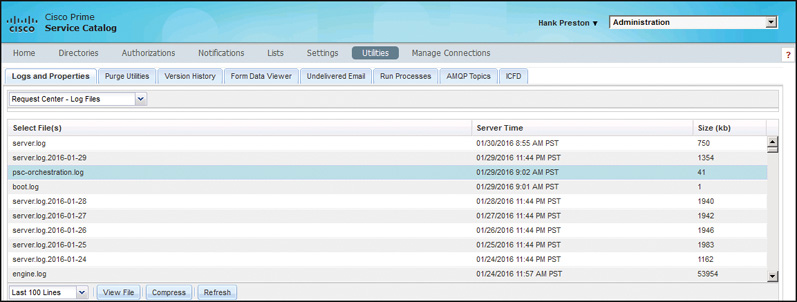
From the Administration module of the web interface, you can find access to the logs as well as other tools from the Utilities view. Figure 14-22 shows the Logs and Properties tab. Within the page you have access to view both the current and previous instances of the logs that have been compressed for archiving.
Backing Up the Cloud
There are numerous reasons in every IT field for making regular system backups and testing the ability to effectively restore from backups as part of standard procedures, and a cloud solution is no different. Whether the reason for backing up is to be prepared for a disaster condition, to fulfill a demand to have a second setup to test upgrades or new features, or to be able to roll back from some unintended mistake, you can be assured that during your role as a cloud administrator you will be called upon to back up, and perhaps restore your systems many times.
Before looking at how to get database backups from UCS Director and Prime Service Catalog, it is worth discussing one of the many benefits that compute virtualization provides and how to best leverage it as part of your backup strategy. All virtualization technologies today include the ability to take a snapshot of the current state of a virtual machine and roll back to that saved state in the future. This powerful capability makes some elements of backup and recovery much simpler than full system recovery from source and database backups; however, it does have some limitations and caveats. Snapshotting captures the current state of the running virtual server, and typically all storage disks, but it saves that information in the same location as the virtual server itself. This means that it does not protect against the underlying infrastructure failure. Also, the nature of snapshots means that over time the performance of the virtual machine will begin to decline as the hypervisor platform is maintaining the difference between the snapshot and the currently running virtual machine. Typical recommendations are to keep snapshots for no more than 72 hours, with many recommending no longer than 24 hours. This makes snapshots a great short-term backup and recovery option, but definitely not a long-term solution.
The ease of creating snapshots and restoring to them, plus their limited shelf life, make them ideal for use when implementing a major change to the system such as a patch or upgrade. Before executing the change, take a snapshot. Then, after you have completed the change and verified it was successful, you can delete the snapshot. However, should something go wrong in the change, you can easily roll back and return to a known good state. Many virtualization solutions allow for live snapshots—that is, while the virtual machine is running—but for UCS Director and Prime Service Catalog, it is recommended to shut down the virtual appliances before taking the snapshot. This is to be sure there is no problem due to active transactions in the database or open files.
Backups in UCS Director
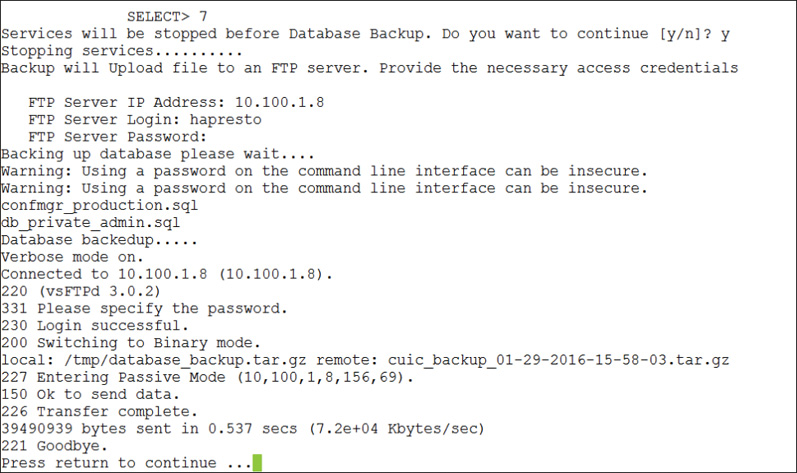
UCS Director database backup and recovery is done from the Shell Menu (previously shown in Figure 14-20), and not from the web administration portal. Again, this is due to the need to shut down all services prior to taking the database backup to ensure that it is complete and accurate. You will also need to have an FTP server available and an account with write permissions because the backup task includes transferring the backup to an external server. Choose option 7, Backup Database, from the Shell Menu to begin the following set of steps, an example of which is shown in Figure 14-23. If you are deployed in a multinode configuration of UCS Director, backups require some additional steps, but that procedure is outside the scope of the CLDADM exam and this book.
Step 1. Stop the services.
Step 2. Provide FTP server address, login, and password.
Step 3. Wait while UCS Director backs up the database, compresses the backup, and copies it to the remote server.
Step 4. After the backup is complete, press Enter and then manually restart the services using option 4, Start Services, in the Shell Menu.
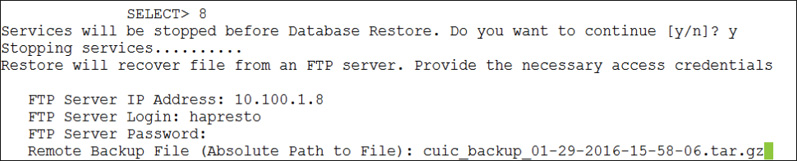
Restoring the database from backup follows a very similar process using option 7, Restore Database, from the Shell Menu. The steps are as follows and can be seen in Figure 14-24:
Step 1. Stop the services.
Step 2. Provide the FTP server address, login, and password.
Step 3. Provide the path and filename to the database backup file.
Step 4. After the restore completes, manually restart the services using option 4, Start Services, in the Shell Menu.
Using the Shell Menu to capture a backup is easy, but it is a one-time activity. Because UCS Director is based on a CentOS appliance, you can easily leverage the included cron utility to schedule regular backups. You can find an example of how to set this up in the Cisco Community at https://communities.cisco.com/docs/DOC-56973.
Backups in Prime Service Catalog
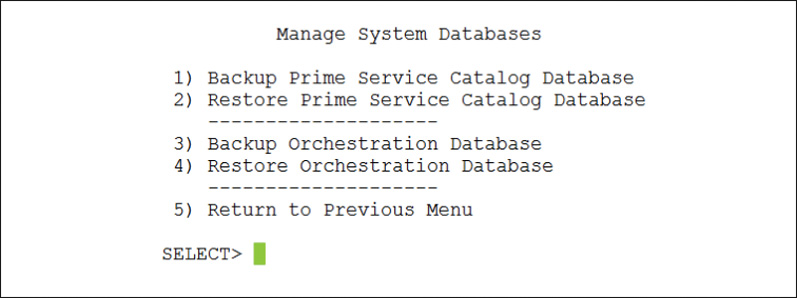
Similar to UCS Director, database maintenance for Prime Service Catalog is accomplished from the Shell Menu (shown previously in Figure 14-21), with backups and restores accessible within the top-level menu option Manage Databases, option 5. In the Manage System Databases menu, shown in Figure 14-25, you will find backup and restore options for the Prime Service Catalog Database and the Orchestration Database. To capture a full backup of the appliance, both databases are needed.
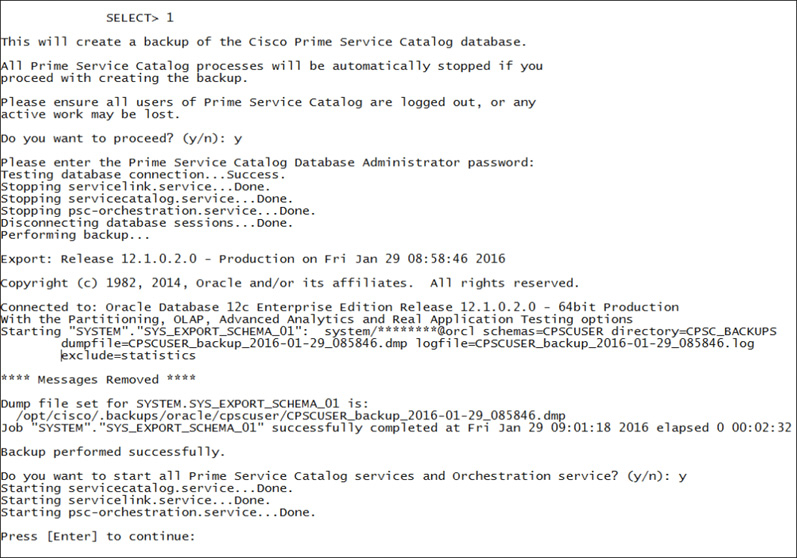
Whereas the backup option in UCS Director automatically copies the file to a remote FTP server, Prime Service Catalog saves the backup locally at the path /opt/cisco/.backups/ with subdirectories for each database. Each database backup or restore will require the services on the appliance to be stopped, just as with UCS Director. One extra piece of required information to execute the backups is the database password configured during initial installation, so be sure to have that readily available. Figure 14-26 shows an example of taking a backup of the Prime Service Catalog Database. Some of the informational output has been removed from the figure to focus on the key steps in the process.
After using the menu commands to create the database, you will need to copy it from the appliance to a remote server manually. You can do so using any number of commonly supported transfer protocols such as FTP, SFTP, or SCP. Another typical practice is to leverage cron on the underlying appliance to schedule automatic regular backups and remote copies, instead of relying on manual backups.
Exam Preparation Tasks
As mentioned in the section “How to Use This Book” in the Introduction, you have a couple of choices for exam preparation: the exercises here, Chapter 15, “Final Preparation,” and the exam simulation questions on the Pearson IT Certification Practice Test.
Review All Key Topics
Review the most important topics in this chapter, noted with the Key Topics icon in the outer margin of the page. Table 14-6 lists a reference of these key topics and the page number on which each is found.
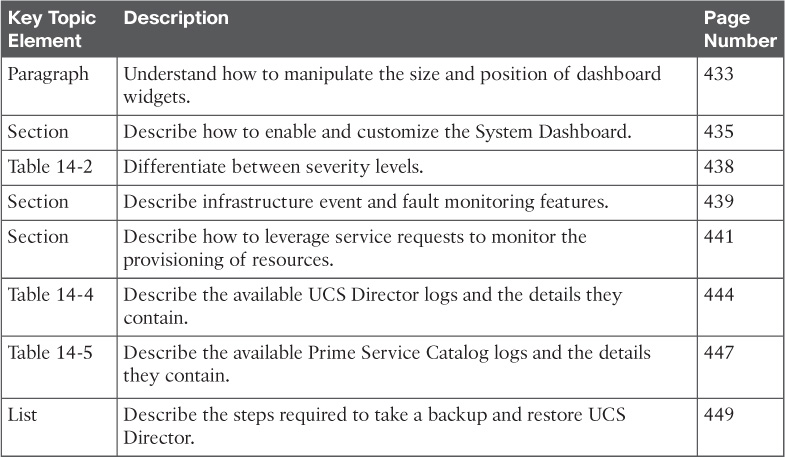
Table 14-6 Key Topics for Chapter 14
Complete Tables and Lists from Memory
Print a copy of Appendix B, “Memory Tables” (found online), or at least the section for this chapter, and complete the tables and lists from memory. Appendix C, “Memory Tables Answer Key,” also online, includes completed tables and lists to check your work.
Define Key Terms
Define the following key terms from this chapter and check your answers in the glossary: