In 2005 Best Buy, a leading "big box" retail chain stunned the business media by formally announcing that it was focusing its marketing and sales efforts to attract and grow those types of customers who were more likely to generate profits for Best Buy. This implied it would pay little or no attention to the types of customers who infrequently shopped in its stores or minimally purchased goods, or only discounted items. Some of Best Buy's competitors immediately pounced on this in an attempt to embarrass Best Buy and broadcast to the marketplace that they would cater to everyone. That reactive maneuver by competitors was a short-lived marketing campaign, and Best Buy held its ground and continued to earn above-industry average profits. Best Buy was simply pursuing what many organizations have intuitively sensed and some have actually measured— there are certain types of customers who are more profitable today and more valuable in the future with long-term potential.
Best Buy was acknowledging a shift in business thinking. It is no longer just about increasing sales but more appropriately increasing sales profitably. In short, measuring gross margin profitability on sales from products and standard-service lines is not the only metric to monitor. It is important to additionally acknowledge and distinguish the cost-to-serve between high demanding and low demanding types of customers to get a full picture of where a business is making or losing money. Accountants refer to this as computing fully loaded costs. This obvious but often neglected reality is well described by two Columbia University professors:
Most sales people manage for short-term revenues (regardless of profits). . . . With an increasingly sophisticated customer base that wants lower prices, greater service, and more control; this strategy most often results in declining profit margins and commoditization.
Increasingly buying power and market influence is being concentrated in an ever-smaller number of strategic customers. Hence, going forward, we believe that companies will have to think beyond short-term revenue and profitability of today. They will have to take the long view and manage their strategic customer relationships as assets. They will attempt to maximize the net present value (NPV) of future profit streams from these customers, thus shifting to the enhancement of long-term Customer Relationship Capital.[61]
Companies must improve in several areas when it comes to strategizing, measuring, and acting on customer value. Organic growth, by focusing on existing customers, should be viewed as sustaining strategy, and understanding customer value is the key to organic growth. But this is not easily achieved because at the strategy level many companies remain focused on "product-out" rather than "customer-in". If the strategic focus is to sell as many products as possible, customers get swamped by irrelevant marketing and sales offers, and they are subjected to poor experiences. It is very difficult to acquire, grow, or retain profitable customers in that kind of environment.
To further complicate matters, the CIO is tasked with the challenge of satisfying two somewhat disparate views and perspectives of their organization—the information technology (IT) stakeholders and the business management leaders. Of course, there is overlap and some would argue these two views are one in the same. Regardless of the outcome of that debate, the CIO function is challenged today to deliver well beyond just maintaining and improving reliable transaction-based information systems and include effective decision support as well—which some refer to as business intelligence. This chapter addresses the evolving relationship between an enterprise's CFO and the CMO. The CIO's role is to service both functions as the bridge between them is strengthened.
Estimating the ROI on purchasing equipment is near science. In contrast, determining the ROI on some marketing programs may be considered more of an art than a science. Thus, a large part of the marketing budget is typically based on faith that it will somehow grow the business. There is a very old rumored quote from a company president stating, "I am certain that half the money I am spending in advertising is wasted. The trouble is, I do not know which half." This expresses a valid concern—and it applies to the many marketing programs in addition to general advertising. Marketing spends money in certain areas, and the company hopes for return. Was that brochure we just mailed a waste of time and money or did it actually influence someone to purchase? No one in senior management seems to question that sales, marketing, and advertising is something the company must spend money on—but how much money? How much is too much? Where is the highest payback to focus and where to avoid?
Companies are extremely vigilant about all spending. They exercise draconian actions, such as layoffs, to right-size their cost structure. The budget expenditures for sales and marketing should be subject to the same intense examination of the COO and CFO as any other spending programs.
The ROI on marketing, and each marketing program or campaign, must be better projected—not with fuzzy math but by using modern analytical techniques, fact-based logic, and financial data. After all, in the absence of facts, anyone's opinion is a good one. (And the biggest opinion usually wins! And that opinion is usually one's supervisor or the supervisor of that supervisor.) The CIO function can aid the chief marketing officer here. Many marketing functions rely on imperfect metrics, anecdotes, and history that may have been a result of unusual occurrences unlikely to be repeated.
I am not arguing to slash all marketing budgets by exposing them as a waste. In fact, I mean just the opposite. The marketing spend is critical—but treat it as a preciously scarce resource to be aimed at generating the highest long-term profits. This means the need for answering questions such as, "Which type of customer is attractive to newly acquire, retain, or win back? And which types are not? How much should we spend attracting, retaining, or recovering them?" Some firms have already enacted programs in these areas to begin trying to answer these questions. More must do this.
Although the marketing and sales functions clearly see the links between increasing customer satisfaction and generating higher revenues, the accountants have traditionally focused on encouraging cost reduction as a road to higher profits. A way for investors, shareholders, and a management team to think about measuring a company's promise for long-term economic value growth performance is to measure its customers. Although today the CFO's managerial accounting planning and control systems typically focus on operations management, the CFO is now shifting their assistance to the chief marketing officer (CMO) and sales director—and the benefits can be substantial.
In the past ten years, five major forces are converging that place immense pressure on companies, particularly on business-to-consumer (B2C) ones:
Customer Retention. It is generally more expensive to acquire a new customer than to retain an existing one—and satisfied existing customers are not only likely to buy more but also "spread the word" to others like a referral service. Hence there is an increasing focus on customer satisfaction. The trend in emphasis is toward growing existing customers and making them loyal rather than a focus on acquiring new ones. This has resulted in loyalty programs and other frequency points programs growing in popularity.
A Shift in the Source for Competitive Advantage. In the past, companies focused on building products and selling them to every potential prospect. But many products or service lines are one-size-fits-all and are managed like a commodity. To complicate matters, product development management methods (PDM) have matured and accelerate quick me-too copying of new products or service lines by competitors. Consequently, as products and service lines become commodities, where competitors offer comparable ones, then the importance of service rises. There is an unarguable shift from productdriven differentiation toward service-based differentiation. That is, as differentiation from product advantages is reduced or neutralized, the customer relationship grows in importance. This trend has given rise to many marketing organizations focusing on segment, service, and channel programs, as opposed to traditional product-focused initiatives. Business strategists all agree that differentiation is a key to competitive advantage. This was a main revelation in Michael Porter's seminal book published in 1998, Competitive Advantage, which launched strategic planning as an essential company function.
"One-to-One" Marketing. Technology is being hailed as an enabler to (1) identify customer segments, and (2) tailor marketing offers and service propositions to individual customers (or segments). There is now a shift from mass marketing products a seller believes it can sell to a much better understanding of each customer's unique preferences and what they can afford. Spray-and-pray marketing campaigns waste spending needlessly. Companies may even need to better understand their customer's customer. Traditional marketing measures like market share and sales growth are being expanded to more reflective measures of marketing performance such as additional products and services sold to existing customers. There is frequent reference to "share of customer wallet". Customer lifetime value, to be discussed later, is a trendy new indicator for customer economic value. In short, the message is that companies must now continuously seek ways to engage in more contentrelevant communications and interactions with their customers. Each interaction is an opportunity to gain knowledge about customer preferences—and to strengthen the relationship.
Expanded Product Diversity, Variation, and Customization. As product and service lines proliferate, such as new colors or sizes, it results in complexity. As a result, more indirect expenses (i.e., overhead costs) are needed to manage the complexity; and therefore indirect expenses are increasing at a relatively faster rate than direct expenses. With indirect expenses growing as a component of an organization's cost structure, managerial accounting practices typically require enhancing. (Many costing systems arbitrarily allocate overhead to products based on broad-brush averages, such as product sales or direct labor hours; so they do not reflect each product's unique consumption of indirect expenses. Activity-based costing (ABC) is now accepted as the method that resolves this problem (see Chapter 4, pg. 156-82, for applications of ABC to IT Finance). ABC traces and assigns costs based on cause-and-effect relationships (Appendix 6.A describes a basic outline of ABC). This does not mean that an increase in overhead costs is a bad thing. It simply means that a company is required to invest and spend more on expanded product offerings and services to increase its customers' satisfaction.
Power Shift to Customers. The Internet is shifting power—irreversibly— from sellers to buyers. Thanks to the Internet, consumers and purchasing agents can more efficiently explore more shopping options and they can more easily educate themselves. Customers have anabundance of options; and now they can get information about products or services that interest them in a much shorter amount of time than what today appear as the antiquated ways of the past. The customer is in control more than ever before. Consequently, froma supplier's perspective, customer retention becomes even morecritical and treating customers as "a lifetime stream of revenues "becomes paramount. This shift in power from sellers to buyers is placing relentless pressure on suppliers. Supplier shakeouts and consolidations are constant.
The combination and convergence of these five forces means that suppliers must pay much more attention to their customers. The implication is clear. Profit growth for suppliers and service providers will come from building intimate relationships with customers, and from providing more products and services to one's existing customer base. Earning, not just buying, customer loyalty is now mandatory. But how much should a company spend in marketing to retain customers, and which type of customers should it spend more on? Few organizations can answer these questions.

When it comes to measuring the overall marketing function, many companies miss the ROI mark. They do not have meaningful, consistent, and reliable marketing performance metrics. Worse yet, in an attempt to build customer loyalty, they continue to deploy blanket mass-marketing strategies rather than differentiate (i.e., segment) their customers based on cross-sell and up-sell opportunities. Good customer intelligence systemshelp organizations make smarter decisions faster. A workflow or business process without the ability to measure, analyze, and improve its effectiveness simply perpetuates a problem. A good customer relationship management (CRM) system allows end-to-end functionality from sales lead management to order tracking—potentially seamlessly. Exhibit 6.1 illustrateskey components for measuring the performance of marketing with examples of performance metrics.
The top half of this decomposition tree focuses on customer value management, which is the topic of this article. The lower half describes the effectiveness and productivity of the marketing function itself and one of its tools of the trade—marketing campaigns. The CFO should help theCMO measure both. This chapter digs deeper into the two key financial measures for customer valuation management: customer profitability and customer lifetime value (CLV). Part 2 places customer relationship management into a broad framework and context.
Focusing, but not Obsessing on the Customer
The focus in this part of the chapter is customer portfolio management to reward the company's shareholders. To create higher shareholder wealth, a company must continuously analyze its customer portfolio in innovative ways to discover new profitable revenue growth opportunities. The CIO becomes critical because data typically resides in multiple and disparate databases. A business strategy to realize revenue and profit opportunities will generally pursue the following objectives:
Identify, understand, and address your best (and worst) customers.
Target and sell existing products and services to existing customers.
Target new prospective customers with similar profiles as your most valuable existing customers.
Develop compelling new product and standard service line offerings, price schemes, and marketing programs for the entire customer portfolio.
Retain and maximize the share of wallet for the most profitable customers as well as those who have a high probability of becoming profitable, hence more "valuable," in the future.
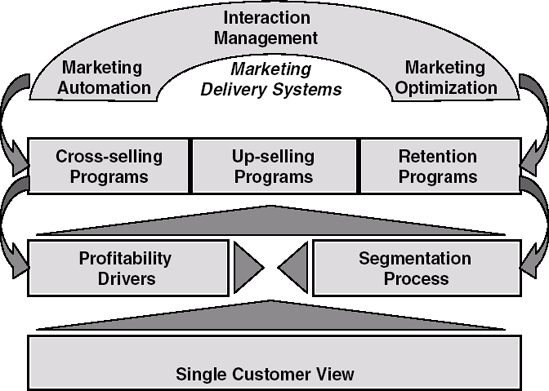
A company must possess a number of core capabilities in order to accomplish these objectives. Exhibit 6.2 illustrates how these begin by constructing a foundation of customer information that is a 360-degree perspective with the capacity to reach customers on a one-to-one basis via effective marketing delivery systems. Let's explore these capabilities in more detail.
Companies often have difficulty accessing, consolidating, and analyzing the necessary customer data that exists across their various business systems. This issue is exacerbated with time as the number of systems and discrete customer databases expands. Becoming customer-centric requires a view of data that involves no walls. For example, a bank should ideally consolidate its information into a single database rather than keep its credit card data in one silo, its bank account data in another, and its mortgage data in yet another. A "single view" of the customer must be created—a view that consolidates relevant and accurate data related to a single customer across different organizations, databases, and operational systems.
Meaningful transactional and descriptive customer data coupled with the right analytic processes and software provided by the CIO can prove or refute theories about which customers are most valuable to serve and retain and which are not. Understanding customer value and profitability using activity-based costing methods helps define value and profitability segments and their profitability drivers. It also provides clues on how to improve costs-to-serve (and therefore, profitability) in the future. Whether your cost accounting approach is limited in scope to only assign product, standard service line, and distribution costs to customers, or beyond that scope also fully allocates all other costs and capital, identifying customer profitability drivers is a necessary dimension to understanding and segmenting the customer base. These approaches also identify the less profitable (and in some cases unprofitable) customers and provide alternative strategies for how to unlock value hidden in customers as assets.
A customer-centric approach segments the customer base in multiple ways. As an example for a bank, it is not enough to simply know the ages of customers and say, "We'll market IRAs to the 40-year-olds" or to simply know the total assets a customer holds with the bank and in which accounts. Customer segmentation is much more granular. Continuing with the bank example, it means knowing which customers respond to e-mail marketing efforts or mailers, whether they move money in and out of their accounts and how often, or whether they prefer carrying debt on a home equity line versus a credit card. It means packaging all of this data into a single view of the customer that can be updated in real time. It is useful, almost essential, to know what the customer is doing today, not only what she did six months ago, and to be able forecast her future behavior based on predictive models. Each industry has its own examples of customer behavior; however, they all typically involve a substantially greater depth of understanding customers than their relatively simplistic monitoring today.
Many organizations primarily segment their customers by the classic "recency, frequency, and monetary spend (RFM)" metrics, by demographics, and by the products and service lines that their customers purchase. In the advanced analytics organizations, these segmentation approaches are viewed as rudimentary, and they do not necessarily relate to customers' future needs or likely behaviors. Without more effective customer segmentation with respect to current needs and/or likely future behavior, companies have difficulty executing successful strategies for improving their profitability—current and long-term—from existing and future customers with new products and standard service lines or increased marketing campaigns. A deficient segmentation scheme may also negatively impact customer loyalty and ultimately increase costs by mismatching product/pricing offers and appropriate customer segments.
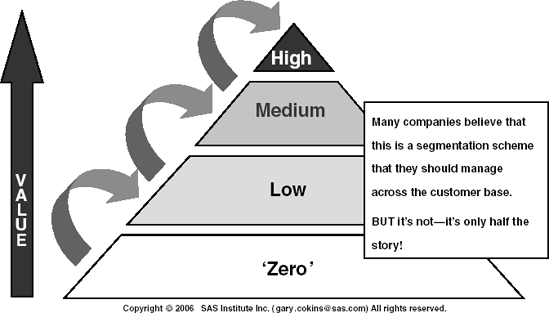
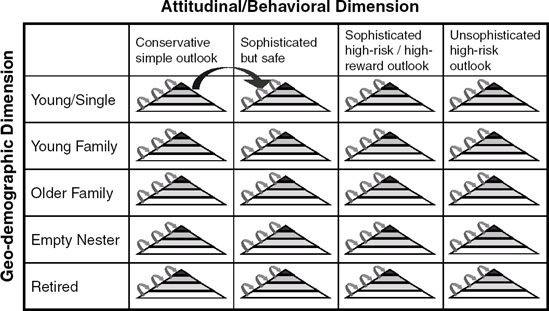
Incorporating robust segmentation schemes helps identify movement between segments of specific customers (based on changes in needs and/or behavior) and pinpoints the emergence of new and distinct segments over time. Exhibit 6.3 illustrates the traditional view of how a company may attempt to shift a customer "up to a higher" customer category. In contrast, Exhibit 6.4 illustrates how geo-demographic segments of customers can be shifted across attitudinal and behavioral dimensions.
More sophisticated schemes of segmenting customers by meaningful dimensions, including transaction and mix volumes, demographic, geographic, attitudinal, behavioral, and profitability, yield distinct and manageable groups for targeted activities and differentiated services. Programs such as marketing campaigns tailored for specific offerings or deals have much higher success rates over time due to greater customer response.
Undisciplined mass-marketing efforts can cost more than the incremental revenues from new business they bring in. That is, the ROI on some marketing can be negative. Spray-and-pray marketing to broad undifferentiated segments of customers is out. They can also be a turnoff to customers whose mailboxes are bursting with offers. Micro-segmenting is in—with the smallest micro-segment being an individual or a household.
Using the foundation of a single customer view, an understanding of customer value and profitability drivers, and a refined customer segmentation scheme, a company can use sophisticated analytic software to predict "what next?" for individual customers. Analytic software allows a company to build predictive models based on customer segment characteristics and outcomes (i.e., demonstrated behaviors), and then apply those models to other customers to determine which customers are good candidates for similar cross-selling and up-selling offers, as well as which customers may be at risk of leaving-either defecting to competitors or no longer purchasing products or services. The CIO must provide users with tools to facilitate these types of models based on an understanding of their uses.
Market basket analysis allows an organization to predict likely candidate customers for cross-sell opportunities given historical data on products and service lines previously purchased by customers, as well as customer demographics, purchase patterns, and other telling variables. Continuing with a bank example, one can identify the purchase stream path certain customers take starting from simple checking and savings accounts upward to more profitable automobile loans and home mortgages. Market basket analysis can lead to insights and potential inputs to predictive modelsand clusters to identify with greater confidence cross- and up-sell opportunities.
This kind of analysis helps companies understand product affinities by looking for an association between the purchasing of one product or standard service line and another. This association can be detected if two products or services are sold at the same time or even if there is a time lag between purchases. Either way, organizations can identify cross-sell and up-sell patterns and then create models to predict this behavior with more certainty. These models can then be identified to aid targeted marketing campaigns aimed at increasing customer value. To be clear, market basket analysis and predictive modeling differ in that market basket analysis is more exploratory for learning, whereas predictive modeling applies scoring of customers that enables rule-based decisions for actions.
Retaining profitable and potentially profitable customers is a top priority. Analytics like these examples can be used in a similar way to identify which customers are likely to leave and why—information that can then be used to target effective customer care and retention programs to ensure that the best customers remain with the organization. This ability to predict which customers are likely to defect to competitors—and address the drivers before they become issues—can be a critical competitive differentiator.
After a company understands its customer profitability and their drivers and develops risk mitigating actions and programs appropriate to serve their segment characteristics, then they need to apply an array of effective marketing mechanisms to deliver the right offer to the right customer at the right time at the right cost. Fortunately, there are commercial software providers with solutions to accomplish just those objectives for the CIO to evaluate in concert with IT organization's customers:
Marketing automation software helps companies plan, automate, execute, and measure marketing campaigns. Advanced analytic software integrates with the "single view" customer database, as well as the processes and analytics used to assess customer value and profitability, to develop segments and appropriate cross-sell, up-sell, and retention programs.
Interaction management software enables marketers to immediately respond to changes in individual customer behavior to execute realtime cross-sell, up-sell, and retention strategies. Sophisticated algorithms can track and recognize changes in individual customer behavior and create real-time triggers and alerts that enable businesses to take instant action. For example, upon an inbound customer phone call to a call center, the customer service representative can follow rule-based instructions to offer deals or offers to entice the customer to purchase more.
Marketing optimization software helps companies model and assess the cost/benefit trade-offs of increasingly sophisticated and frequent customer communications. It can provide insight on how marketing constraints affect profitability and can recommend the best assignment of offers to customers to maximize profitability (or some other objective) given defined constraints. Though many of these software offerings are fairly new, the best ones integrate with marketing automation software to ensure a closed-loop marketing delivery system.
The use of real-time customer behavior to improve customer retention and increase cross-sell and up-sell revenue gives companies an opportunity to take a major step toward one-to-one customer communications. Best practice CIOs increasingly take advantage of technology's ability to provide real-time data.
Even when armed with fresh customer insight, companies fall short if this knowledge does not become a central part of the organization's everyday work activities and priorities. Where are companies dropping the organizational ball? It starts with managing the customer experience. For example in a bank, from relationship managers and call center representatives to segment managers and ATM machines, the bank must deliver a positive and consistent experience to high-value and high-growth customers. In doing so, the entire organization works together to increase customer value, loyalty, and profit. The majority of companies continue to organize around product groups or lines-of-business rather than customer groups. Such organizational misalignments create poor customer experiences with real financial impacts.
Organizational realignment around customer value cannot happen without technology. Fortunately, technology has matured to the point where it can collect and distribute the customer intelligence needed to keep employees focused on building customer value. When a breakdown does occur, it is because technology is not tied to a focused strategy of acquiring, retaining, and growing the right customers. The CIO can help correct this. Technology cannot do its job if the lines-of-business are working independently with separate solutions and business rules. Technology's role is to integrate data, processes, and people to gain a single view of customers. The best approach is to deploy a suite of solutions that deliver analytics based on rigorous data management. A single technology platform is the organizational backbone for rolling out business rules on how to identify and treat high-value and high-growth customers. In CIO jargon, some refer to this platform as a unified meta-data repository. CIOs must be moving their IT infrastructures so their applications and analytics can access data this way.
Ownership, accountability, and performance measures are another important piece of the puzzle. It must happen at the management level and the customer-facing level. This is where the strategy maps and Balanced Scorecards discussed in Chapter 5 fit in. Once the company has accurate customer value scores and tracking mechanisms in hand, managers can establish the strategy, processes, and policies for increasing that value and managing the customer experience. It is then up to customer-facing teams to coordinate to implement management's strategic intent and directives. The company is now in a position to incent, reward, and assess performance based on changes in customer value. Rather than traditional volume-based benchmarks, such as sales, companies can ask "how much has the profitability of the customers under your watch changed?"
Realignment around customers involves balancing a product-driven environment with manageable steps to make better use of customer insight. By mapping the experiences of customers across channels and at each stage of the customer life cycle, a company gets a clearer picture of where the gaps in execution are taking place. It can then identify which organizational capabilities it must improve upon to close the gaps, including people, processes, infrastructure, and culture. The final step is to prioritize the needed capabilities and draw action plans for achieving results in a manageable time frame.
Executives must evaluate their company's ability to proactively manage its customer portfolio. They should ask some of these questions:
Can we build a single view of our customers using all available data sources? How quickly can we merge an acquired firm's data into ours? And with what level of data integrity?
Do we understand the profitability (and drivers) of our existing customers? Are we more product-centric than customer-centric in our understanding of profitability?
How do we create and target customer segments? Is each defined segment distinct and manageable?
If we acquired a company today, could we rapidly determine which of our customers might be interested in a unique product offering of the acquired company? Likewise, how long would it take to tailor a pitch to our new customers about products we currently offer? How would we identify those desirable customers who are at greatest risk of leaving?
Can we create high-volume, opt-in e-mail campaigns that provide a highly personalized communication with compelling response rates?
Can our managers and customer service reps access customer profiles on their desktops, allowing for smarter customer interactions?
Affirmative answers to these questions and the ability to execute customer-centric strategies can mean the difference between meeting or disappointing the expectations of shareholders and owners.
Customer value insight drives success. Measuring and acting on customer value is proven to deliver higher profitability, organic growth, and competitive advantage. But the why behind customer value is not the problem. It is the how that gets overlooked. The result is that most companies have not captured the substantial benefits from more loyal and profitable customer relationships. At least not yet.
By refocusing customer strategy, retooling measurement mechanics with aid from the CIO function, and taking steps to realign the organization around customers, companies unlock the vast profit potential of the customer asset. They retain and grow existing customers and acquire new high-potential customers that drive the greatest amount of profit today and in the future. Lasting competitive advantage is not far behind.
Why Do Customer-Related Costs Matter?
Increasing shareholder wealth comes down to three areas: costs, potential customer value, and customer needs. When companies do not sufficiently understand these three areas, they end up placing customers into the wrong value buckets. This ripples out to sub-optimal managerial decisions, the misallocation of marketing and sales resources, and the familiar outcomes of lower profits, slower growth, and no competitive advantage. The CIO function plays an important role merging these three areas.
"The only value your company will ever create is the value that comes from customers—the ones you have now and the ones you will have in the future," state Don Peppers and Martha Rogers, Ph.D. in their most recent book, Return On Customer.[62] "To remain competitive, you must figure out how to keep your customers longer, grow them into bigger customers, make them more profitable, and serve them more efficiently." Over time, enterprise value goes up because the company is maximizing its Return on Customer sm.2
Increasing the profitability of each customer, not simply products and service lines, is a way to sustain long-term economic value growth for the enterprise and its investors. How many customers does it have? How much profit is it earning from each customer (or at least each customer segment) today and in the future? What kinds of new customers are being added and what is the growth rate of additions? How and why are customers migrating through segments over time?
As a result of varying customer demands for different levels of service, the cost-to-serve component of each customer's profit contribution requires measurement and visibility. As widely varying customization and tailoring for individuals becomes widespread, how will companies distinguish their profitable customers from their unprofitable ones? In a sense, it is these customers who are partners selected to grow the supplier's business and wealth creation. Companies now need financial measures for how resource expenses are uniquely consumed, below the gross margin line for product costs, by each diverse customer.
The problem, however, is that managerial accounting systems of most companies concentrate on product or service line costs (which are often flawed and misleading by arbitrary broad-average-based cost allocations) because regulatory financial accounting rules (i.e., GAAP) require compliance (see Chapter 4). But when it comes to the below the gross margin line expenses, such as distribution channels, sales, and marketing, the accounting rules require these expenses to be recognized during the month period in which they were incurred; they cannot be capitalized and stored in the balance sheet as inventoriable product costs can. Accountants refer to these as period costs. But classifying expenses that way is for external financial accounting for banks, investors, and regulatory agencies. The discussion here focuses on internal managerial accounting to support the analysis and decision making of managers and employee teams. The accountants must begin applying the same costing principles for product costing, typically based on activitybased costing (ABC) principles, to types of channels and types of customers so that there is visibility to all traceable and assignable costs. Otherwise, the company has no clue where it is making and losing money.
Today, services are increasingly being added to products, and unique services are being tailored for individual customers. ABC data is essential to validate and prioritize the financial merits of which services to add and for which customers.
There is an unchallenged belief that focusing solely on increasing sales dollars eventually leads companies to depressed profitability. I support this belief. What matters is a mind-shift from pursuing increased sales volume at any cost to pursuing profitable sales volume.
Some customers may purchase a mix of mainly low-margin products and service lines. After adding the "costs-to-serve", such as phone calls for customer service, transactions exclusively in high-cost channels or special delivery requirements, these customers may be unprofitable. Other customers who purchase a mix of relatively high-margin products may demand so much in extra services that they also could potentially be unprofitable. How does one properly measure customer profitability? How does one migrate unprofitable customers to profitability or de-select them and eventually "urge them out"? After the less profitable customers are identified, how can they be managed toward higher profitability? How can profiles of existing highly profitable customers be applied to attract new customers with similar characteristics? If each customer's value is not known, then the company is likely misallocating resources by underserving the more valuable customers, and vice versa.
To answer these questions, the company must first properly measure its level of customer profitability (or at least segments of customers).
To be competitive, a company must know its sources of profit and understand its cost structure. The CIO and IT organization must provide systems to facilitate this understanding. For outright unprofitable customers, a company should explore passive options of substantially raising prices or surcharging its customers for the extra services. In most cases, this establishes a "market-driven" value proposition between the company and the customer, resulting in either a profitable customer or intentional customer attrition by terminating the relationship. Remember, sending an unprofitable customer to your competitor isn't a bad thing. For profitable customers, increased profit margins can be accomplished by doing the following:
Manage each customer's costs-to-serve to a lower level.
Improve and streamline customer-facing processes, including adding self-service models where possible.
Establish a surcharge for or re-price expensive cost-to-serve activities.
Reduce services; focus first on labor-intensive ones that add the least value yet cost the most.
Introduce new products and service lines.
Raise prices.
Abandon products or service lines.
Improve and streamline internal business processes.
Offer the customer profit-positive service-level options with varying prices.
Increase investments on activities that a customer shows a preference for.
Up-sell or cross-sell the customer's purchase mix toward richer, higher-margin products and service lines.
Discount prices to gain more business with low cost-to-serve customers.
But to accomplish these actions, a company first needs fact-based data about its profits and costs. With this, management will have reliable cost information that can be used to build solid business cases for actions instead of relying on potentially risky intuition or hunches or, worse yet, flawed and misleading cost data.
Focusing on the most valuable and most "growable" customers in the short- and long-term can have a large impact on the bottom line. However, many marketing retention and acquisition programs indiscriminately address the entire base rather than effectively center on the more profitable customer segments. Having a way to value different types of customers is powerful for developing customer-centric strategies and subsequently determining what level of priority and effort to engage each customer segment.
The goal of marketing is to not only identify potential new customers, but to reach out to existing customers through cross-selling (e.g., When I sell you golf clubs, I try to sell you a golf glove) and up-selling (e.g., When I sell you a boat, I sell you an extended warranty option with it). Maximize the value of the relationships the company already has. This is referred to as "organic" growth.
Metrics to evaluate customers might include retention (loyalty) rates, attrition rates, churn propensity, and the marketing standard metrics trio of a customer's purchase history: recency, frequency, and monetary spend—or RFM. Indirect considerations can include a customer's referral propensity to recruit new customers. Of course, there is a myriad of other sociodemographic (e.g., age, income level, gender) and attitudinal variables that marketers analyze about their customers to understand their tastes and preferences. Analytical tools are becoming essential for marketers to formulate tailored marketing campaigns to the customer segments defined by their analysis. The CIO and IT organization must increasingly provide effective analytic tools for its user community for purposes like this.
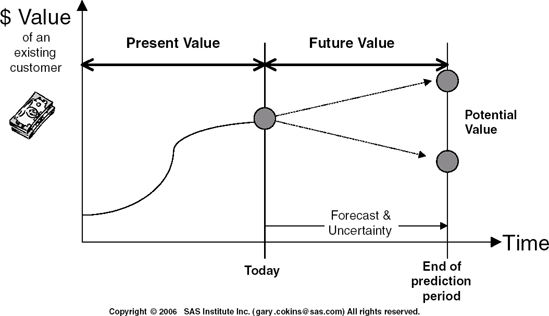
Exhibit 6.5 illustrates that just knowing the existing level of profitability for a customer may not always be sufficient. For some kinds of existing customers, such as a young promising dentist or imminent university graduate, their potential future profit as a customer is sizable. However, their current level of profitability does not reveal this. In contrast, for an established dentist near retirement, she may currently be a very profitable customer, but her longer-term value will not be substantial. Therefore, the future potential of a customer, measured along the horizontal axis in each image of Exhibit 6.5, should also be considered. Each quadrant in Exhibit 6.5 suggests different types of actions and treatments to take toward a type of customer to improve profitability.
Exhibit 6.5 also displays how the customer data points can be rankordered into a single customer financial value score based on each customer's distance from the upper-left corner, where the most valuable customers are located. The challenge is to determine the profit return on spending opportunities in order to shift customers to the upper-left corner to increase shareholder wealth.
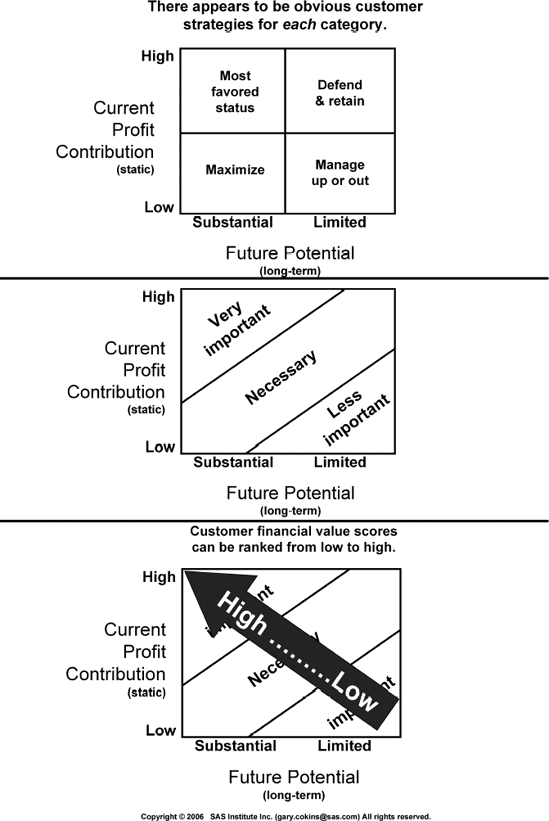
The more advanced-analytic organizations have become competent in measuring current period customer profitability—the vertical axis of Exhibit 6.5. The activity-based costing (ABC) methodology and its supporting technology provide the capability to trace and assign the unique consumption of cost that customers, channels, services, and products draw on the organization's resource expenses—their salaries, supplies, and so on. CIOs whose CFO has yet to pursue ABC need to investigate if the CFO's reason for not pursuing ABC is justified or simply due to the fear of too much extra work or some other misconception. Later this chapter discusses the challenge of locating customers along the horizontal axis—measuring the long-term potential financial value of a customer.
Knowing where customers are goes to the heart of customer relationship management systems. Decisions should be made considering the more valuable customers, not just the currently more profitable customers. These examples involve balancing current customer satisfaction with shareholder and owner wealth creation demands—and both involve tradeoffs among short-term and long-term decisions:
Achieving customer satisfaction and intimacy—Gaining customer loyalty is more than offering "bribes" with perpetual discounts. Loyalty must be earned, not bought.
So-called "loyalty" programs are typically just frequency programs lacking intimacy.
Increasing the company's profitability—How do we apportion our marketing spend between customer retention and new customer acquisition or recovery (i.e., win-backs)?
The sales and marketing functions increasingly require more financial information for trade-off analysis. Measuring customer lifetime value is an important source for financial information.
Customer Lifetime Value—Viewing Customers as an Investment
To consider the future profit potential of customers, marketing and sales functions have begun exploring an equation called "customer lifetime value" (CLV) that treats each customer (or segment) as an investment instrument— similar to an individual stock in a portfolio. There can be winners and losers. Because changes in customer behavior are usually not volatile, CLV can be useful to understand profit momentum. Unlike financial statement reporting, CLV measures are not interrupted by "one-time charges" and other short-term but substantial financial statement surprises. CLV links customer revenues to organizational profits. They should never be assumed to always go in the same direction because, as mentioned earlier, high-maintenance customers can be unprofitable regardless of their sales volume.
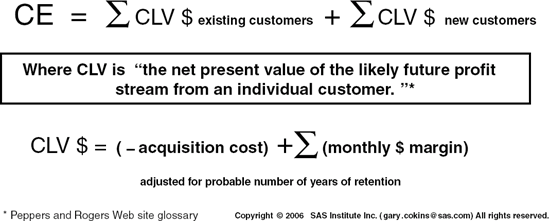
CLV is a forward-looking view of wealth creation. CLV can be defined as the net present value of the likely future net positive cash flow stream from an individual customer. This involves multi-period discounted cash flow (DCF) investment evaluation math, not just a single period. This math gets trickier than measuring historical customer profitability levels because the company needs to consider factors other than what happened in the past month, quarter, or year. CLV also considers the probability of losing some customers. By using DCF math, companies can equate the future stream of net positive cash flow (which are indirectly profits) into a single cash amount (i.e., the expected value) of profit stated in today's money.
One appeal of CLV is that it focuses on the customer as the influencer of a company's profitability rather than only the products and service lines that are purchased (although they are included in the CLV equation). Another appeal of CLV is it can also be applied to evaluate which new customers, not just existing ones, to target and attract through marketing campaigns, and more importantly, to determine how much the firm can afford to spend on acquiring new customers based on their CLV. Exhibit 6.6 illustrates some of the tactical actions mentioned earlier that a company may take to lift the profitability of a customer relative to the customer's current expected life cycle.
CLV synthesizes current level of customer profitability, future potential, and attrition probabilities at the level of an individual customer or household. Customers can exercise their rights to switch to from one supplier or service provider to another. A good example is in the telecommunications industry-cell phones in particular-where annual churn rates can be 30% of the customer base and the relative cost to acquire a new customer can be multiples of the cost to retain an existing one. Predictions of customer attrition are critical because that event terminates any further stream of revenues and associated costs. Industries such as in telecommunications and banking are becoming increasingly competent at developing survival curve models to predict attrition.
CLV can be implemented in multiple ways. It can be used as a customer segmentation tool to segment customer value. It can also be used to segment customers by their churn behavior (i.e., likelihood do terminate being a customer). CLV can also be used to measure marketing campaign effectiveness. For existing customers, CLV can help companies develop customer loyalty and treatment strategies to maximize customer economic value for the company's shareholders. For newly acquired customers, CLV can help companies develop strategies to grow the right type of customer.
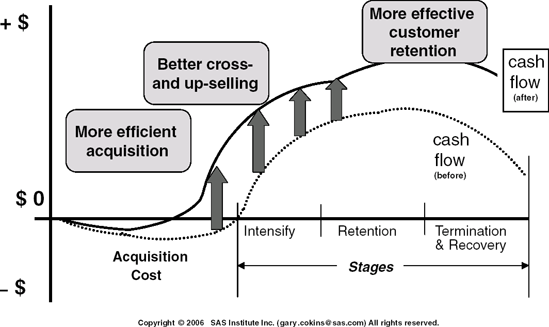
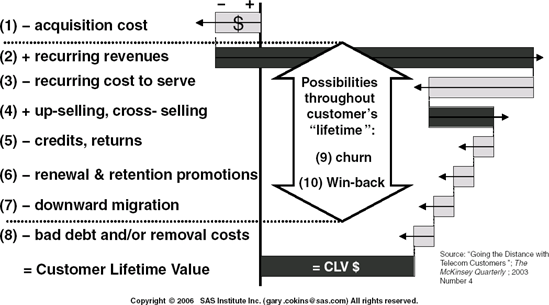
Exhibit 6.7 illustrates ten revenue and cost elements that determine the CLV of a customer segment over its lifetime. Ideally, the marketers tailor marketing campaigns and differentiated services and offers to assure this planned CLV of each segment is realized. Understanding the CLV of existing customers allows creating profiles, based on characteristics of customer segments, to attract similar types of new customers.
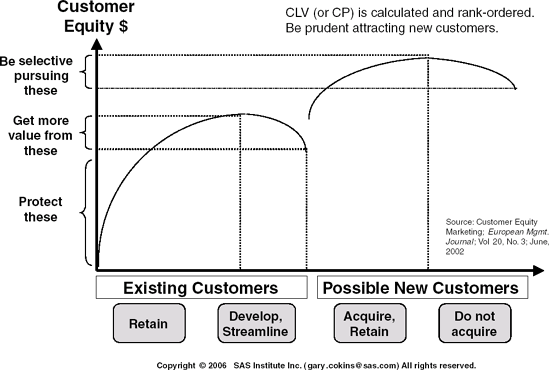
Exhibit 6.8 displays the cumulative CLV of all existing customers and potentially newly acquired ones. The exhibit illustrates actions and priorities reflecting decisions made for the ten elements in Exhibit 6.7. All customer segments should be managed for higher value, but the strategies will differ depending on the segment. The graph line is rank-ordered from the highest to lowest CLV customer. The most valuable customer segments should be protected—their retention being a high priority. Earning their loyalty is critical. Growing value from valuable customers comes next. The less valuable customer segments should be managed for higher returns. For new sales prospects, marketing can allocate appropriate budget to acquisition programs to attract customers with "clone" characteristics to valuable existing customers. The marketing budget spending should focus on higher payback rather than on potentially unprofitable sales prospects. In effect, just like a factory, work to achieve the highest profit yield for each incremental amount of spending in sales and marketing.
Exhibit 6.9 illustrates that calculating CLV involves assumptions and forecasts with uncertainty. Even with customers segmented, forecasting models can be quite sensitive to assumptions. For example, how long will an active customer continue the relationship? How much and when will an active customer spend? If a customer is inactive, is it temporary or did they switch to a competitor? If so, what and how much are they purchasing from a competitor? They may spend $100 with you, but $500 with your competitor. For these last two questions, a company only sees its own data, not external data, forcing it to make assumptions about the missing data. But that simply means the need to gain more competency in statistical forecasting. It is inevitable that to truly manage performance a shift in competencies will be from control to planning.
Customer value management (CVM) is becoming a buzzword among marketers and is based on CLV math. CVM is an acquisition and customer retention management approach geared to economic value creation for shareholders. As mentioned earlier, a challenging task is to locate customers along the horizontal axis in Exhibit 6.5—measuring the long-term potential financial value of a customer. This requires a mindset change to begin viewing a customer as an investment.
Similar to managing equity stocks in an investment portfolio, some types of customers may be big winners while others disappoint. In accounting and finance, evaluating investments requires calculating future streams of revenues and their associated costs. In contrast to calculating the profit from the past month, quarter, or year—a descriptive view—calculating projected financial returns involves discounted cash flow (DCF) math that considers both the timing of future cash inflows and outflows as well as the cost of capital. If the financial interest rate is 10 percent, then $1.10 a year from now equates to $1.00 today. Exhibit 6.10 displays an equation for computing a customer's value score as being the sum of the CLVs for both existing and future customers
There are some questions, challenges, and difficulties involved with computing CLV. For example, the CLV equation works assuming that the start time for measuring it begins with today. Given this, do you need to go back in time and determine what the historical acquisition cost was for existing customers? And how would you derive that amount? Or alternatively should you treat past acquisition costs as a sunk cost? Also, how should you assign retention-related expenses? How many periods into the future should be used because CLV is a discounted cash flow investment calculation, not a past period static one? The resolution to the confusion here is solved when you recognize there are different assumptions based on different questions.
The DCF of a customer's future purchases net of the costs to service the customer is synonymous with the term customer lifetime value (CLV). Calculating the DCF of a customer is not as complicated as one may imagine. Although Exhibit 6.11, an example of a DCF equation for measuring future customer value, may initially appear highly theoretical and intimidating, Exhibit 6.12 recasts key elements of the equation into a more comfortable spreadsheet view. The equations basically quantify the price less cost for the expected purchased volume of each product or standard service line less the cost-to-serve (including the cost-to-maintain). These costs are calculated for each customer (or more manageable for each customer segment), and then factored for probabilities.


Assumptions and forecasts with uncertainty are involved with calculating CLV. Even with customers segmented, forecasting models can be quite sensitive to assumptions for each segment. For example, how long will an active customer continue the relationship? How much and when will an active customer spend? If a customer is inactive, is it temporary or did they switch to a competitor? If they switched, what and how much are they purchasing from a competitor? They may spend $100 with you, but $500 with your competitor. For these last two questions, you only see your data, not external data, forcing you to make assumptions about missing data. But that simply means you need to gain more competency in statistical forecasting. It is inevitable that to truly manage performance, then a shift in competencies will be from control to better planning and forecasting.
In CLV calculations, the difficulty with determining the length of the proper planning horizon can be resolved by simply limiting it to only a few years—perhaps just three to five years. With DCF's "net present value", the impact of time on the "expected value" diminishes quickly.
I would not endorse starting off with elaborate CLV equations as in Exhibit 6.11. An organization can begin with simpler equations, using computer modeling, and use estimates for some of the elements in Exhibit 6.7. The benefits will be more in the organization's learning about how to view its customer segments and how to think about the probabilities for elements such as churn and win-backs.
Evaluating Customers by Combining Their Financial Value with Loyalty Characteristics
Knowing customer loyalty is important because the degree of loyalty directly influences the amount of spending that may be required to retain the customer as an existing customer. Advanced-analytics companies use business intelligence (BI) software technologies to understand psycho-demographic characteristics of customers to predict their future behavior. The CIO is often the catalyst to recognize the need for BI tools for purposes like these. It is not unusual for the customer analytics departments in companies with progressive BI tools to claim the accuracy of their customer "survival" (i.e., defections) projections is reliably high. They can almost predict by name which customer is likely to defect—the question remains, is it worth the extra cost to attempt to retain them? Are they worth it for the shareholders to benefit?
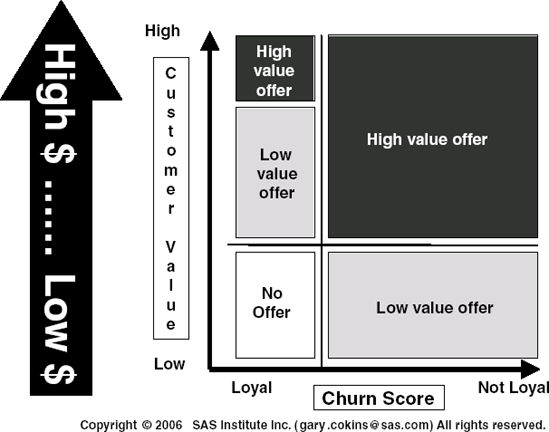
The lower portion of Exhibit 6.5 equated the two-axis data points of the upper and middle portions into a single customer financial value score in order to combine the customer financial value information with nonfinancial information about degrees of a customer's loyalty. Exhibit 6.13 places the high-to-low rank-ordered customer financial value score from the lower portion of Exhibit 6.5 on the vertical axis and combines it with a customer loyalty score on the horizontal axis. With both pieces of information reported about a customer, the location of that customer's intersection in the Exhibit 6.6 grid implies the level (and associated cost) of offering incentives, deals, discounts, and the like to retain the customer's ongoing revenue stream from their purchases. Less loyal customers will require, if deemed worth it to do so, relatively higher retention spending— and vice versa. The controllable variable becomes how much to spend.
How does the integration of customer financial value and loyalty translate into decisions and actions? Stepping back, companies must realize that the spending budget for sales and marketing is critical, but that spending must be treated as a preciously scarce resource to be aimed at generating the highest long-term profits. This means answering questions like, "Which type of customer is attractive to newly acquire, retain, grow, or win back? And which types are not?" Then, after identifying the valid types of customers to target (and rejecting those types to not target), "How much should we spend attracting, retaining, growing, or recovering each targeted customer segment?" The last question is the needed calculus that leads us to next point—maximizing shareholder wealth.
That last question includes determining how much sales and marketing spending is too much or too little. This is the first derivative of calculus— similar to what acceleration is to velocity. It is about the next increment of change—up or down. What impact do I get by spending an extra dollar or Euro on each customer or by reducing that planned spending by an extra dollar or Euro?
Exhibit 6.14 expands on Exhibit 6.13 by indicating that not only can there be various levels of marketing spending for each segment, but also that too much or too little spending can destroy shareholder wealth. The added graph on right side of the exhibit visually displays these trade-offs as an optimization problem intended to maximize shareholder wealth. Combining customer financial value scores with customer loyalty measures can determine the optimal level of marketing and sales retention spend for each customer cluster. However, today most senior managers treat customer intelligence analytics as a harmless curiosity in a permanent phase of development and trials. As a result, these senior managers wonder if their situation is "should we know?" or "do we know?" It is incumbent on the CIO to educate senior management that these types of analytics are increasingly being adopted and to avoid falling behind the competition who may get a head-start jump where they cannot be caught.
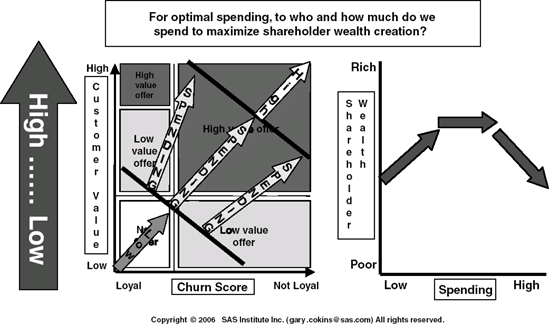
A company constantly interacts with its customers and their loyalty, both by actively pursuing them with new offers or deals and by passively assigning them to a customer segment that is entitled to a set of dormant offers— no actions or deals. How much is too much or too little? Excess spending can in some cases lead to shareholder wealth destruction. You can overspend on a customer to retain their loyalty, but potentially at a permanently lower (perhaps negative) long-term return on investment spending per customer. On the other hand, insufficient spending on a customer can also lead to shareholder wealth destruction. This is because the company risks losing that under-served customer to a competitor or risks its reduced spending frequency or amounts purchased, thus sacrificing the customer lifetime value for that customer.
Are there skeptics that CLV math is too much ivory tower? Of course there are. Even the academics have yet to deeply explore these interdependent relationships. Here is a quote from an academic journal:
Customer value management can be regarded as the key driver of Shareholder Value . . . (but) surprisingly, although being of obvious importance, literature taking a more comprehensive view of customer valuation has only recently been appearing. A composite picture of customers and investors is hardly found in business references.[63]
However, such skepticism may be unwarranted. For example, although survival analysis modeling (a component of CLV) appears challenging, more and more companies involved with subscription renewal customers are achieving competency with these projections. Further, the concept of integrating customer value and shareholder value is being addressed by the leading authorities in the field of customer relationship management, Don Peppers and Martha Rogers. Here is a quote from their 2005 book, Return on Customer :[64]
A higher promotion budget might improve customer acquisition. But each new acquisition will be more expensive. It's possible to wind up spending more than a new incremental(ly lower profit) customer will ever be worth.
Creating value from customers is an optimization problem. Often, however, the tradeoffs occur in terms of generating increased future cash flows with adverse results of reduced current cash flows, or vice-versa. . . . If CLV doesn't improve enough to offset increased costs, then value will be destroyed, even as loyalty improves.
By integrating customer relationship management with shareholder wealth creation and destruction, both of these topics are placed into the context of performance management.
CLV is understandably perceived as difficult to calculate with any degree of certainty. It is also perceived as hard to use. Hence, those managers who are cognizant that customers generate different profit levels relative to their sales typically only have confidence in a customer's current profitability—that is, if their accountants are measuring it—which most do not.
So is it feasible to measure CLV, and is it practical to try? For some companies, periodic customer profitability reporting with ABC can be a sufficiently good proxy or surrogate for the CLV measure. This could preclude any need to get more sophisticated. Others may see usefulness in calculating CLV, but wonder if the climb is worth the view—that is, will the benefits from using the data outweigh the administrative effort to collect and compute the data plus train employees how to use it?
Companies with ABC systems have proven they can repeatedly and reliably report and score customer profitability information. The benefits with actual customer profitability reporting come from the insights managers and analysts gain by comparing profiles of customers with varying degrees of profitability. This information alone, particularly for business-to-business (B2B) companies whose customers do not experience life cycles, may be sufficient to formulate new marketing strategies and to budget future marketing spending for higher payback.
CLV is more applicable when a company has a database with customer profiles and their transaction history data. That is, the company already knows a lot about them. CLV is less applicable if a company works through B2B sales channels that preclude a direct relationship, and hence intelligence, with end-consumers.
That is, it may be sufficient to simply begin with measuring current profitability for existing customers rather than advance to the more sophisticated CLV.
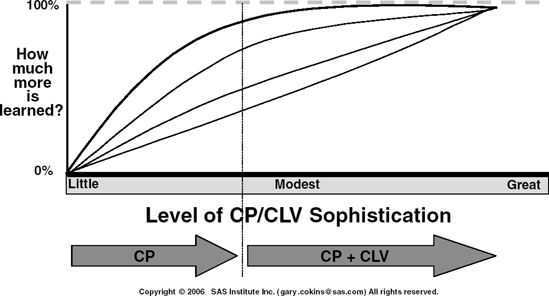
Exhibit 6.15 illustrates the rate of learning about a customer's value relative to the level of analytical sophistication. It implies that much can be learned just with measuring customer profitability and applying rankorders to formulating marketing strategies. Beyond that, adding CLV insights about future potential can add to the learning and enhance formulating even better marketing strategies.
Much can be learned just with measuring customer profitability and applying rank-orders to formulating marketing strategies. Beyond that, adding CLV insights about future potential can add to the learning and enhance formulating even better marketing strategies. There should be little argument, given the power of computers and data warehouses, that computing CLV with some degree of accuracy is feasible.
The CFO and CIO Must Serve the CMO and Sales Director
This discussion began by stating that senior management has had unquestioned views that marketing and advertising is something the company must spend money on—but how much money? How much is too much? Where is the highest payback to focus and where to avoid? It is inevitable that the answers to these questions require a contribution from the business analysts using managerial accounting techniques. The day is coming that the CFO, supported by the CIO, must now turn their attention from operations and cost control to support the CMO and sales director to more intelligently focus on the right kinds of customers and sales prospects.
The CIO faces challenges because there is confusion today about what the difference is between mainstream business intelligence[65] (BI) and performance management (PM). Are BI and PM synonymous? Is BI a part of PM? Or is PM a part of BI?
This ambiguity arises because the underlying inputs, processes, outputs, and outcomes of an organization—whether a public sector government agency or a commercial business—may arguably have some parts that belong to BI, while others belong to PM. The key word in that sentence was "arguably". This argument arises because IT-centric people often see an enterprise as a ravenous consumer of billions of bytes of data intended to manage the business (a BI view). In contrast, leaders, managers, and employee teams typically view the same enterprise as an organism with a purpose and mission (a PM view); they desire solutions and applications that achieve results. How can BI and PM be reconciled? It is important that CIOs assist their organizations in answering this question.
There are two things related to this topic that most people can agree upon: 1) BI involves raw data that must first be integrated from disparate source systems and then transformed into information; and 2) BI and PM leverage that information. In this context, information is much more valuable than data points, because integrating and transforming data using calculations and pattern discovery results in potentially meaningful information that can be used for decisions. The key point here is to apply analytics with BI and PM for better decision making. For example, an automobile manufacturer's warranty claims can be globally analyzed to detect a design problem. In another instance, the history of an individual's credit card purchase transaction data can be converted to information that, in turn, can be used for decisions by retailers to better serve the customer or provide customized offers to sell more to them.
A survey by the global technology consulting firm Accenture reported that senior U.S. executives are increasingly more disenchanted with their analytic and BI capabilities.[66] Although they acknowledged that their BI (regardless of how they personally define it) provides a display of data in terms of reporting, querying, searching, and visual dashboards, they felt their mainstream BI still fell short. An organization's interest is not just to monitor the dials; it is, more importantly, to move the dials. That is, just reporting information does not equate to managing for better results; what is needed are actions and decisions to improve the organization's performance. Having mainstream BI capability is definitely important, however, it often came about as the result of departments needing advances that the IT function could not provide. Extending BI across the organization so that mini-BI applications can talk is a mission-critical differentiator for organizational success and competitiveness. Some organizations refer to this extension as "big BI" to emphasize the importance of using analytic analysis with BI information and the portfolio of methodologies that comprise performance management.
Professor Tom Davenport of Babson College authored a January, 2006 Harvard Business Review article proposing that the next differentiator for competitive advantage will be predictive analytics. He has coined the phrase, "competing on analytics." His premise is that change at all levels has accelerated so much that reacting after-the-fact is too late and risky. He asserts that organizations must anticipate change to be pro-active rather than reactive, and the primary way is through robust quantitative analysis that is forward-looking.
Predictive analytics becomes an obvious feature for BI and performance management to help an organization understand where it has been and why, and then to determine strategy-aligned actions for decision-making with realistic target-setting.
Managing and improving are not the same things. Many people are managers, like a coach of a sports team, and they get by. Improving, on the other hand, is how an organization wins. To differentiate BI from PM, performance management can be viewed as deploying the power of BI, but the two are inseparable. Think of PM as an application of BI. PM adds context and direction for BI. BI is an enterprise information platform for querying, reporting, and much more, which when combined with the methodologies of performance management makes them both the foundation to drive organizational improvement with analytics. PM drives the strategy and leverages all of the processes, methodologies, metrics, and systems that monitor, manage, and most importantly, improve enterprise performance. Together, BI and PM form the bridge that connects data to decisions when powered by analytics.
With PM, the strategy spurs the application of technology, methodologies, and software. As methodologies—which are typically implemented or operated in isolation of each other—are integrated, the strength and power of PM grows. Technologies, such as software that the CIO is responsible for installing, support the methodologies. Software is an essential enabler, but the critical part is in the thinking. That is, one must understand the assumptions used in configuring commercial software and, more importantly, have a vision of the emerging possibilities to apply the new knowledge that BI and PM produces.
Ultimately it is advisable that organizations not waste valuable energy debating BI versus PM—they may get caught up in semantics—and agree that PM deploys the power in BI with its enterprise information platform so that organizations can advance from managing to improving.
To maximize shareholder wealth, the company must dig much deeper than predicting income statements and balance sheets to compute "free cash flow" as the financial community does today. They must look at CLV and return-on-customer concepts as the core determinant (i.e., driver) of shareholder wealth creation, combined with these other factors—customers. CVM is a "bottom-up" rather than a "top-down" calculation. In summary, it is essential to have the analytical tools, such as for customer segmentation, loyalty analysis, forecasting, and activity-based costing for calculating customer value, reducing internal debates, and making tradeoff decisions. It is inevitable that a company's executive team will navigate shareholder wealth creation based on facts, not hunches and intuition.
APPENDIX 6A. Activity-Based Costing Is a Cost Reassignment Network
In complex support-intensive organizations, there can be a substantial chain of indirect activities prior to the work activities that eventually trace into the final cost objects. These chains result in activity-to-activity assignments, and they rely on intermediate activity drivers in the same way that final cost objects rely on activity drivers to reassign costs into them based on their diversity and variation.

The direct costing of indirect costs is no longer, as it was in the past, an insurmountable problem given the existence of integrated ABC/M software, like the SAS Institute's SAS ABM software. ABC allows intermediate direct costing to a local process or to an internal customer or required component that is causing the demand for work. ABC cost flow networks no longer have to "hit the wall" from limited spreadsheet software that is restricted by columns-to-rows math. ABC/M software is arterial in design. Eventually via this expense assignment and tracing network, ABC reassigns 100 percent of the costs into the final products, service lines, channels, customers, and business sustaining costs. In short, ABC connects customers to the unique resources they consume—and in proportion to their consumption.
The ABC cost assignment network in Exhibit 6.A consists of the three modules connected by cost assignment paths. This network calculates the cost of cost objects (e.g., outputs, product lines, service lines, or customers). It is basically a "snap-shot" view of the business conducted during a specific time period. (Life cycle costing is described under the topic, "Customer Lifetime Value".)
Resources, at the top of the cost assignment network, are the capacity to perform work because they represent all the available means upon which work activities can draw. Resources can be thought of as the organization's checkbook; this is where all the period's expenditure transactions are accumulated into buckets of spending. Examples of resources are salaries, operating supplies, or electrical power. These are the period's cash outlays and amortized cash outlays, such as for depreciation, from a prior period. It is during this step that the applicable resource drivers are developed as the mechanism to convey resource costs to the activity.
"Expenses" must be distinguished from "costs". They are not the same thing. All costs are calculated costs. It is important to recognize that assumptions are always involved in the conversion and translation of expenses into costs. The assumptions stipulate the basis for the calculation. Expenses occur at the point of acquisition with third parties, including employee wages. This is when money (or its obligation) exits the company. At that special moment, "value" does not fluctuate; it is permanently recorded as part of a legal exchange. From the expenses, all costs are calculated representations of how those expenses flow through work activities and into outputs of work.
In sum, resources are traced to work activities. It is during this step that the applicable resource drivers are developed as the mechanism to convey resource expenses into the activity costs.
A popular basis for tracing or assigning resource expenses is the time (e.g., number of minutes) that people or equipment use to perform activities. Note that the terms tracing or assigning are preferable to the term allocation. This is because many people associate the allocation with a redistribution of costs that have little to no correlation between source and destinations; hence to some organizations overhead cost allocations are felt to be arbitrary and are viewed cynically.
The activity module is where work is performed. It is where resources are converted into some type of output. The activity cost assignment step contains the structure to assign activity costs to cost objects (or to other activities), utilizing activity drivers as the mechanism to accomplish this assignment.
Cost objects, at the bottom of the cost assignment network, represent the broad variety of outputs and services where costs accumulate. The customers are the final-final cost objects; their existence ultimately creates the need for a cost structure in the first place. Cost objects are the persons or things that benefit from incurring work activities. Examples of cost objects are products, service lines, distribution channels, customers, and outputs of internal processes. Cost objects can be thought of as the what or for whom work is done.
Once established, the cost assignment network is useful in determining how the diversity and variation of things, such as different products or various types of customers, can be detected and translated into how they uniquely consume the activity costs that draw on resource expenses.
[61] Peter F. Mathias and Noel Capon, "Managing Strategic Customer Relationships as Assets," Velocity 5 no. 2 (1st quarter, 2003): 46.
[62] Don Peppers and Martha Rogers, Ph.D., Return on Customer: Creating Maximum Value from Your Scarcest Resource, (New York: Currency/DoubleDay, 2005) 9. Return on Customers and ROC are registered service marks of Peppers & Rogers Group, a division of Carlson Marketing Group.
[63] Bayon, Gutsche, and Bauer, "Customer Equity Marketing," European Management Journal (June 2002) 213.
[64] See note 2 above, pages 12-13.
[65] The information technology community distinguishes between "little" business intelligence for query and reporting and "big" business intelligence for the platform where information is stored and managed. This chapter's emphasis is on the latter.
[66] Accenture.com, 2005 News Release; "Companies Need to Improve Business Intelligence Capabilities to Drive Growth, Accenture Study Finds" www.accenture.com/xd/xd.asp?it=enweb&xd=_dyn%5Cdynamicpressrelease_809.xml.