If one were to ask symphony patrons and symphony professionals what section of instruments in an orchestra is the most important, the answer would surely be all of them. Composers utilize every section and every instrument when writing symphonies. Symphony orchestras have steadily changed since they first appeared in ancient Egypt, and the role of every instrument has evolved over time. The end game for a conductor is to get all the sections to perform in harmony. Performing without a section of instruments leaves a gap that cannot be hidden.
Posing the same question to IT customers and IT professionals, pick the most important part of IT—pick the one process, one section of infrastructure, or the one department that stands out as the most strategic piece of IT—what would be your answer? Does IT have one most important strategic piece? If one asked this question of industry vendors and analysts, their answer would invariably be the product or service they sell. If one asks CIOs this question, the answers depend upon the state of IT maturity, the most pressing need of the day, and the state of the business where they work.
The SAS cut-to-the-chase answer is this: None of the pieces are strategic by themselves. None. IT has too many parts. Often organizations gather these parts into technology stovepipes and manage them accordingly. Technology stovepipes lead to incoherence and disharmony within and outside of IT. IT Finance is often just another stovepipe within a stovepipe. Reporting the cost of service without including the results of the service is an example of a stovepipe telling only part of the story, one section playing in isolation. Conversely, reporting service results without the corresponding cost and value is also only part of the story. No single stovepipe can reveal the sum of the parts of IT. To understand why, let's extend the symphony analogy to help cut through the abstractness and complexity that is IT.
Because symphony orchestras are not created equal, consider the situation of a poorly conducted, overburdened, large city, symphony orchestra. Due to budget constraints, the symphony has to settle for young, inexperienced musicians to replace departing musicians. To compensate for their shortcomings and develop these new musicians, the orchestra consumes most of its rehearsal time training and correcting mistakes. To increase efficiency, the orchestra sections rehearse individually until they each become proficient. As a result the sections have difficulty finding the time to play together as a full orchestra—the case of the Silo Orchestra. The score calls for the orchestra to play in harmony. Individual sections cannot carry an entire symphony nor can they practice in isolation and then perform in public with perfect harmony.
It comes as no surprise to hear that in past seasons the public performances of this orchestra were poorly played. Patrons became frustrated. Reputations suffered. Funding declined. As an institution, the orchestra was left with a foundation of poorly played symphonies, declining public support, and declining musician morale. Still, the demand for classical music remained high. The community depended on the symphony for a portion of its identity and an indication of the city's prominence among the communities of the world.
With the competition orchestras face from other sources of classical music, expectations for Silo Orchestra performances rise higher and higher. In today's musical world now so heavily dependent on technology, patrons constantly compare one orchestra's performances to other orchestras' recordings, performances broadcast from other cities with digital sound, and performances captured on DVDs played over home theater systems. The lack of quality compared to competition quickly becomes very apparent to Silo Orchestra patrons.
To turn this orchestra around, how might its leadership approach learning a new repertoire and building the orchestra at the same time? Or, more to the point, how does this analogy apply to IT? How does IT learn a new season's repertoire and build the orchestra to world-class caliber at the same time? IT organizations face the same dilemma as the orchestra. (1) Learn new business "symphonies" (applications) every year with higher expectations than the year before. (2) Learn to build a better orchestra (IT staff). (3) Relearn the old, badly played symphonies. All at the same time.
Like Silo Orchestra, many IT organizations have various stovepipes playing and rehearsing in isolation to gain efficiencies. Like the orchestra, the IT stovepipes are organized by sections. Woodwinds over here, UNIX over there, Finance in here. Although it is cheaper and more effective to have experts in one technology than generalists who must have skills across several technologies, IT organizations that depend on generalists often lose view of the symphony. This leaves an IT organization where no one plays a strategic role and without any way to bring all the stovepipes together to play from the same score. Stovepiping is the classic misalignment conundrum: Each might do good work in isolation, but how can the CIO tell if the right part is being played correctly, much less harmoniously and strategically?
The enterprise pays IT to play the symphony of business applications. Like the orchestra, IT's sections must play harmoniously together to deliver strategic value. Best practice CIOs know that none of the IT organization's parts can function strategically unless IT functions in strategic unison as a whole. This chapter examines the strategic role of IT Finance by emphasizing that IT Finance cannot be strategic by itself. Finance must be joined with other IT governance and processes to develop symphonic capabilities and work together in harmony with enterprise strategy.
SAS published an IT Governance maturity model depicted in Exhibit 4.1. This model reflects the approach most IT organizations use to gain process maturity and incorporates the best of IT thought leadership. However, most current research and surveys indicate that IT maturity still lags despite a recent emphasis on process management. This particular process model advocates that all IT organizations build from the bottom up in sequential steps and not skip any steps along the way. The model is a practical, stepby- step maturity process.

The main premise here is that the CIO must build IT organization maturity and business value on top of a solid, predictable infrastructure. We at SAS and our IT customers agree with this premise. So would our friends in the symphony orchestra. IT begins to part ways with the orchestra as the other dimensions of IT maturity add complexity to the problem of maturing IT and adding business value. An example of complexity is the implementation of process management to move from stabilization to business alignment. One such process management framework is the IT Infrastructure Library (ITIL). ITIL is gaining rapid acceptance in the United States after an excellent track record in Europe. Another source of complexity is the extensive automation required for IT operations and management. Orchestras do not need to trade in their violins every other year for a newer, more powerful, more capable, more musical violin.
Just how far along the maturity index have most IT organizations developed? According to a Gartner survey of CIOs in 2005, only 12 percent of those interviewed had attained Level 3 of service—Value on the Gartner IT Management Process Model.[28] Twelve percent! Yet 42 percent wanted to be at Level 3 by the end of 2007. Why the lack of progress? Why are so many IT organizations hovering around Stabilization? The answer reflects another key difference between an orchestra and IT. Symphony orchestras have been in existence for centuries. Hundreds of years of experience have resulted in knowledge and a foundation of traditions that provide a path toward excellence for classical music. IT, on the other hand, has been in existence for only several decades. During that time, technology has grown so rapidly and the application of the technology has been so diverse, that IT management practices lag far behind.
Given that IT management lags behind the technology that IT organizations provide to their enterprises, the reasons why processes fail to rapidly mature should come as no surprise. The same CIOs state that they encounter difficulties in accelerating IT development:
Upper management support
Practical implementation guidelines
Time to develop a thoughtful approach
Hierarchical reporting structure
Effective organizational communication
These shortcomings indicate that IT organizational processes are often mired in technology-centric management environments that make it difficult to communicate problems, results, and issues either to peers managing different technologies or to upper management. The CIOs also point to a chaotic/reactive maturity environment where they spend time reacting to problems rather than preventing them. Because putting out fires consumes more time than preventing them, IT never finds the time to develop an approach to bring the organization to a higher maturity level.
Mixed messages compound the problem. Alongside SAS's IT maturity governance model, other writers give a different message about how IT should think and behave. They suggest that IT should provide immediate business value by implementing the applications and technology needed to compete in a global economy. Who can argue with that? But they assume that the enterprise architecture is as stable as the best practices discussed in Chapter 2—often an invalid assumption.
Notice that the very last stage within the maturity model is IT Governance and Business Alignment. After all the other steps are completed, IT begins to deploy the technology, processes, and applications to solve business problems and enable business strategy. By contrast, Silo Orchestra must learn new symphonies for the coming season of high expectations while rebuilding. The orchestra can't skip a season of performances any more than IT can put a year-long moratorium on new business applications. Nor can either the orchestra or the IT organization implement new performances on an unstable platform.
This chapter of CIO Best Practices is about Strategic IT Finance. This section begins to discuss the role that Strategic IT Finance plays within IT. Without a strategic framework for IT and IT Finance, no part of IT can play a harmonious strategic role. Strategic alignment lies at the heart of the issues preventing IT maturity and growth. A strategy that provides practical implementation and thoughtful guidelines, allows IT to overcome matrix organizational reporting, and supplies effective communication across IT and to IT's business partners, gives senior management the necessary resources to support the transformational development of IT.
Strategic Performance Management (SPM) pulls all the parts together into a two-pronged approach that simultaneously enables IT to (1) engineer internal maturity and (2) play new application symphonies for the business. This SPM model follows a Balanced Scorecard approach to manage the two-pronged approach and measure the results. The two prongs enable IT to connect new business applications to IT processes with a Top-Down strategy and build internal engineering and processes simultaneously following the SAS model stages of IT readiness. The Top-Down prong concentrates on defining, implementing, and measuring the IT-enabled value of new business applications. Or, putting it another way, the Top-Down prong focuses on capital expenditures. The Bottom-Up prong deals solely with applications already implemented. Most companies would consider this to be expense. In a nutshell, the mixed messages that prompt IT organizations to work beyond their current level of maturity are encapsulated in capital investment versus expense. IT Finance guides both prongs.
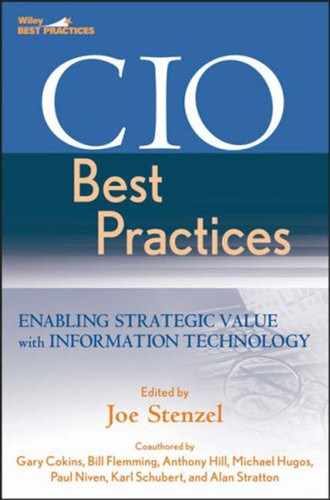
Balanced Scorecards use four perspectives in the top or "executive" scorecard (see Chapter 5 for a detailed discussion of using the Balanced Scorecard for IT performance management). Each perspective contains initiatives that drive the two-pronged IT Finance strategy in Exhibit 4.1. The format of the perspectives neatly corresponds to the IT world and, for IT Finance, outlines the role that Finance plays in orchestrating business strategy. Exhibit 4.2 shows the four perspectives and corresponding initiatives for an IT organization. The perspectives are divided into those that face the external environment to follow investment and customers and those that face internally into IT operations and concentrate on expense management. Customer Performance Optimization provides the strategic performance guidance that allows the IT organization to align with its customers. Financial Performance Optimization strategically guides IT Finance to improve financial management internally and externally and illuminate IT's financial performance managing customer business applications. Learning and Growth concentrates on the processes (ITIL) that IT must put in place to build maturity. Resource and Service Optimization characterizes the internal engineering required to build the maturity foundation. In an undertaking as large as guiding and managing IT maturity, the need for tools and automation that bridge the individual stovepipes is fundamental.
The SPM model groups each Executive Level perspective into an "optimization suite". Each suite contains tools and initiatives that encompass each maturity level while building the new application repertoire. Each suite works like an orchestra section with its own specific role to play. While they may play a solo from time to time, the purpose of the suites is to strategically play the business symphonies in harmonious unison. A well-thought-out plan appears concise on the executive level. A wellthought- out plan also abstracts several layers of complexity. To understand the role of IT Finance within the Financial Performance Optimization perspective requires a basic understanding of the other suites and initiatives. Following the SPM model, this discussion begins with a general overview and then uses strategy maps to illustrate the role of IT Finance. (For more information on IT organization strategy map development see Chapter 5, pg. 208–210.)
On the expense prong, the Resource Optimization arm of the Resource and Service Optimization perspective delivers infrastructure stability and predictability, places the right infrastructure capacity at the right place at the right time, forecasts seasonal and business metric saturation points, preempts threshold violations, and creates business metrics. In other words, it helps move IT from stabilization to resource optimization on the maturity scale. Resource Optimization does not, however, measure negotiated service-level agreements.
Service Optimization negotiates business application service-level agreements and costs. Because service-level agreements here are expressed in terms of Availability/Response/Throughput, the agreements for each business application greatly depend on how well Resource Optimization measures manage capacity and exceptions. Service Optimization does not measure the effectiveness of capacity forecasting or measure the cost of providing the service.
Financial Optimization measures the financial results of the other optimization perspectives plus a few other areas. Here, IT Finance folds into IT strategy and enables the sections to play together symphonically. For purposes of this chapter, Financial Optimization focuses on three key areas: (1) Cost of Business Application Service; (2) Cost of ITIL; and (3) Cost of Infrastructure Capacity. Each of these merges with appropriate results from other optimization suites to give a strategic view of the results.
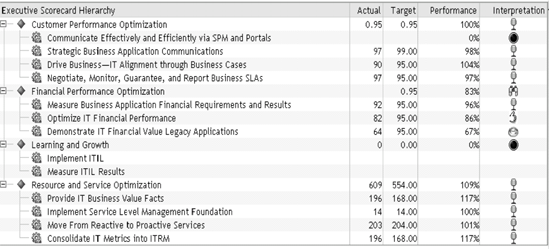
Any well-considered, well-managed plan consistent with the complexity of ascending IT maturity indices must set an execution order to the initiatives mandated by the strategy. Similar to PERT charts in project management, strategy maps depict the critical path and relationships between the initiatives. As the strategy is deployed, the strategy map helps identify whether the performance goals are met. Key initiatives that fall behind in attaining goals or targets delay strategic execution.
Guiding IT maturity development while learning new applications is a complicated undertaking that requires a strategy map with two separate views. First, Exhibit 4.3 shows the Bottom-Up view of the SAS Governance model; Exhibit 4.4 shows the Top-Down new business application view.
Any chaotic, failure-prone IT hardware and software infrastructure is a recipe for poorly played symphonies and the reputations that follow. Accordingly, the first order of business is to put an end to the infrastructure failures. The CIO cannot forecast capacity, define business services, or show attractive financial results while the IT organization works in a reactive stage of maturity. Not only is firefighting financially expensive, it also carries the opportunity cost of preventing both IT growth and adding value to IT customers.
Resource Optimization is the foundation, which once built, moves ITfrom reactive to proactive/capacity management. Resource Optimizationis also the foundation for Top-Down efforts. It is the lead goose. All otherinitiatives follow its lead. The first step on this journey begins by harvestingand consolidating all the necessary IT infrastructure metrics into a Performance Data Warehouse. Scrubbing and transforming IT metrics fromthe isolated technology stovepipes is the key technology layer. A pristine Performance Data Warehouse serves many purposes including providing key metrics for IT Finance—metrics used on a daily basis. Metrics are also stored on a long-term basis allowing a series of strong and vital initiatives to use the baseline data.
A fundamental component in stabilizing the infrastructure is setting performance thresholds and generating exception reporting (this discussion does not cover the ITIL processes that also play a key role in stabilization, proactive management, or service levels). Catching potential performance degradation indicators (including cost) before performance falls allows the IT organization to mature from the developmental stage of a reactive to a preventative workforce.
The metrics used to prevent performance malfunctions and stabilize the infrastructure also enable the next maturity step to be taken. Forecasting capacity and providing service-level agreements means engineering the raw consumption metrics into business workloads. The basic measures of CPU, memory, and queues stabilize the infrastructure. Use the same data to answer what is consuming CPU and memory over time, at peak seasons, around business-driven growth, and through abnormalities, allowing the application of forecasting tools to predict capacity needs in terms of business needs. Also use the same data to measure cost so that cost can be part of the performance evaluation.
Forecasting and managing capacity is a key step toward providing mature services to IT patrons. In efficient fashion, Resource Optimization uses its metric foundation to stabilize performance and forecast and manage capacity. Even more economically, the Performance Data Warehouse uses actual business workloads to calculate the performance and cost of service-level agreements. In some capacity configurations, more advanced capacity costing tools illuminate the true cost of peak capacity provisioning decisions, discussed in greater detail later in this chapter.
The strategic role of Financial Optimization in IT maturity initiatives is to provide financial insight into resource and service optimization and legacy applications. The financial insight required transcends far beyond traditional budgeting or departmental views of financial performance. Financial Optimization strategy determines the costs of capacity, services, and legacy applications with transparency into the cost elements. Expressed another way, Financial Optimization, IT Finance's new role, must create cost models that have all the sections of the IT organization as cost elements: people, processes, and infrastructure expressed in cost objects of business service, processes, and IT customers. IT Finance must illuminate the internal engineering.
Because a single strategy of building from the bottom to attain the highest stage of IT maturity would, in the end, create an endless cycle of retrofitting the stream of new business applications back up the maturity index, IT must also implement new business symphonies while engaging in maturity engineering. Rather than wait, the best practice CIO begins a parallel set of customer-facing initiatives that capture business cases and service requirements. Doing so implements the new applications with the business value already defined.

The Top-Down strategy prong concentrates on the Customer Performance and Financial perspectives of the Executive Scorecard, assuming that IT has progressed from the bottom sufficiently to provide the necessary infrastructure metrics prior to new application implementation. As in the Bottom- Up portion of the strategy, a single initiative precedes the other initiatives—Driving Business IT Alignment through Business Cases. The proper use of business cases, automated or otherwise, details the business objectives, IT automation requirements, IT financial requirements, service requirements, and volume forecasts.
Gathering the business case data establishes the value of applications, how much the customer is willing to pay for the service, the service parameters, and the basis for calculating capacity forecasts. While business case review is critical before implementation, the business case also provides the basis for ongoing financial review over the life of the service. Conditions rarely remain the same for very long. The business case provides the context for its lifelong review. Major enhancements deserve appropriate scrutiny and review lest they drift out of the parameters originally envisioned.
IT Finance takes responsibility for creating the models to measure the cost of the service, cost of capacity, and the cost of IT processes. Reporting back to the customer is the art of the symphony. Cost of service and the results of the service and cost of capacity with the accuracy of the forecast each surface the good and bad cost elements that IT Finance must orchestrate to create a symphony of strategically harmonious customer-related information that supports decision making.
To ease into a discussion of the heart of IT Finance best practices and the role Activity-Based Costing can play, let's look at the crucial relationship between IT Finance and service-level agreements (SLAs). In this discussion, SLAs are the IT organization's product for its business customers. SLAs define the performance requirements of each business application.
SLA performance requirements can be quite granular, extending down to individual processes and to the time of day. In addition, properly defined SLAs determine the value the business places on the application by setting forth how they are willing to pay for the performance requirements of the application. Measuring the financial performance of SLAs is as important as measuring other facets of SLA performance (expressed in terms of Availability/Response Time/Throughput or A/R/T).
Many IT organizations struggle to define and implement SLAs, but in reality they struggle to reverse-engineer legacy applications into SLAs. Here IT Finance and Service Management clearly falls on the expense side. Creating "operating" service-level agreements where IT measures A/R/T while determining SLA operating costs establishes a baseline that pays dividends when IT helps the enterprise create business cases to assess whether to keep, enhance, or replace aging applications. Financial review applies equally to new business cases and older, legacy services. With new capitalexpenditures for new business applications, the Top-Down prong predefines the SLA requirements. Taken together, new and legacy SLAs become the essential IT Finance measurement and a key ingredient in the discussion that follows.
Finance has a split personality with its two primary roles in the enterprise. The first is a traditional role as the funds custodian. This custodial role includes financial responsibility for enterprise resources. Custody also includes appropriate internal controls and financial transparency required by law and by stakeholders. However, more important to strategic IT management is the second role, that of business partner, or fellow musician playing in unison with other employees in the harmonious interpretation of the same strategic score.
All organizations look to finance when operations are expressed in monetary terms. Traditionally, cost, associated revenue, and profit have been the sole monetary picture of operations. However, these traditional pictures have been expressed in external reporting terms such as GL account costs by organizational department or in total. These traditional pictures have not leveraged Finance's specialized skills and training to provide financial information more directly useful to operations. Often, the information is not supplied in the context of the underlying operations. Because costs are always the result of operating capacity decisions and process results, understanding cost requires the operating context.
Historical costs are always a lagging indicator of operating results. Transforming cost into a leading indicator involves more careful understanding of the underlying operating relationships. This transformation takes more effort than a historical cost analysis, but it is worth the effort when insightful advance decisions prevent waste and inappropriate resource deployment.
As the CIO seeks to improve IT's part in the symphonic performance, IT Finance's instruments must illuminate the financial results of IT's initiatives to become more mature as an organization and provide immediate business value. Advancing the maturity of the IT organization and immediate business value of the IT strategy spell out the methods and IT Finance's role in each strategic prong of Exhibit 4.1. Finance provides a common measure for all sections of the IT orchestra. Financial measures help to blend and optimize the various sections for a performance worthy of the IT players.
For the moment, assume that the CIO manages the IT organization as an enterprise separate from those business units consuming its services. The resulting perspective is illuminating. It brings the Top-Down strategy to the forefront: If IT services are being purchased, what does the customer expect from IT? What would IT as a supplier provide? The customer would expect:
Consistent service delivery as specified in contract
Consistent quality
A competitive price
As an external supplier, IT would provide:
Adequate capacity to assure consistent service delivery as required by contract
Robust processes to provide consistent service
Invoices with prices and supporting documentation of services provided
In this arm's length environment, the price that the customer is willing to pay would be based on perceived business value and a benchmark of prices and services offered by other IT suppliers.
The customer is willing to pay for what their business consumes but not for waste or excess capacity. Excesses are not allowed to inflate the price. If the price is too high, the customer finds other alternatives. It is critical to note that for a profit-oriented IT provider the cost to provide the service does not establish the price. Independently, market conditions set prices. The profit to be realized drives the supplier's desire and willingness to provide the service. Profit equals revenue minus cost. For a high enough price, an IT service provider purchases whatever capacity it needs in order to make a profit. When prices are too low, IT service providers redeploy resources to a more profitable market and potentially stop offering the service. If profitability is low, IT service providers are highly motivated to improve the efficiency of their operations. If profitability is too low, the service provider leaves the business.
An external customer wants assurance of the supplier's ongoing ability to provide services. Part of this evaluation is the supplier's financial stability— an issue totally separate from adequate detail behind invoices for services rendered. As an external supplier, IT would not provide complete financial transparency of its operations to its customers. This financial information would be highly protected; provide only publicly available summaries. The IT service provider would not open its financial records. At most, it offers customers only enough exposure into its operations to assure them that they have the capability and quality to provide the services being requested.
What is the difference for IT's business customers when IT is not external to the organization but works inside the organization? In most circumstances, internal customers cannot switch to an external IT service provider.
As an internal supplier, IT typically cannot sell services and capacity to other customers outside of the parent organization. Should the internal customer expect any less consistent service delivery or quality? Should internal IT provide less than adequate capacity to assure consistent service delivery or consistent quality? Should customers now be expected to pay for waste and inefficient operations? Should customers now expect unlimited capacity and unlimited services for free? NO to all these questions!
The best practice CIO changes IT's ability to work more closely with its internal customers to meet the company's overall strategic objectives. In other words, provide immediate IT business value and implement those IT-enabled solutions on a stable architecture supported by mature processes (see Chapter 3). When part of the same enterprise, IT and its customers are more closely yoked together and should be driving to a common fortune.
As a consequence of Enron and other accountancy-related trials, financial transparency is now a common battle cry. What does this mean to IT and its internal customers? First, what it does not mean is a dump of every possible bit of information on the customers' desks. What it does mean is providing accurate and appropriate information relevant to strategic decision making and backed up with additional detail if desired. Together with a foundation of sound internal financial management, this is the financial transparency internal IT customers seek. Financial transparency should enable (1) self-regulation to adjust and fine-tune behavior and (2) strategic operational choices. Financial transparency does not mean computing figures four, eight, or twelve digits to the right of the decimal point. Financial transparency that enables greater enterprise-wide maturity means providing figures that are relevant and accurate for the decisions being made whether measuring the value delivered to IT's customers or guiding IT's own maturation process.
In an internal IT environment, billing internal customers for services is a separate consideration from knowing and sharing the cost of services rendered. An actual billing for services is a choice, not a requirement. However, knowing and communicating the cost of services is essential for the CIO and the IT organization because it contributes to forming and fine-tuning strategy and optimizing operational resources. For internal customers, it helps them make appropriate choices concerning the mix and quantities of services they consume. Without understanding the cost of a service, customers naturally want the Cadillac version. Knowing the cost enables them to choose the service level adequate to their actual needs. The bottom line is that reports to internal customers give the CIO and the IT organization an opportunity to communicate in clear business terms with transparency to cost elements.
Traditional financial tools crafted generations ago provide little help for IT Finance to play a strategic role. Limited to these tools, IT Finance cannot identify the strategic symphonic themes IT needs to play, let alone participate in the performance. Fortunately, new tools have become available.
Activity-Based Cost and Management (ABC/M) is a recently developed set of methodologies and tools that provide management analysis to aid in decision making. Cost is a direct result of operating decisions, and therefore a measure of performance. Rising or declining costs are symptoms of resource decisions and utilization. ABC/M is primarily a symptom diagnostic tool that provides cost information for more strategic management decisions. Coupling cost with other strategic performance metrics results in a complete picture of operating results and value. This complete picture provides the decision illumination that management needs.
Before describing how ABC/M assists IT decision making, familiarity with a few ABC/M basics immediately suggests how this tool is superior to traditional methods. If you are already familiar with ABC/M, please read the next section anyway and look for the nuances of its application to the IT environment. First, there are a couple of things that ABC/M is not.
ABC/M is not a transaction recording tool like more familiar financial transaction instruments such as Accounts Payable, Asset tracking, and the General Ledger. As an analytical tool, ABC/M uses summarized information provided by these transactional tools to provide decision grade information for management decisions.
ABC/M is not the General Ledger (GL). The GL has other important purposes in the custodial role of finance that center on external reporting and internal controls. It has its own highly controlled environment with many rules governed by external reporting and tax requirements. Because it is optimized for external and tax reporting purposes, the GL is not optimized for internal analysis and reporting. For this reason, it is difficult, if not impossible, to use GL reports to understand the cost of specific service outputs. ABC/M information includes costs provided by the GL but then goes much further by analyzing these costs for internal management's use rather than for external use. ABC/M provides the principles and methodologies to trace and understand the costs of operations as an input to internal decision-making processes. ABC/M couples costs with operating results and capacities to illuminate operating results and conditions.
A basic principle of ABC/M is that cost should follow cause and effect relationships. This seems natural and logical to nonfinancial professionals. They often ask, "Isn't that the way it is done?" Unfortunately, no. The reasons lie in the historical evolution of cost analysis and its supporting technology. Before the Industrial Revolution, products and operations were typically very simple and labor intensive. Overhead was minimal and much of it supported labor operations anyway. Without computers, all computations were manual, simplistic by necessity, and kept to a minimum. Though adequate for earlier, simpler environments, the habits established for this environment persisted far too long.
As business operations, products, and services became more complex, external reporting requirements grew. Unfortunately, as these requirements gained significance in the economic climate of an era newly focused on external reporting, most internal cost analysis remained unchanged despite the growth in complexity of the products and services being offered. Because competition was minimal, plenty of room remained to manage by gut feel. As a result, internal cost analysis did not keep pace and largely retained the same techniques from simpler days. These techniques did not keep pace with the Industrial Revolution much less the IT revolution. However, using the methods and tools of ABC/M that were developed to bridge this gap in accounting evolution, enterprises can reestablish cause and effect as a governing principle in cost analysis.
Following cause and effect is especially critical with shared resources— those not dedicated to a particular service. Costing for dedicated resources is easy but limited because few resources can be dedicated to a single task. Shared resources (nearly all people and many components) require application of sound cause-and-effect costing principles.
A second ABC/M principle is to look at the work being performed as the intermediary step between resources consumed and products produced. This work is captured as activities performed by people and/or equipment. Activity analysis is a vital bridging step that serves two primary purposes. First, it enables a step-wise analysis between resources and products/services. Without the intermediary activity analysis, it is often very difficult to understand how products and services consume resources. Activities provide this missing link. Second, it provides a vital link and view to the complex processes employed to produce or deliver products or services. Process analysis is not complete without understanding the cost of the process and its components.
Within ABC/M, cost driver analysis seeks to capture and understand the root causes of activities at two levels. The first level seeks to understand why the activity is performed in the first place. Perhaps it should not be done at all, or perhaps there should be more. Assuming that the work must be performed, the second level seeks to understand the negative root causes of performance in terms of cost, quality, or cycle time. Why is cost higher than expected? Why is quality lower than desired? Why is cycle time too long? Linking cost with a root cause analysis enables process improvements to be focused on those issues that have the highest importance and the greatest overall impact on performance improvement. Correspondingly, people spend less time on issues that carry minimal cost and other performance impacts.
It's important to understand the semantic components of activity-based accounting systems. Activity-Based Cost (ABC) focuses on the flow of costs from resources through activities and subsequently from activities to products, services, and customers. See Appendix 6.A in Chapter 6 for a more detailed summary of how ABC's cost reassignment networks achieve a cause-and-effect picture of enterprise costs. Activity-Based Management (ABM) focuses on the performance aspects of activities, their cost drivers, performance measures, and process contexts. ABC and ABM are best used together as Activity-Based Cost Management (ABC/M).
An IT ABC analysis starts by identifying the resources deployed in the IT organizations. Typically, these are recorded in the GL for each IT department— usually the only relationship between ABC and the GL. The SAS ABC model begins with GL costs by department and by account as its first view, retaining the original GL view to provide a firm common starting point and for correlation with external financial reporting. However, it then also provides another parallel view of resources that better reflects operational requirements and realities.
Regrettably, the GL's level of data detail is both greater and lesser than the optimum set required for ABC depending on the resource and account structure. Where there is too much detail, such as accounts required for tax reporting, these details can be aggregated. Where there is too little detail, such as for asset depreciation, a well-designed ABC model uses its capabilities to split these costs to a more appropriate and useful level to support decision making. The reorganization is accomplished in the transition between the GL view and the new operations view.
This operationally focused view reorganizes resources and their costs to align them with operational resources—it captures resources in terms of teams of people, types of equipment, and other more operationally natural categories. This operational view is designed for use and easy understanding by operating personnel. At the same time all costs are easily traced and reconciled to traditional financial views providing a robust and comprehensive resource view that is also verifiable. This view provides IT managers with a view of what the resources they deploy actually cost in terms that they easily understand and use. This view is also the foundation for subsequent views of activities and services. The overall model cost flow and management views are shown in Exhibit 4.5.
IT components are tracked separately because they constitute a significant cost and play an essential part of IT business symphonies. For these components, the cost recorded in the GL is usually aggregated to a level not useful to operating management or for a symphonic view. For this reason, component information is obtained from asset registers or other sources to identify the current costs of components at a sufficiently granular level to support service-level agreements and Capacity Forecasting models.
After establishing an operational view of resources, the next step is to assign these costs to the work that these people do. This model uses existing ITIL process definitions as activity definitions. Using the ITIL process definitions provides a sound, common basis for measuring predictable, repeatable IT processes. ITIL processes are a necessary component in IT's maturity process. Without them, it would be difficult to attain a proactive, service-oriented, value-driven IT organization. Resources are traced department by department to the ITIL processes representing the work that the respective people performed. At this level of detail within the departments, this work is considered activities. Later costs are easily reported at the organization-wide ITIL process level using reporting tools. After these costs have been assigned, the costs of ITIL processes become available. Because the ITIL costs are tied to the operations resource and financial resource views, people can observe more powerful relationship costs with breakdowns by department and by types of resources either by the operational view or the financial view of cost.

Why continue to trace costs by department rather than by process? Why not the best of both worlds—have our cake and eat it too? Retaining a departmental view retains the department's responsibility for costs—now in the operationally focused activities. Departments are necessary for control and accountability, and each manager has the responsibility and opportunity to manage their activities.
At the same time, having used common ITIL processes as activity definitions, a process owner or team has the beginning-to-end view of the process regardless of the department. They can also drill down into the organizational components when necessary. This modeling style overcomes the departmental budget view of IT and retains accountability while providing an efficient cost analysis.
The objective of the next step in ABC/M deployment enables tracing costs to products/services provided by IT. What is the difference between a product and a service? Not much—sometimes the difference is a question of tangibility. Especially for an organization that has both physical and nonphysical outputs, this distinction may be useful. For organizations that have only intangible outputs, the difference is so trivial that the terms are interchangeable.
Following the Top-Down value strategy, service-level agreements contain the value definition for business applications as well as service-level requirements. In addition to documented SLAs, there may be more general standard services offered as a cost savings or legacy services not yet formally documented with customers. Even without formal documentation, IT should be ascertaining cost and service performance for internal management purposes. ABC methodology requires a cause-and-effect tracing of costs. Consumption metrics often provide the best basis for this assignment. Standard services may also be traced to specific services where they are used as components of a broader service offering.
At this point, cost analysis of services becomes available for service cost trend and service unit cost trend. With the relationships to ITIL processes, components, and people resources already established, these services can be analyzed by ITIL process and/or the resources consumed. Conversely, resources can be analyzed in terms of the services that ultimately consume them.
In the final step of ABC/M deployment, services are assigned to customers based on the consumption metrics of their usage. Cost metrics are now available by customer. As these are added to the relationships already calculated in the model, a rich analysis base becomes available to help understand the operations and to be related to operating results. Because the symphonies that IT plays are business applications covered by SLAs, the results can be used for both value reporting to customers and also for internal IT optimization.
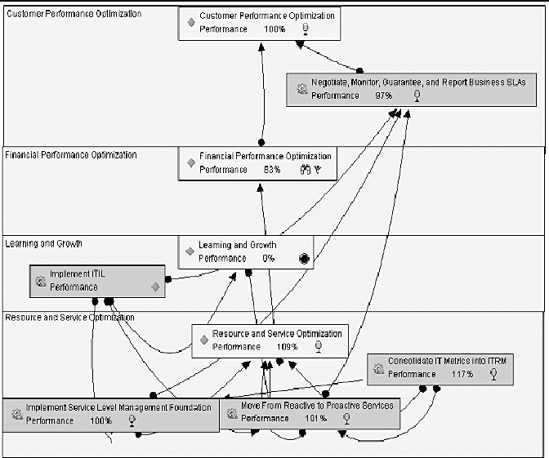
With the operational view defined, relationships established, and costs measured, the model now provides a rich source to illuminate operating results. Activities provide the essential step between resources and services provided. Understanding activities and their drivers provides actionable information. Modeling the entire organization provides a comprehensive analysis basis and avoids non-repeatable, non-verifiable ad hoc analyses. Exhibit 4.6 provides a summary of the model elements, interrelationships, and samples of the questions to be asked. Along the diagonal, the sample questions center on the model element itself, its profitability, and its cost to facilitate evaluation of other operating results. Away from the diagonal, the questions concern relationships between model elements that can be analyzed from either side of the relationship.
For example, in the intersection of the Customer row and the Customer column, the questions center on the cost or profit of the customer itself. Further questions may deal with the relative contribution from or cost of each customer. Similarly, in the intersection of the ITIL Process row and the ITIL Process column, the questions center on the cost and performance of the individual process. Further questions may deal with the relative mix of ITIL processes. Although these two sets of questions and their answers provide valuable insight and input to business decisions, the relationship etween these two elements provides even more insight. This relationship is in the intersection of the Customer column and the ITIL Process row. Now the questions center on the relationship between the ITIL process and the customer from either side of the relationship such as "How does this process support our customers?" and "Is each customer receiving appropriate value from this process?" Other row and column combinations provide additional perspectives.
ABC/M modeling requires data from several sources. One source is the General Ledger, but operational data is more important to the ABC/M model for defining and refining the financial results of the underlying operations. Asset registers may be needed to break summarized financial information down to the actual component level. Measures of how people spend their time serve to apportion their cost when they work in multiple processes. These measures do not need to be extensive—only sufficient to provide management decision-grade information.
If customer billing is performed, it becomes the source for revenue versus cost analysis. If not, then a revenue surrogate assists the decisionmaking process. System consumption metrics serve to meter ITIL process, component costs, and standard services to the services that consume them. Using the same consumption metrics for costing helps assure an accurate and relevant financial view of operating conditions.
The illumination of IT operations with cost results is only valuable when the information is used in decision making. At times, financial information can play a solo. Other times, financial information is joined with other IT sections to produce a broader perspective. This section discusses several types of reports that highlight not only the types of reports or analyses that could be generated with ABC/M information but also some of the questions or insights that come from each analysis. Most analyses take either tabular or graphical form. Tabular formats are most useful when the actual amounts are significant to decision making. Graphical formats are most useful when looking for significant changes in trends or when comparing/ contrasting different categories or time periods. Modern OLAP Business Intelligence tools include both formats and the ability to drill into upporting details.
The art of Business Intelligence tools is to apply the analysis, forecasting, and graphics to the strategic vision of the enterprise. Recall that earlier in the chapter the role of IT Finance within the Strategic Performance Management scorecards was defined within two strategic prongs (Exhibit 4.1). In the first part of the strategy, IT engineers the long-term maturity of its internal processes to gain stability, move to a proactive stance, define and provide services, and align with the rest of the business to define and provide value. In the second part, IT defines value immediately with new business pplications. As a result of that strategy, IT Finance tracks both new, welldocumented SLAs and also "legacy" SLAs that have not been well documented. The new SLAs are compared to business cases and the legacy SLAs generate a baseline of performance and cost for future decision making.
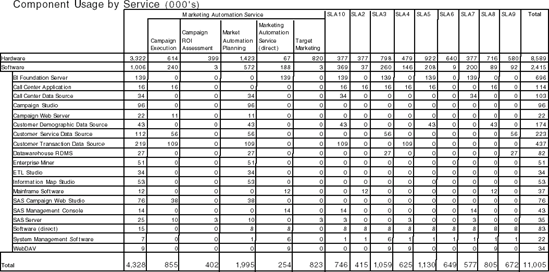
Let's begin by first focusing on the Top-Down SLAs, stepping through the results from an overview level and then examine people costs as expressed in ITIL processes and end with infrastructure costs. This section concludes by pairing the results with the pertinent operational measures. Service-level agreements are the nucleus of the Top-Down prong and become the primary focus of strategic IT Finance as illustrated in Exhibit 4.7, which examines the trended cost of services for Marketing Automation, a customer-facing formal SLA. SLAs capture the value of the service for the business, the requirements of the service, and anticipated growth. SLAs may also cover several sub-agreements.
CIOs and their IT organizations use this configuration of SLAs to negotiate and measure large, complex business applications. The value here lies in identifying costs that have changed and in comparing two separate services (rows) or time periods (columns). In this example, the user drilled own into the Marketing Automation Service to see information about SLAs covering Marketing Automation departmental modules. If this information is also presented on a per-unit of output basis, some differences may be magnified while others are diminished. If two items have equivalent cost but significantly different output volumes, a per-unit analysis would dramatically show the change. On the other hand, if a cost has increased but proportionally to the output volume, then the unit cost would be stable.
One of the main cost analysis tools provided by the ABC cost model is an analysis of the cost of a service as shown in Exhibit 4.8. Traditional cost tools would only show "Direct costs" and "Allocated Overhead" with allocations based on direct cost, labor hours, or other potentially arbitrary measure. A properly developed ABC model has summary-level analysis for high-level views as well as the ability to drill down into the composition of the cost as necessary. The composition analysis includes operating activities, processes, and/or components coupled with their cost. One typical management question is: "What does this service cost?" usually followed by


"Why does this service cost what it does?"
"What makes up that big item?"
"What did it cost last month?" and
What can we do about it?" and
"What and how much value does it generate?"
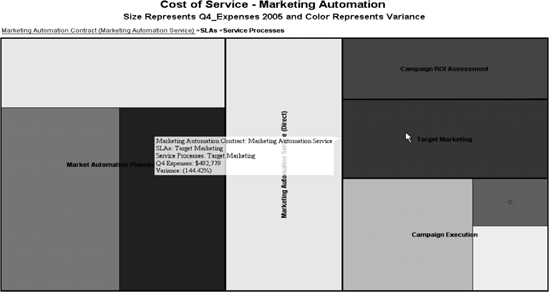
An alternate analysis of the relative magnitude of cost coming from the sub-agreements of the Marketing Automation SLA is shown in Exhibit 4.9. In addition to the magnitude, this interactive analysis shows a variance from target versus actual as a color gradation (shades of gray in this book). To explore further into a section, the analysis tool enables additional drill downs into the components. The prime question is whether the mix of cost is appropriate for the value generated or where the greater variance from target occurs.
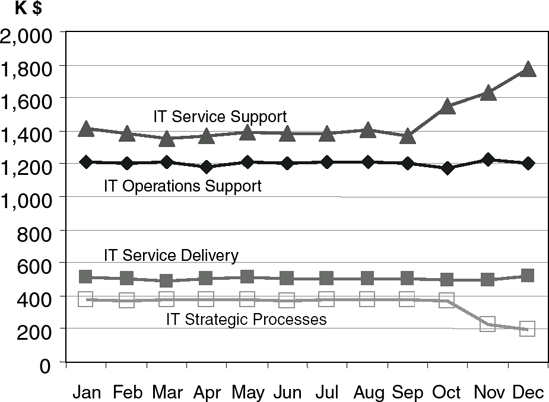
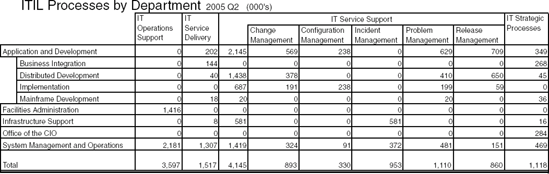
The analysis in Exhibit 4.10 examines the trended cost of major ITIL processes across all departments. The value here is in identifying what has changed or in comparing two separate services (rows) or time periods (columns). In this case, the question is why IT Service Support cost has increased and why IT Strategic Processes has decreased, especially if this is contrary to current strategy.
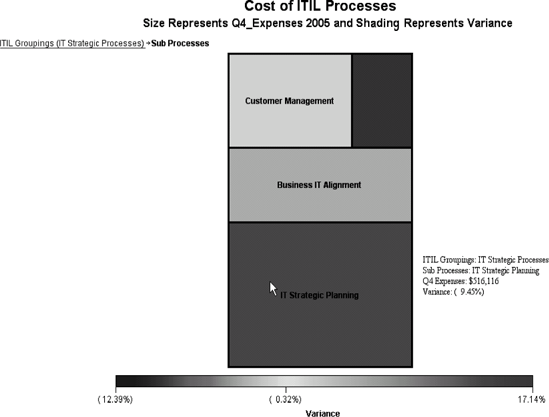
This cost trend of ITIL processes is complemented by an analysis of the relative magnitude of cost resulting from resources consumed in ITIL processes as shown in Exhibit 4.11. In addition to cost, this analysis shows a variance from target in its color gradation. A further drill down into ITIL Strategic Processes in show in Exhibit 4.12.
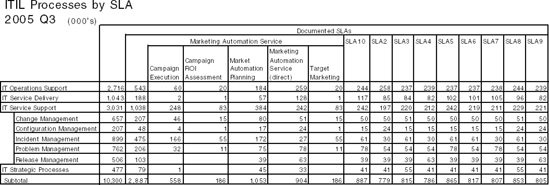
The analysis of ITIL processes by SLA shown in Exhibit 4.13 examines the contribution of ITIL processes to the various SLAs, and correspondingly, the consumption of ITIL processes by SLAs. In IT organizations, people costs typically constitute the lion's share of operating expenses. As IT sets its strategy, ITIL should play a major role to move the organization from isolated functions to an integrated unit where all IT sections harmoniously play their parts the strategic symphony. Because SLAs are IT's business perspective, investigate the makeup of ITIL costs for the SLAs in Exhibit 4.13. Are they appropriate? As IT matures, CIOs should see a decrease in the "front line" ITIL support processes of Incident and Problem Management as they increase service processes. What adjustments should IT make in process management? From the process perspective, the ITIL analysis shows the ITIL processes that various SLAs consume—helping CIOs and IT employees evaluate their appropriateness, especially in conjunction with other nonfinancial performance measures. From the SLA perspective, investigate the makeup of the SLA. Is it appropriate? What adjustments should be made in process management? From the process perspective, one sees the proportion that the various SLAs consume which ITIL processes and evaluate their appropriateness.

Using the information provided in Exhibit 4.14, IT management could communicate with their customers about the component cost of the services they consume. Conversely, IT management could evaluate how components are deployed in support of services. Are there opportunities to redeploy some components to achieve a better balance of service metrics and cost?
Analyzing ITIL Processes by Department, Exhibit 4.15 examines if departmental resources are being directed toward the processes that the CIO expects them to perform. The analysis departs from the cross-functional focus to include a responsibility focus. Each department has a manager who is responsible for the resources deployed in that department. Knowing and analyzing how the department deploys its resources gives the manager the ability to act within the department while also acting properly in the overall cross-functional context. From a higher level and across all departments, are certain departments spending too much of their resources fixing shortterm problems and not enough ensuring process stability from the outset?
Capacity drives cost, but capacity is lumpy. One usually cannot purchase 30 percent of a computer or hire 65 percent of an employee. Companies commonly buy a server but use just a fraction of its capacity. Acquisition or hiring decisions incur or commit the majority of a resource's cost regardless of how it is actually used. Other than subsequent operating costs, the cost has been determined and continues until the computer is disposed of or the employee leaves. External customers understand and are willing to pay for the capacity that they actually use or have reserved. However, they are not willing to pay for additional capacity that was purchased in anticipation of growth or becomes idle due to demand changes.[29]
Why should internal customers behave any differently? They too are willing to pay for what they use but are not willing to pay for what they don't use. However, many IT organizations implicitly and actually require their internal customers to pay for idle capacity due to their cost allocation policies. Capacity analysis integrated with ABC costing methodologies serves to identify capacity cost issues and provides insight for these kinds of management decisions.
The first step in establishing an integrated capacity analysis quantitatively identifies how capacity is used or not used. The three major capacity categories are productive, non-productive, and idle. The total capacity is time, seven days a week/24 hours a day. Aside from some Star Trek type of disruption of the space-time continuum, this is fixed. External requirements, the policies, contracts, maintenance requirements, and actual usage all serve to define how capacity is allocated to these categories and their substates or subcategories. Subcategories within each major category serve to further refine the analysis. These can be further subdivided as necessary for specific operating environments (see Exhibit 4.16).
Idle capacity includes capacity that is off limits due to regulatory, contractual, or policy restrictions. Another subcategory includes capacity that is not usable—perhaps due to obsolescence. The last subcategory includes capacity that is idle but potentially usable. Productive capacity is capacity actually used for its intended purpose or for product or process development. Non-productive capacity includes all other capacity such as capacity used for maintenance, training, setup, and rework to name a few. Planned or unplanned outages would likely fall into one of these capacity states such as maintenance. Non-productive capacity also includes one other subcategory that is especially important in IT environments. This is buffer capacity or capacity that while not used, is required to accommodate peak requirements, process balancing, or reserved for specific customers.
After building a time-based model of capacity, it is easily translated to other measures such as equivalent units. Other measures retain the same definitions. Retaining the same definitions enables easy communication between measure usages of the model.
Another important measure is cost. Using the same time-based model, cost is traced to the states appropriate for that type of cost. For example, depreciation or equipment rental applies to all capacity states whether idle, productive, or non-productive. Maintenance costs would be applied to the maintenance subcategory. The end result is a cost map overlay using the same category and subcategory definitions. The cost map is another tool that provides information for management decisions.

CIOs and IT organizations can use this cost information to determine the cost to provide services to customers. They can easily trace productive capacity to services and customers. They can also easily trace most of nonproductive capacity. Even buffer capacity cost is easily traced because it is dedicated to specific services and/or customers.
Some portion of idle capacity cost is a cost to provide services while the remainder should not be assigned to services and customers. Only offlimits capacity cost should be considered a cost to provide capacity for services and customers. This is proper because otherwise, the capacity could not be provided at all. Capacity that is not usable due to obsolescence or that is otherwise usable for other services and customers is not a cost properly attributable to current services and customers.
Yet many IT internal organizations expect their internal customers to pay for this capacity. External IT organizations cannot charge their customers because their pricing is based on market conditions and not on their cost to serve. Where significant idle capacity is present, the cost differences can be significant. Without proper understanding and treatment of these costs, management decisions will be misguided. In the worst alternative, CIOs ignorantly continue to believe inflated service costs and make decisions on that basis. Alternatively, proper understanding of idle capacity cost gives management an opportunity to know the real cost to provide services to their customer and then to find value-adding uses for any idle capacity.
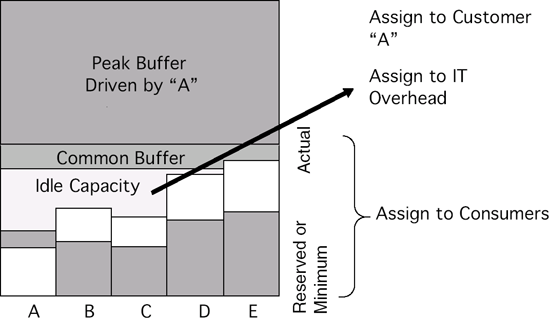
Exhibit 4.17 summarizes capacity costing where each customer (A-E) uses capacity and has certain amounts of capacity reserved. In addition, IT maintains a certain amount of capacity to provide required services at peak usage times. This buffer benefits all of these customers. However, the remaining idle capacity does not support or benefit any customer. Its cost should not be assigned to any of them. Instead, it is an overhead cost of the IT organization.
Exhibit 4.18 depicts a more advanced capacity consideration found in a commercial bank. In this case, service "A" requires a significant amount of additional capacity, and the month-end processing was a significant consideration in their purchase of a mainframe computer. The capacity requirement was to have enough power to process all month-end requirements between closing time on the 31st of the month and opening time the next day. This requirement was the basis for purchasing a larger and more expensive machine and supporting infrastructure. In this case, management recommended the creation of two capacity models.
The first capacity model considered the applications and services that required peak month-end processing. Capacity was assigned to the various categories according to usage during the peak. The cost assigned to this capacity model and its capacity states was the incremental cost of the larger computer and its support over the cost had it been sized only for non-peak requirements. The second capacity model considered all applications and services during normal operations. Capacity was assigned to these categories according to non-peak usage. The cost for this model was reduced by the cost assigned to the peak model.
This model resulted in a good understanding of the consequences of the peak requirements as well as a good understanding of the real cost of off-peak processing. With these insights, off-peak applications no longer received the peak cost and were evaluated on their own merits.
IT can be greater than the sum of its parts. Overcoming the historic practice of managing by domain and technology expertise calls for new strategies, new approaches, and a new role for IT Financial management. The dated domain and technology approach to management leaves each of the domains operating in isolation: not only from each other but from IT's management and IT's business customers. To compound the situation, the isolation approach to IT management hides the fact that IT has key management sections missing—even from the CIO.
Strategy overcomes the mixed management message delivered by the industry's mindshaper community. One camp advises a Bottom-Up, operational concentric process maturity index that delivers business value at the end of the maturity process. Another camp advises IT to deliver business first and immediately. Rather than choose one approach over the other, SAS advocates a two-prong strategy that delivers maturity and value simultaneously.
IT Finance plays a crucial role in both prongs of the strategy. From a financial perspective, the immediate business value strategy prong follows capital expenditures for new business applications while the maturity strategy prong concentrates on the expense portion of IT. For IT Finance to deliver upon this new role, new approaches are necessary. For both strategy prongs a new approach to Service Level Cost Management is needed. Equally important, IT Finance needs to overcome the traditional shortcomings of General Ledger-based accounting and budgeting in favor of service-based financial outcomes.
Strategy guides IT financial management to overcome the various IT sections and practices trapped in isolation and identify what is important to measure. Strategy also suggests that IT financial management implement Activity-Based Costing/Management to surface and analyze important IT service outcomes. This chapter focused on several service areas that deserve illumination: Cost of Service, Cost of ITIL, Cost of Capacity, and combinations of all three areas. Each of the cost measurements are important in their own right, but to overcome the isolation syndrome and play the strategic business symphonies, cost results must be paired with service outcomes. When IT reports what service was delivered, how well the service was performed, and what the service cost, then IT can play in harmony rather than in isolation.