In a free market economy driven by the competing interests of shareholders and a variety of stakeholders, executive leadership at all levels shares a common accountability: use available resources to achieve the best possible outcome. This book concludes with a discussion of resource decision making that ties together the ever-widening circles of IT influence from its strategic core. IT architecture, tactical agility, and strategic cost, performance, customer relationship, and outsourcing management each enablean organization to align, implement, and realize its strategic objectives. The art (and expectation) of executive leadership is to make decisions that unify and coordinate these many activities and grow the resources that support them.
Unfortunately, conventional ROI calculations were not designed to capture the increasing complexity of the recent emergence and rapid evolution of strategically deployed information technology resources. At the same time, enterprises expect the CIO to make wise investments without understanding the scope of these investment responsibilities. This chapter has two objectives: (1) demonstrate the ways that executive leadership can use conventional ROI calculations to improve decision making for IT project proposals; and (2) explore new perspectives on IT "investments" and arrive at ways that the CIO can help other executives manage and maximize more broad-ranging, elusive, vaporous organizational resources and achieve a return on intangibles.
Part 1 discusses the IT ROI challenges faced by the CIO who seeks to create systems and link resources that enable execution of the company's business strategy. These challenges include scope, risk, responsibility sharing, strategic precision, and local and enterprise-wide work implications in terms of new IT project proposals. Part 1 also addresses the essential elements that the CIO uses to see the ROI process through from start to finish. This includes: the joint development process between IT and Finance; a cost/potential benefit analysis; an IT ROI benefit audit; ways to weighttangible benefits; and the reapplication of people and resources freed up by the project.
Part 2 explores the rapidly emerging importance of intangible IT resources from the marketplace to the boardroom. Building on intangible management best practices from IT, Human Resources, and previous chapters, this discussion addresses practical ways that executive teams define, identify, measure, valuate, and renew their intangible IT resources.
The ROI answers the question, "Is this project worth doing?" The process of calculating the ROI builds the consensus among business and technical people. The IT people who will build the system are responsible for estimating the costs. The business people who will use the system are responsible for estimating the benefits. With the help of the CFO, Finance people are responsible for setting the financial parameters such as company cost of capital or the discount rate to be used in evaluating the value of the project. These three groups in any enterprise must come together in a common process to decide whether a project or a new IT investment is worth doing. Everyone whose budget will be affected by the project should have an opportunity to review the costs and the benefits of the project.
It is better to use a simpler ROI calculation rather than a more complex one so that everyone involved can understand it. Because it is an estimate anyway, adding additional complexity to the process does not increase its accuracy and also reduces its value as a consensus-building tool.
Once a plan has been constructed, the budget can be created. Project plans and budgets are just two sides of the same coin. Plans show the time, people, and material needed for the project, and budgets show the cost of the people and material over the time frames involved. Although, in many cases, the cost and benefits related to a project cannot be defined with absolute certainty, it is still a valuable exercise to get as accurate an estimate as possible.
It is often hard to assign specific values to the benefits, but it must be done. When in doubt, understate the benefits. Just make sure that the benefit numbers are ones that people can understand and support. The sum of these benefit numbers is the value of the project, and it is very important to have agreement on the value of a project.
The value of the project is the main reference point to keep in mind when evaluating the rest of the project. The value of the system determines how much can be spent to build the system. There are two choices when the costs to develop a system add up to more than the benefits that will be produced: Either find a less expensive way to produce those benefits or simply do not do the project. Businesses exist to make a profit and that is a discipline that all business people (including CIOs) must live with.
From a financial perspective, a system generates a stream of costs and benefits over the length of time in which it is built and used. As a rule, a system should pay for itself and return an appropriate profit within one to three years because after that time most systems usually need major enhancements or a major upgrade in the hardware and software that supports the system. CIOs who accept more than a three-year payback period are probably using the analysis to justify what is really an emotional decision.
Beyond 36 months the world changes in ways that are very hard to predict, and estimates of costs and benefits that far out tend to be exercises in wishful thinking. The only category where a case can be made for using a payback period longer than three years is systems that make up the most stable and basic transaction processing applications in a company. This includes systems such as accounting (accounts receivable, accounts payable, General Ledger), inventory control, and production scheduling. Most other types of systems from customer relation management (CRM) to business intelligence (BI) to e-commerce require significant upgrades and enhancements within three to five years because the applications they support are themselves changing quickly due to changes in technology and customer expectations.
Identify specific benefits and estimate their dollar value. Measure system costs and benefits on a quarterly basis. Subtract costs from benefits to arrive at the quarterly cash flow generated by the system. Calculate the value of that cash flow using whatever method the financial decision makers prefer (net present value, internal rate of return). The higher the risk involved in building and operating the system, the higher the profit that the system should generate.
Here are a few guidelines that help people develop their estimates of the costs and benefits for the system development project that they are evaluating:
Estimate costs high (e.g., computer system costs are calculated to cover highest estimated capacity requirements)
Create two estimates of possible benefits—a lowest expected level of benefits and a highest expected level of benefits
Calculate costs and benefits by specific line items for appropriate intervals of time (usually quarters but sometimes years) over a time frame equal to the period that the new system can operate before significant expenses to upgrade or replace the system occur (usually not greater than three years)
In a system development project there are three types of costs. Hardware and software costs include the hardware, software, and communication network components that need to be purchased from vendors for the new system design.
Development costs as estimated by the time and cost needed to achieve each project objective. Each task that is part of the work plan for an objective will require some number of people with certain skills for some period of time. Each task will also require certain technology and perhaps other expenses, such as travel, hotel rooms, and meals. Set a standard cost for each kind of person, and estimate the labor expenses for each kind of person for each step in the system development life cycle: the DEFINE, DESIGN, and BUILD steps described in Chapter 3.
Operating costs have a number of components. Estimate labor expenses for the kinds of people that will be needed for ongoing operation and support of the new system. Estimate the line charges and usage fees for the communications network and technical architecture used by the system. Obtain yearly licensing and technical support costs from vendors of the hardware and software components used by the new system.
A realistic estimate of benefits is very important. Look at the tangible benefits and assign values over a period of time. Then look at other intangible benefits such as reputation and relationships with customers and suppliers. Look at employee productivity and leveraging their talents. Who are the stakeholders in the project, and what issues are important to them? What would happen if the project was not done? How important are the benefits of the project to the stakeholders?
Four types of benefits are provided by a new system. Direct benefits are productivity increases and cost savings due to the capacity increases brought about by a new system. Define the new functions the system provides that the enterprise does not now possess. Estimate the productivity increases and labor savings that these new features provide.
Incremental benefits are monetary benefits that may not be solely the result of the new system but are measurable and due in some significant degree to the capabilities of the new system. An incremental benefit may be an increased ability to attract and retain new customers and the extra revenue that generates. It may be the new system's ability to help the enterprise avoid bad decisions or manage and plan for certain business expenses and the reduced costs that result.
Cost avoidance benefits are savings related to the increased capacity provided by the new system and the company's ability to grow the business without having to hire new staff. Intangible benefits are hard to quantify into a money amount but should be identified and listed. These benefits include such things as maintenance of a competitive advantage through better intelligence and adaptability; superior service levels that solidify customer relationships; and leveraging the abilities of talented employees and increasing their job satisfaction.
A sample of these calculations appears in Appendix 8.A. To be complete, the ROI analysis should be performed twice. The first time should show the net present value (NPV) of the project using the low end of the range of benefits estimated for the project, and the second time should use the high end of the estimated benefits. Ask the question, "Would this project still be worth doing if the costs were twice as high and/or the benefits only half as much?"
As discussed in Chapter 2, enterprises should look at their investments in IT and application systems from the perspective of portfolio management. This requires that they first define several important characteristics of these investments. Namely, what are the life spans of these investments, what are the risks associated with each investment, and what are the potential returns?
Based on these characteristics, IT investments should be placed in different categories depending on their risk and reward potential. Evaluate the riskiest systems using a higher cost of capital or discount rate, and demonstrate that they can deliver much higher benefits. The least risky systems can use a lower cost of capital and lower level of benefits. In the interests of keeping the ROI process simple, it helps to define three categories of systems investments: Basic Transaction Processing Systems; Adaptive Systems; and Linking Systems.
Basic transaction processing systems are the foundation systems that record business operations on a day-to-day, hour-by-hour basis. These systems tend to have life spans of 5-10 years. They are systems such as:
Operations Monitoring & Control
Inventory Control
Production Scheduling, Delivery Scheduling
A/R, A/P, G/L, and related accounting applications
Adaptive systems track business and operating trends and help the company respond to its environment. These systems have life spans of around 3-6 years. Some adaptive systems are:
Sales support and CRM
Business intelligence, dashboards, scorecards
Office productivity
Customer service applications
Supply chain management
E-Commerce, product catalogs, customer order entry

Linking systems connect a company with its customers and suppliers. These systems change every 1-3 years. They include systems such as:
Web sites and portals
EDI/XML/Data transfer systems
E-mail, Blackberries, instant messaging
Investments in basic transaction processing systems are less risky because they have a longer period over which to yield a return. Investments in linking systems are the riskiest because they have the shortest time to pay off. Yet linking systems can also yield some of the biggest rewards for an enterprise. See Exhibit 8.1 for an illustration of these three categories.
Enterprises do not need to make investments in basic transaction processing systems every year. When new systems in this category are installed, all that is needed for the next several years is to simply operate them and finetune their performance. From one year to the next most IT investments will be in linking systems and adaptive systems.
The linking systems projects are most likely enhancements to the Internet-based infrastructure that many enterprises now rely on to connect them with the markets they serve. In most cases, these projects are the work required to link an enterprise's internal systems with those of customers and suppliers. In those cases there should be a good indication of the revenues to be gained or the expenses to be reduced. In all likelihood, once they are built for one customer or supplier, these enhancements serve to link up with many other customers and suppliers with only small changes.
The adaptive systems investments most likely are enhancements to systems such as business intelligence and related data warehouse systems, upgrades to customer relationship management and supply chain management systems, and e-commerce systems. Enterprises are seeing a demand for more online reporting from customers, suppliers, and their own internal staff. In those cases they have some good ideas what it is worth to provide customers, suppliers, and their own people with more data.
Use the life spans defined here to analyze system investments for these systems. Provide good estimates of the revenue increases or expense decreases they enable. Then, given the desired rate of return on system investments, one can just about calculate what should be spent on each project.
This is where effective CIOs earn their keep. If a system cannot be built in a cost-effective manner, an enterprise either forgoes the business opportunity the system would enable or suffers a poor return on its investment. Enterprises that are not good at continuously designing and building new linking and adaptive systems in the information-based global economy fail just as surely as those enterprises that are not good at sales, marketing, or new product development.
The key to getting the best return on these systems investments is to design and build new systems by combining the capabilities of existing systems with carefully selected new development. Look to use available technology platforms (Internet, client/server, and mainframe) for the things they do best and design new systems that effectively use these different technologies in concert to cost-effectively support new business activities.
Think of the money invested in the three categories of systems as a portfolio with a balance of risk and expected returns appropriate to the needs of the enterprise. When a new IT project or group of projects is proposed, assess the impact on the existing portfolio of systems investments. What categories of systems are the proposed new projects in? What impact do they have on the overall risk and return structure of the IT portfolio?
Best practice CIOs define the steps in a formal Project Evaluation Process for people to use when evaluating project proposals. Six milestones in the evaluation process help ensure a deliberate, carefully reasoned decisions based on ROI determinations. (1) As projects go through the definition phase, identify a decision point where the conceptual design and the ROI are presented to the IT governance or steering committee. (2) The Finance department should make an ROI spreadsheet available to project teams and assign the appropriate discount rate. The discount rate should not be the same for all projects. The higher the degree of risk and complexity of the system to be built, the higher the discount rate should be set. (3) Make the ROI one of the deliverables at the end of the DEFINE step in any project, as described in Chapter 3. (4) ROI calculations should be a consensus-building exercise. If there is no consensus on the ROI there is no point in continuing with the project. (5) If there is consensus and the ROI shows that the project produces a low NPV then there is no point in continuing with the project. (6) Only projects that have a consensus on costs and benefits and show a high NPV get to continue on into the DESIGN phase.
Chapters 4, 5, and 6 demonstrate that accounting practices now go far beyond the balance sheet and income statement in IT best practice organizations. Strategic cost management, the Balanced Scorecard, and customer value management emphasize the ways that the leading performance indicators in the business process, customer, and learning perspectives create the monetary value eventually tallied from lagging information reported in the Financial perspective, balance sheet, and income statement. As discussed in Part 1 of this chapter, ROI calculation is a consensus-building process that depends on informed estimates of costs and benefits—the more tangible and measurable the better when it comes to investment decisions. Best IT investment practices depend on best cost and performance management practices. Good measurements become the information for good decisions.
One of the CIO's greatest challenges is that some of the most important returns on IT investment are intangible, hard to measure, and therefore hard to manage. The best practice CIO learns to first identify, understand, and deliberately manage IT intangibles before expecting them to carry any significant weight in ROI calculations for new IT project proposals. In many ways, the IT professional is more comfortable with intangibles than anyone else in the enterprise (with one exception). By definition, truly tangible items can by seen, heard, smelled, tasted, or touched, but the world of IT products and services is by nature intangible and representational as it allows people to share their thoughts with each other. The computer seems concrete and tangible; the software that instructs it, less so. Interestingly, as a species with a highly evolved visual cortex, we believe that the items we see on the computer screen are the most tangible part of the system when in fact we are only looking at conventionally accepted symbols and representations of human thoughts and concepts—the penultimate intangible.
This tendency to make the abstract concrete through systematic representation is actually good news for the tangibly dependent and the intangibly impaired. Someone will eventually find a way to make today's intangibles more palpable and manageable, and that someone will probably hail from either IT or HR (the one exception). Anyone who has ever become frustrated with intangibles might spend a little time measuring and managing the ultimate intangible, employee behavior. Human behavior and the systems that enable human communication—the most difficult things to measure matter most of all.
Human Resources professionals have become comfortable and very gifted with measuring and managing intangibles. This book's final section borrows some ideas from these gifted individuals and applies those ideas to the many intangible investment and management challenges faced by the CIO and other information professionals as outlined in the previous chapters. This book has demonstrated how heavily CIO best practices focus on the measures and management of IT performance and how many of the returns on IT investments remain intangible. Part 2 of this chapter reviews the intangibles discussed in this book and presents ways of making IT productivity and learning more tangible and manageable by making them more measurable with a more concrete place in the ROI calculations.
Most enterprises and IT organizations do not measure intangibles because intangibles are hard to measure. Part 1 of this chapter began with the question, "Is this project worth doing?" This section begins with a similar question: "Is there any real value or payoff in measuring and managing IT intangibles?"
From 1960 through 1990, 75–90 percent of a company's market value as determined by the product of stock price x shares outstanding could be predicted based on financial performance. After 1990, in both up and down markets, only 50 percent of a company's market value can be directly tied to present earnings.[94] The financial community attributes the "missing" value to intangibles. Customers of all kinds increasingly appreciate the
value of intangibles. Customers get to enjoy intangibles even when they cannot articulate them; CIOs need to learn how to measure and manage them to allow the IT organization to more successfully enable enterprise value. The next section presents a framework for measuring and managing intangible IT assets that enable enterprise strategy and thereby carry significant weight in the ROI calculation for new IT proposals.
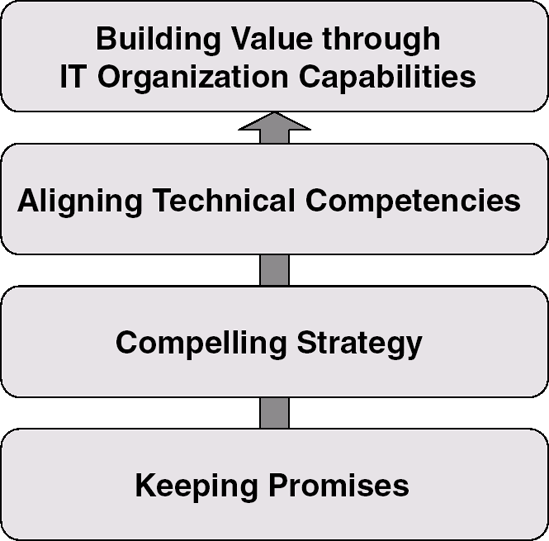
As discussed in Chapters 1 and 2, strategy and IT architecture establish the platform from which the IT organization accomplishes all its work. Strategies and architectures give people throughout the enterprise a conceptually tangible framework for understanding how their individual activities contribute to the achievement of common goals. To help enterprise leadership understand ways to measure, manage, and achieve a return on intangible investments and resources, HR researchers Dave Ulrich and Norm Smallwood have developed an Architecture for Intangibles.[95] Their architecture builds progressively from basic leadership competencies up through concepts of increasing complexity (see Exhibit 8.2).
Each level of this architecture carries a unique set of leadership responsibilities that build on the success of previous levels. The CIO who succeeds building level 1 establishes and defends the IT organization's reputation in terms of its ability to deliver products and services as promised to internal and external stakeholders. Having established trust and the authority that accompanies trustworthy behavior and performance by the IT organization, the CIO works to define and communicate a compelling vision of the future with a growth strategy in terms of customer intimacy, system and service innovation, and expanded services at level 2 of this architecture. Building level 3 upon the trust, authority, and vision of levels 1 and 2, the CIO then supplies the support that the IT organization needs to build its core competencies and the intangible value those core competencies in turn pass along to the enterprise. Then and only then can the CIO work to further develop the IT organization's capabilities and create enduring value for the entire enterprise.
Ulrich and Smallwood make this architecture work because of the measures they choose to capture intangible value in the IT organization:
These capabilities—the collective skills, abilities, and expertise of an organization—They represent the ways that people and resources are brought together to accomplish work. They form the identity and personality of the organization by defining what it is good at doing and, in the end, what it is.[96]
The CIO's first step when designing an architecture for measuring and managing IT intangibles is to select measures consistent with enterprise strategy. Fortunately, Ulrich and Smallwood have already established a starter set from researching well-managed companies that usually surpass their competitors in several measures and remain at least on par with industry performance for the others:[97]
Talent: Attract, motivate, and retain competent and committed people.
Speed: Make important changes rapidly
Shared Mind-Set and Coherent Brand Identity: Ensure that employees and customers have positive and consistent images of and experiences with our organization.
Accountability: Obtain high performance from employees.
Collaboration:Work across boundaries to ensure both efficiency and leverage.
Learning: Generate and generalize ideas with impact.
Leadership: Embed leaders throughout the organization.
Customer Connectivity: Build enduring relationships of trust with targeted customers.
Strategic Unity: Articulate and share a strategic point of view.
Innovation:Perform well with new projects in terms of both content and process.
Efficiency: Manage costs.
These measures of capability reflect the ways that intangible value surfaces from within the IT organization as it delivers on the competencies and abilities of its individuals. The art of designing a strategically aligned architecture of IT organization intangibles lies in selecting and customizing the measures that enable the strategic objectives of the enterprise by building and leveraging IT capabilities.
The preceding chapters have already discussed ways the CIO can customize these measures of capability to fit the demands placed on the IT organization as it works to enable enterprise strategy. With its strategic focus, Chapter 1 describes concrete ways that CIOs can achieve accountability, collaboration, leadership, and strategic unity. Chapter 2 addresses the many ways IT architecture enables the work of IT governance, portfolio management, and building the IT organization so that the CIO can manage talent, shared mind-set and coherent brand identity, collaboration, leadership, and strategic unity. The third chapter's focus on tactical agility shows how CIOs build speed, shared mind-set, accountability, collaboration, learning, leadership, customer connectivity, strategic unity, innovation, and efficiency. Best practices demonstrate that CIOs have the tools they need to achieve more value from their intangible resources in the IT organization, but that value will not materialize or be sustainable unless the IT organization's capabilities are continuously measured and deliberately managed.
Begin this first step for designing an architecture for IT organization intangibles practically. Sit down with your leadership team, review the strategic plans of your enterprise and your IT organization in terms of these eleven capability measures, and select three critical measures. These three measures then need to be (1) ranked in terms of strategic importance, (2) customized to fit your organization's specific strategic accountabilities, and (3) assessed according to how well they are currently performed. Next, review the remaining eight measures in the same manner. This exercise not only accomplishes the first step on the path to managing intangible IT value, but it immediately begins to build a sense of accountability, collaboration, learning, leadership, customer connectivity, and strategic unity within the IT organization.
Intangible capabilities focus on people, and the business of the IT organization is as much (or more) about services as it is about products. Like most other organizational functions, the IT organization is developing more and more specialized roles and services, each with its own distinct set of sub-functional capabilities. The CIO's first scope-related decision is a matter of what gets examined, and it makes sense to gain experience with managing intangible value by measuring the capabilities of a few limited sections or departments within the IT organization. Start by working only with those sections that contribute most to your critical capabilities as determined by your strategy.
Scope decisions also encompass information sources. Architectures can be rendered from a number of perspectives in a variety of dimensions. How complete does your information about the capabilities of your IT organization need to be? If that information comes from your experience alone, it might best be represented by a single dot; if you rely on only one other person for your capabilities information, your perspective is a one-dimensional straight line.
To achieve a two-dimensional perspective, the CIO needs to involve several sources of information. The exercise described in the previous section with the leadership team comes closer to a 90-degree view of the IT organization's capabilities. Is that enough? A true 360-degree view would involve input from representatives at all levels and all departments of the IT organization. Is that enough? After all, a 360-degree view is still constrained to two dimensions.
A full, 720-degree view requires information input from sources outside the IT organization. How much is too much? The scope of information input to support an architecture of IT intangibles depends on the capabilities chosen as critical measures. IT organizations that select shared mindset and coherent brand identity, collaboration, and customer connectivity require significant outside information. On the other hand, organizations that choose to measure and manage talent, speed, accountability, learning, leadership, strategic unity, innovation, and efficiency might not need such broad perspectives. As with the selection of capability measures, customize measurement information sources to fit your intangible management intentions—with one caution. Ulrich and Smallwood emphasize that best practices organizations manage all eleven capability measures at least on par with industry competitors.
In the third step to design an architecture for measuring and managing IT organization intangibles, the CIO conducts a capabilities audit using the measures and scope parameters established in the first two steps. A capabilities audit is an information survey that can be administered individually online, in small groups, or by any means that captures an assessment of how well the IT organization currently performs on its capabilities. Ulrich and Smallwood recommend a simple format that guides the respondent quickly through that data collection exercise.[98]
The first column lists the eleven essential organizational capabilities along with any additional capabilities the CIO wishes to add to customize the architecture according to strategic imperatives. The second column presents one or two questions that encapsulate what the IT organization needs to know about its current performance. These questions should be concise, directive, and tailored to the respondent. For example, the question that accompanies Customer Connectivity on an audit survey to be completed by a member of the IT organization might read, "How well do we build long-lasting relationships based on trust with our internal and external customers?" For CIOs that choose to expand the audit survey beyond the IT organization, the Customer Connectivity question might read, "How well does the work of the IT organization staff help build long-lasting, trustworthy relationships based on your current experience?"
Column three asks the respondent to assess the IT organization's overall performance for each of the listed capabilities. Respondents reply using a simple 1–5 or 0–10 scale, where 0 is worst and 10 is best. In column 4, respondents numerically rank each IT organization capability in terms of need for improvement, where 1 indicates the capability with the highest priority. Open space in the fifth column gives the respondent an opportunity to add comments.
The capabilities audit survey identifies all the areas where respondents inside and outside the IT organization sense or experience performance gaps, but the CIO should not give equal weight and attention to all capability deficiencies. First, review the audit survey summary for performance on the three key capabilities identified during the selection process in step one. Then as performance patterns emerge for the three key capabilities, look for linkages to other related capabilities. For example, if Strategic Unity is one of your key capabilities, how well do you perform in Collaboration and Leadership capabilities? Similarly, do your Speed, Accountability, and Efficiency scores reveal a common pattern? Before moving to an action plan, scan the non-priority capabilities for any surprises.
This is the time when the CIO and the IT organization's leadership team pause to take stock of their original capabilities priorities in reference to enterprise strategy. Do the responses suggest a "missing" capability—one that was not originally considered but that has become apparent in the patterns of the responses? Capability performance patterns that call for immediate action come in three forms: (1) key capabilities that significantly under-perform, (2) poor performing non-priority capabilities that undermine the performance of key capabilities, and (3) significant differences in the performance perceptions from respondents inside and outside the IT organization.
Complete this step by formulating a short list of IT organization capabilities that each require an action plan for deliberate, iterative measurement and management to deliver strategic value, but select those capabilities that will have the most impact and will be the easiest to improve on the first cycle of this ongoing value management process. Take your time with this step in the design of your intangible architecture and invite an open atmosphere of input from representatives throughout the IT organization. This is a perfect opportunity for the CIO to show the IT organization how to keep promises, manage trade-offs as it develops a compelling strategy, align its technical competencies, and build strategic value by improving the capabilities of the organization and its people.
Action plans address gaps in the IT organization strategic capabilities that appear in step three. Structure the overall action plan in three parts: (1) design a chronological agenda of the steps that the IT organization will take to address capabilities performance gaps, (2) establish a set of measures for each capability in the action plan, and (3) assign action plan leadership accountabilities. Whether the plan includes technology investments, training and education, or functional reorganization, establish steps or milestones with deadlines for each element of the action plan. Ulrich and Smallwood recommend a 90-day time frame for the execution of most plans after formulation.[99]
At this point, the process of building an architecture for measuring and managing IT organization intangibles has only measured employee and customer perceptions. Delivering ongoing strategic value depends on measuring how well the IT organization responds to the CIO's investments made in the first part of the action plan. How well have the investments in technology, training, and functional reorganization paid off ? Has the IT leadership team chosen the right cause-and-effect relationships to represent its measurement and management thinking? Where does IT need to direct its next investments for measuring and managing IT capabilities and their intangible strategic value? Performance measurements answer all these questions and make the management of intangible value an iterative, sustainable process. One of these ongoing measures is a regularly updated and repeated capabilities audit—measures that always work to add substance to the internal and external information detail as that detail becomes appropriate to the increasing maturity of the IT organization.
Depending on the complexity and scope of the action plan, some IT staff member or team must be made accountable for each individual element of the plan with oversight from the CIO. CIO involvement is more than just a matter of direct executive participation. The rest of the IT organization has a chance to witness first-hand leadership promoting strategic unity, collaborative learning, innovation, efficiency, and accountability. Modeling capabilities is the best way for the CIO to tangibly demonstrate the architecture for intangibles.
Quantifying intangible values (costs/revenue; resource outflows/inflows) for IT projects can be accomplished phase-by-phase in a similar fashion to cost/benefit analysis for project tangibles like hardware/software or database setup and maintenance. However, a phase-by-phase ROI of intangibles is probably too costly for the limited interim decision-making value available from phase-based investment information. Monitoring the tangible costs phase-by-phase is almost always sufficient to ascertain whether the project is on target because, for the most part, intangible costs and benefits become clear only after implementation. However, before launching the first phase of an IT project, the CIO and executive team can identify the major intangible risks and benefits associated with the project. The risk/benefit identification process serves two purposes: (1) Intangible elements guide IT staff at all phases of the project, but especially in the design phase; and (2) The CIO and executive team can develop measures for intangible project risks for use as the IT organization's customers begin to work with the new system.
How does the CIO who recognizes the strategic value of IT intangibles give appropriate weight to these elements in the ROI calculation for IT proposals? Enterprise leadership generally misses two critical factors when identifying and assessing key intangibles. (1) What factors do we expect to change for the better such as customer response time improvements from a CRM implementation? (2) What might go terribly wrong and subsequently impact both tangible investment outcomes in terms of both the total cost of implementation and intangible resource impacts, such as irritable customer service agents who are frustrated with the latest implementation leading to insulted customers and lost sales?
Best practice CIOs and their executive peers learn to apply the same risk/benefit rigor to the management of intangibles that they use for the management of tangible resources. Although intangible results are not measurable until after the actual implementation, an awareness of intangible benefits and risks plays an important guiding role throughout the project. Intangible values guide decision making for the tangible measurement categories before and during project implementation so that the enterprise can achieve a greater total ROI.
The detailed schedule of tangible ROI benefits in Exhibit 8.1 shows three categories: (1) direct benefits such as time saved on proposals, (2) incremental benefits such as winning more proposals, and (3) cost-avoidance benefits such as avoiding the need to hire new staff as the business grows. On closer inspection, these categories actually serve as performance measures that guide decision makers in assessing the success of the IT investment. In a very real way, these performance measures function as the checks and balances on the project's total tangible ROI calculation itself. These tangible measures of total ROI keep the project implementation assessment honest.
As with all performance management practices, the more attention enterprise leadership gives to measuring intangible performance elements, the more tangible they become (see Exhibit 8.3). For example, maintaining or growing market share has long been a matter of perspective in terms of who does the counting. Competitive pricing information once seemed out of reach. Formerly intangible, these measurements, including market share and price advantage, have recently matured into more actionable customer preference information gathering and pricing strategies based on multiple variables such as time to market, product maturity curve, and time in market prior to entry by competitors.
If the executive team expects the IT project to impact measures such as these, measurement selection and monitoring, as well as the related decision making on IT project status becomes highly valuable operational information. The measures selected reflect enterprise leadership insights—they reveal the business assumptions behind the measures. For example, "We chose to measure customer ratings for our field reps because we believe that our field reps are our most important customer interface listening to our customers when things go wrong, and routine maintenance causes down time for the customer. Therefore, any new IT project or system must not interfere or deteriorate our field rep services in the eyes of our customers."
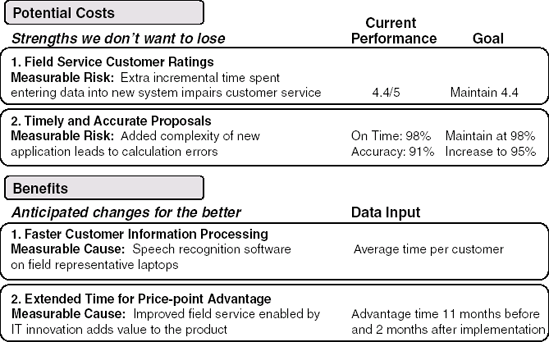
Executives must labor through measurement selection, logic, description, and goals to identify both risks (strengths we don't want to lose) and benefits (changes for the better). Note the logic in Exhibit 8.3. Executive leadership identifies strengths in terms of cause-and-effect relationships to the risks associated with potential failures and interferences that might result from the new IT project implementation. Leadership then highlights cause-and-effect relationships between anticipated future benefits with direct reference to changes enabled by the IT project.
The greatest challenge of such mature approaches is that baseline measurements have not yet been calculated, examined, and used in the deliberate manner imposed by an architecture for IT intangibles. A baseline of data and experience with intangible performance management allows intangible value to carry more weight in the ROI calculation. A related challenge is assurance that the decision makers are facile with causeand- effect thinking on an operational level. Strategy mapping is an example of this kind of thinking. Finally, responsibility for manager impact of the new IT project must be shouldered by appropriate people at whatever level they may be in the enterprise hierarchy. Obviously, this means that just about everyone in the enterprise needs to be able to think more tangibly about intangibles.
Naturally, an IT project must be of sufficient magnitude to warrant all this work in the intangible arena. If it isn't, or if the implementation isn't expected to impact operations or customers (e.g., a tax system), then follow the advice in the first part of this chapter: the simpler the better. Because many IT systems have an ENL of about three years, it is prudent to assure that new projects will not damage or destroy enterprise strengths built over decades.
IT leadership is a practice in managing intangibles, and strategic IT leadership explicitly links IT investments with strategic objectives, teasing out the concrete process and measurable result elements of enterprise strategic objectives and measuring them before, during, and after any IT project implementation. Existing accounting ROI methods (DCF, payback, IRR) have been translated from ROI on fixed assets (e.g., new machines) directly to IT and its many intangible assets, and the use of accounting ROI methods is inadequate to support executive decision making. Although cost may always be one of the enterprise's most important performance measures, cost information always lags leading performance indicators.
The only way that the CIO can effectively judge and represent the total ROI for new IT projects is to build a concrete set of reproducible, manageable performance measurements of the IT organization's intangible capabilities. In time, enterprise decision makers will learn the monetary value of documented IT organization talent, speed, shared mind-set, accountability, collaboration, learning, leadership, customer connectivity, strategic unity, innovation, and other intangible assets, and they will invest in value-enabling IT projects supported by these assets.
APPENDIX 8A. Sample ROI Calculation
Build system to assist staff of account development group to more quickly create contract proposals and explore impact of different product cost and pricing structures. Monitor status of existing contracts and provide notice before cost supports expire.
PROJECT COST & BENIFITS (DOLLARS IN THOUSANDS)
Qtr 1 | Qtr 2 | Qtr 3 | Qtr 4 | Qtr 5 | Totals | |
|---|---|---|---|---|---|---|
Hardware & Software | (7.0) | (7.0) | ||||
Development Costs | (68.5) | (68.5) | ||||
Operating Costs | 0.0 | (1.2) | (1.2) | (1.2) | (1.2) | (4.8) |
Total Costs | (75.5) | (1.2) | (1.2) | (1.2) | (1.2) | (80.3) |
Direct Benefits | 0.0 | 8.4 | 8.4 | 8.4 | 8.4 | 33.6 |
Incremental Benefits | 0.0 | 30.0 | 30.0 | 30.0 | 30.0 | 120.0 |
Cost Avoidance Benefits | 0.0 | 18.2 | 18.2 | 18.2 | 18.2 | 72.8 |
Total Benefits | 0.0 | 56.6 | 56.6 | 56.6 | 56.6 | 226.4 |
Net Benefits | ($75.5) | $55.4 | $55.4 | $55.4 | $55.4 | $146.1 |
Cumulative Benefits | ($75.5) | ($20.1) | $35.3 | $90.7 | $146.1 | |
Discount Rate | 5% | (5% per Qtr. = 20% Annual Discount Rate) | ||||
Net Present Value | 115.2 |
Note: The riskier the project the higher the NPV should be to cover the risk of building and operating the system.
COST OF HARDWARE & SOFTWARE (DOLLARS IN THOUSANDS)
Item | Description | Cost |
|---|---|---|
Application Server | Server to run the system—allocate 1/3 of server cost | 3.0 |
Personal Computers | PCs for use by staff—allocate 1/3 of cost | 3.0 |
Programming language | Allocated cost of programming language and tools | 0.5 |
SQL Server database | Allocated cost of SQL Server and tools | 0.5 |
Total | $7.0 |
COST OF DEVELOPMENT (DOLLARS IN THOUSANDS)
Task | Description | Cost |
|---|---|---|
Define Phase | 5 days at average cost of $900 per day | 4.5 |
Design Phase | 15 days at average cost of $900 per day | 13.5 |
Build Phase—Coding | 30 days at average cost of $900 per day | 27.0 |
Build Phase—Test & Train | 30 days at average cost of $650 per day | 19.5 |
Build Phase—Roll Out | 5 days at average cost of $800 per day | 4.0 |
Total | $68.5 |
COST OF OPERATION (DOLLARS IN THOUSANDS)
Activity | Description | Cost |
|---|---|---|
Qtr 1 | ||
Qtr 2 | Incremental costs of operating the system | 1.2 |
Qtr 3 | Incremental costs of operating the system | 1.2 |
Qtr 4 | Incremental costs of operating the system | 1.2 |
Qtr 5 | Incremental costs of operating the system | 1.2 |
Total | $4.8 |
Direct Benefit 1 Save staff time on proposal creation: 10 proposals per Qtr.; 20 Hrs. per proposal; $35/Hr.
Direct Benefit 2 Do 2 additional proposals per Qtr.; 20 Hrs/proposal; $35/Hr.
VALUE OF PRODOCTIVITY IMPROVEMENT (DOLLARS IN THOUSANDS)
Qtr 1 | Qtr 2 | Qtr 3 | Qtr 4 | Qtr 5 | |
|---|---|---|---|---|---|
Save time on proposals | 7.0 | 7.0 | 7.0 | 7.0 | |
Do 2 additional proposals | 1.4 | 1.4 | 1.4 | 1.4 | |
Total Direct Benefit | $0.0 | $8.4 | $8.4 | $8.4 | $8.4 |
Incremental Benefit 1 Win more proposals due to better pricing decisions: $30, 000 per Qtr in additional revenue
Incremental Benefit 2 —
VALUE OF INCREMENAL BENEFIT (DOLLARS IN THOUSANDS)
Qtr 1 | Qtr 2 | Qtr 3 | Qtr 4 | Qtr 5 | |
|---|---|---|---|---|---|
Win more proposals | 30.0 | 30.0 | 30.0 | 30.0 | |
Incremental Benefit 2 | — | — | — | — | |
Total Incr Benefit | $0.0 | $30.0 | $30.0 | $30.0 | $30.0 |
Cost Avoidance 1 Avoid hiring more staff as business grows: half a person per year; $35/Hr.
Cost Avoidance 2 —
VALUE OF COST AVOIDANCE (DOLLARS IN THOUSANDS)
Qtr 1 | Qtr 2 | Qtr 3 | Qtr 4 | Qtr 5 | |
|---|---|---|---|---|---|
Cost Avoidance 1 | 18.2 | 18.2 | 18.2 | 18.2 | |
Cost Avoidance 2 | — | — | — | — | |
Total CA Benefit | $0.0 | $18.2 | $18.2 | $18.2 | $18.2 |
Maintain Competitive Advantages
Item Pricing system should be a competitive benefit for next 2 yrs.
After that, it will simply become a necessary tool to do business
Provide Superior Service Levels
Provide customers and prospects with timely and accurate proposals
Increase Job Satisfaction
Release staff from tedious and time-consuming pricing calculations
Allow staff to focus on more valuable and interesting work
[94] Lev, B. (2001) Intangibles: Management, measuring, and reporting. Washington, DC: Brookings Institute.
[95] Dave Ulrich and Norm Smallwood, "HR's New ROI: Return on Intangibles", Human Resource Management, Summer 2005, 138-139.
[96] Dave Ulrich and Norm Smallwood, "Capitalizing on Capabilities", Harvard Business Review, June 2004, 2.
[97] See note 3 above, pages 3-5.
[98] See note 3 above, page 6.
[99] See note 3 above, page 9.