
Chapter 7
Designs to Prevent Fires and Explosions
Atwofold strategy is used to limit the potential damage from fires and explosions: prevent the initiation of the fire or explosion and minimize the damage after a fire or explosion has occurred. This strategy is presented in this chapter. The specific topics include
• inerting,
• use of the flammability diagram introduced in chapter 6,
• static electricity,
• controlling static electricity,
• ventilation,
• explosion-proof equipment and instruments,
• sprinkler systems, and
• miscellaneous design features for preventing fires and explosions.
For any fire or combustion explosion to occur, three conditions must be met (as shown in the fire triangle of Figure 6-1). First, a combustible or explosive material must be present. Second, oxygen must be present to support the combustion reaction. Finally, a source of ignition must be available to initiate the reaction. If any of the three conditions of the fire triangle is eliminated, the triangle is broken and it is impossible for a fire or combustion explosion to result. This is the basis for the first six design methods listed above.
Damage resulting from fires and explosions is minimized by stopping fires or explosions as quickly as possible and also by designing the process equipment (and control centers) to withstand their effects.
Miscellaneous design features are additional safety design methods that are usually included in the early design phases of new projects and are often the basis for safety improvements in existing plants.
7-1 Inerting
Inerting is the process of adding an inert gas to a combustible mixture to reduce the concentration of oxygen below the limiting oxygen concentration (LOC). The inert gas is usually nitrogen or carbon dioxide, although steam is sometimes used. For many gases the LOC is approximately 10%, and for many dusts it is approximately 8%.
Inerting begins with an initial purge of the vessel with inert gas to bring the oxygen concentration down to safe concentrations. A commonly used control point is 4% below the LOC, that is, 6% oxygen if the LOC is 10%.
After the empty vessel has been inerted, the flammable material is charged. An inerting system is required to maintain an inert atmosphere in the vapor space above the liquid. Ideally this system should include an automatic inert gas addition feature to control the oxygen concentration below the LOC. This control system should have an analyzer to continuously monitor the oxygen concentration in relationship to the LOC and a controlled inert gas feed system to add inert gas when the oxygen concentration approaches the LOC. More frequently, however, the inerting system consists only of a regulator designed to maintain a fixed positive inert pressure in the vapor space; this ensures that inert gas is always flowing out of the vessel rather than air flowing in. The analyzer system, however, results in a significant savings in inert gas usage without sacrificing safety.
Consider an inerting system designed to maintain the oxygen concentration below 10%. As oxygen leaks into the vessel and the concentration rises to 8%, a signal from the oxygen sensor opens the inert gas feed valve. Once again the oxygen level is adjusted to 6%. This closed-loop control system, with high (8%) and low (6%) inerting set points, maintains the oxygen concentration at safe levels with a reasonable margin of safety. NFPA recommendations are described at the end of this section.
There are several purging methods used to initially reduce the oxygen concentration to the low set point: vacuum purging, pressure purging, combined pressure-vacuum purging, vacuum and pressure purging with impure nitrogen, sweep-through purging, and siphon purging.
Vacuum Purging
Vacuum purging is the most common inerting procedure for vessels. This procedure is not used for large storage vessels because they are usually not designed for vacuums and usually can withstand a pressure of only a few inches of water.
Reactors, however, are often designed for full vacuum, that is –760 mm Hg gauge or 0.0 mm Hg absolute. Consequently, vacuum purging is a common procedure for reactors. The steps in a vacuum purging process include (1) drawing a vacuum on the vessel until the desired vacuum is reached, (2) relieving the vacuum with an inert gas, such as nitrogen or carbon dioxide to atmospheric pressure, and (3) repeating steps 1 and 2 until the desired oxidant concentration is reached.
The initial oxidant concentration under vacuum (yo) is the same as the initial concentration, and the number of moles at the initial high pressure (PH) and initial low pressure or vacuum (PL) are computed using an equation of state.
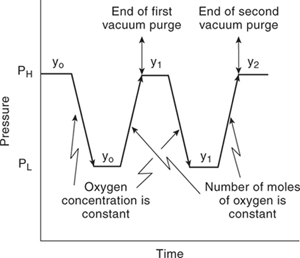
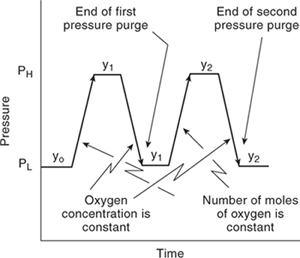
The process for vacuum purging is clarified using the stepwise procedure shown in Figure 7-1. A vessel of known size is vacuum-purged from an initial oxygen concentration yo to a final target oxygen concentration yj. The vessel is initially at pressure PH and is vacuum-purged using a vacuum at pressure PL. The objective of the following calculation is to determine the number of cycles required to achieve the desired oxygen concentration.
Figure 7-1 Vacuum purge cycles.
Assuming ideal gas behavior, the total moles at each pressure are
(7-1)
![]()
(7-2)
![]()
where nH and nL are the total moles in the atmospheric and vacuum states, respectively.
The number of moles of oxidant for the low pressure PL and high pressure PH are computed using Dalton’s law:
(7-3)
![]()
(7-4)
![]()
where 1L and 1H are the first atmospheric and first vacuum states, respectively.
When the vacuum is relieved with pure nitrogen, the moles of oxidant are the same as in the vacuum state and the moles of nitrogen increase. The new (lower) oxidant concentration is
(7-5)
![]()
where y1 is the oxygen concentration after the first purge with nitrogen. Substituting Equation 7-3 into Equation 7-5 gives
![]()
If the vacuum and inert relief process is repeated, the concentration after the second purge is
![]()
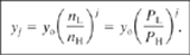
This process is repeated as often as required to decrease the oxidant concentration to a desired level. The concentration after j purge cycles, vacuum and relief, is given by the following general equation:
(7-6)
This equation assumes that the pressure limits PH and PL are identical for each cycle.
The total moles of nitrogen added for each cycle is constant. For j cycles the total nitrogen is given by
(7-7)
![]()
Example 7-1
Use a vacuum purging technique to reduce the oxygen concentration within a 1000-gal vessel to 1 ppm. Determine the number of purges required and the total nitrogen used. The temperature is 75°F, and the vessel is originally charged with air under ambient conditions. A vacuum pump is used that reaches 20 mm Hg absolute, and the vacuum is subsequently relieved with pure nitrogen until the pressure returns to 1 atm absolute.
Solution
The concentration of oxygen at the initial and final states is
yo = 0.21 lb-mol O2/total mol,
yf = 1 ppm = 1 × 10⁻⁶ lb-mol O2/total mol.
The required number of cycles is computed using Equation 7-6:
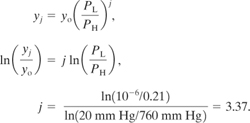
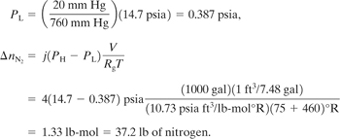
Number of purges = j = 3.37. Four purge cycles are required to reduce the oxygen concentration to 1 ppm.
The total nitrogen used is determined from Equation 7-7. The low pressure PL is
Pressure Purging
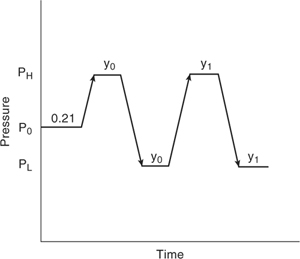
Vessels can be pressure-purged by adding inert gas under pressure. After this added gas is diffused throughout the vessel, it is vented to the atmosphere, usually down to atmospheric pressure. More than one pressure cycle may be necessary to reduce the oxidant content to the desired concentration.
The cycles used to reduce the oxygen concentration to a target level are shown in Figure 7-2. In this case the vessel is initially at PL and is pressurized using a source of pure nitrogen at PH. The objective is to determine the number of pressure purge cycles required to reach the desired concentration.
Figure 7-2 Pressure purge cycles.
Because the vessel is pressurized with pure nitrogen, the number of moles of oxygen remains constant during pressurization, whereas the mole fraction decreases. During depressurization, the composition of the gas within the vessel remains constant, but the total number of moles is reduced. Thus the oxygen mole fraction remains unchanged.
The relationship used for this purging process is identical to Equation 7-6, where nL is now the total moles at atmospheric pressure (low pressure) and nH is the total moles under pressure (high pressure). In this case, however, the initial concentration of oxidant in the vessel (yo) is computed after the vessel is pressurized (the first pressurized state). The number of moles for this pressurized state is nH and the number of moles for the atmospheric case is nL.
One practical advantage of pressure purging versus vacuum purging is the potential for cycle time reductions. The pressurization process is much more rapid compared to the relatively slow process of developing a vacuum. Also, the capacity of vacuum systems decreases significantly as the absolute vacuum is decreased. Pressure purging, however, uses more inert gas. Therefore the best purging process is selected based on cost and performance.
Example 7-2
Use a pressure purging technique to reduce the oxygen concentration in the same vessel discussed in Example 7-1. Determine the number of purges required to reduce the oxygen concentration to 1 ppm using pure nitrogen at a pressure of 80 psig and at a temperature of 75°F. Also, determine the total nitrogen required. Compare the quantities of nitrogen required for the two purging processes.
Solution
Equation 7-6 is used to determine the number of cycles required. The initial mole fraction of oxygen yo is now the concentration of oxygen at the end of the first pressurization cycle. The composition at the high-pressure condition is determined using the following equation:
![]()
where Po is the starting pressure (here atmospheric). Substituting the numbers provided, we obtain
![]()
The final oxygen concentration (yf) is specified to be 1 ppm or 10-6 lb-mol oxygen/total lb-mol. The number of cycles required is computed using Equation 7-6:
The number of purge cycles is j = 5.6. Thus six pressure purges are required, compared to four for the vacuum purge process. The quantity of nitrogen used for this inerting operation is determined using Equation 7-7:

Pressure purging requires 6 purges and 311 lb of nitrogen compared to 4 purges and 37.2 lb of nitrogen for vacuum purging. This result illustrates the need for a cost performance comparison to determine whether the time saved in pressure purging justifies the added cost for nitrogen.
Combined Pressure-Vacuum Purging
In some cases both pressure and vacuum are available and are used simultaneously to purge a vessel. The computational procedure depends on whether the vessel is first evacuated or pressurized.
The purging cycles for a pressure-first purge are shown in Figure 7-3. In this case the beginning of the cycle is defined as the end of the initial pressurization. If the initial oxygen mole fraction is 0.21, the oxygen mole fraction at the end of this initial pressurization is given by
Figure 7-3 Vacuum-pressure purging with initial pressurization.
(7-8)
![]()
At this point the remaining cycles are identical to pressure purging and Equation 7-6 applies. However, the number of cycles j is the number of cycles after the initial pressurization.
The purging cycles for an evacuate-first purge are shown in Figure 7-4. In this case the beginning of the cycle is defined as the end of the initial evacuation. The oxygen mole fraction at this point is the same as the initial mole fraction. Furthermore, the remaining cycles are identical to the vacuum purge operation and Equation 7-6 is directly applicable. However, the number of cycles j is the number of cycles after the initial evacuation.
Figure 7-4 Vacuum-pressure purging with initial evacuation.
Vacuum and Pressure Purging with Impure Nitrogen
The equations developed for vacuum and pressure purging apply to the case of pure nitrogen only. Many of the nitrogen separation processes available today do not provide pure nitrogen; they typically provide nitrogen in the 98% + range.
Assume that the nitrogen contains oxygen with a constant mole fraction of yoxy. For a pressure purging procedure the total moles of oxygen present at the end of the first pressurization is given by the moles initially present plus the moles included with the nitrogen. This amount is
(7-9)
![]()
The total moles in the vessel at the end of the first pressurization are given in Equation 7-1. Thus the mole fraction of oxygen at the end of this cycle is
(7-10)
![]()
This result is generalized into the following recursive equation (Equation 7-11) and a generalized equation (Equation 7-12) for the oxygen concentration at the end of the jth pressure cycle:
(7-11)
![]()
(7-12)
![]()
Equation 7-12 is used in place of Equation 7-6 for both pressure and vacuum purging.
Advantages and Disadvantages of the Various Pressure and Vacuum Inerting Procedures
Pressure purging is faster because the pressure differentials are greater; however, it uses more inert gas than vacuum purging. Vacuum purging uses less inert gas because the oxygen concentration is reduced primarily by vacuum. When combining vacuum and pressure purging, less nitrogen is used compared to pressure purging, especially if the initial cycle is a vacuum cycle.
Sweep-Through Purging
The sweep-through purging process adds purge gas into a vessel at one opening and withdraws the mixed gas from the vessel to the atmosphere (or scrubber) from another opening. This purging process is commonly used when the vessel or equipment is not rated for pressure or vacuum; the purge gas is added and withdrawn at atmospheric pressure.
Purging results are defined by assuming perfect mixing within the vessel, constant temperature, and constant pressure. Under these conditions the mass or volumetric flow rate for the exit stream is equal to the inlet stream. The material balance around the vessel is
(7-13)
![]()
where
V is the vessel volume,
C is the concentration of oxidant within the vessel (mass or volumetric units),
C0 is the inlet oxidant concentration (mass or volumetric units),
Qv is the volumetric flow rate, and
t is time.
The mass or volumetric flow rate of oxidant into the vessel is C0Qv, and the flow rate of oxidant exiting is CQv. Equation 7-13 is rearranged and integrated:
(7-14)
![]()
The volumetric quantity of inert gas required to reduce the oxidant concentration from C1 to C2 is Qvt, and it is determined using Equation 7-14:
(7-15)
![]()
For many systems C0 = 0.
Example 7-3
A storage vessel contains 100% air by volume and must be inerted with nitrogen until the oxygen concentration is below 1.25% by volume. The vessel volume is 1000 ft3. How much nitrogen must be added, assuming the nitrogen contains 0.01% oxygen?
Solution
The volume of nitrogen required Qvt is determined using Equation 7-15:

This is the quantity of contaminated nitrogen added (containing 0.01% oxygen). The quantity of pure nitrogen required to reduce the oxygen concentration to 1.25% is
Siphon Purging
As illustrated in Example 7-3, the sweep-through process requires large quantities of nitrogen. This could be expensive when purging large storage vessels. Siphon purging is used to minimize this type of purging expense.
The siphon purging process starts by filling the vessel with liquid—water or any liquid compatible with the product. The purge gas is subsequently added to the vapor space of the vessel as the liquid is drained from the vessel. The volume of purge gas is equal to the volume of the vessel, and the rate of purging is equivalent to the volumetric rate of liquid discharge.
When using the siphon purging process, it may be desirable to first fill the vessel with liquid and then use the sweep-through purge process to remove oxygen from the residual head space. By using this method, the oxygen concentration is decreased to low concentrations with only a small added expense for the additional sweep-through purging.
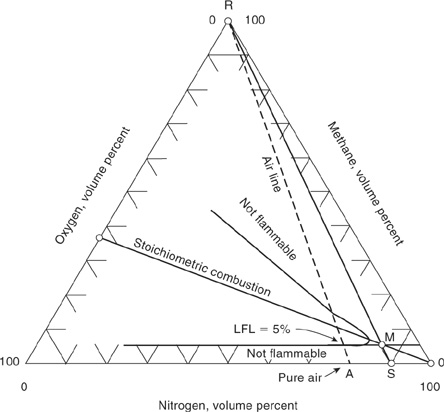
Using the Flammability Diagram To Avoid Flammable Atmospheres
The flammability diagram introduced in chapter 6 is an important tool to prevent the existence of flammable mixtures. As previously stated, the elimination of ignition sources alone is not enough to prevent fires and explosions; ignition sources are too plentiful to use as the primary prevention mechanism. A more robust design is to prevent the existence of flammable mixtures as the primary control, followed by the elimination of ignition sources as a secondary control. The flammability diagram is important for determining whether a flammable mixture exists and for providing target concentrations for inerting and purging procedures.
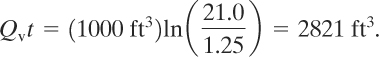
The objective is to avoid the flammable region. The procedure for taking a vessel out of service is illustrated in Figure 7-5. The vessel is initially at point A and contains pure fuel. If air is used to purge the vessel, the composition follows line AR, which crosses the flammability zone. If nitrogen is first pumped into the vessel, the gas composition follows along line AS, as shown in Figure 7-5. One approach is to continue the nitrogen flow until the vessel contains pure nitrogen. However, this requires a large amount of nitrogen and is costly. A more efficient procedure is to inert with nitrogen until point S is reached. Then air can be introduced, and the gas composition follows along the line SR in Figure 7-5. In this case the flammability zone is avoided and a safe vessel preparation procedure is ensured.
Figure 7-5 A procedure for avoiding the flammability zone for taking a vessel out of service.
One might suggest an even more optimized procedure. This involves first pumping air into the vessel until a point is reached on the air stoichiometric line above the UFL. This is followed by pumping nitrogen into the vessel followed by air. This approach avoids the nose of the flammability zone and minimizes the consumption of nitrogen. The problem with this approach, however, is that the air forms a flammable mixture at the entry point as the pure air mixes with the fuel-rich gas mixture in the vessel. The flammability diagram reflects only the average gas composition within the vessel. Using nitrogen first avoids this problem.
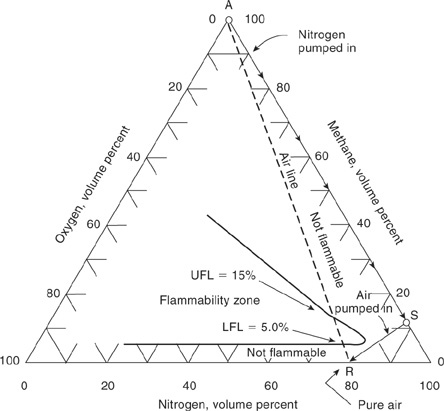
When using the nitrogen purge process, one must determine the location of point S in Figure 7-5. The approach is shown in Figure 7-6. Point S is approximated by a line starting at the pure air point R and connecting through a point M at the intersection of the LFL with the stoichiometric combustion line. Because the gas compositions at points R and M are known, the composition at point S is determined graphically or with
(7-16)

Figure 7-6 Estimating a target fuel concentration at point S for taking a vessel out of service. Point M is the intersection of the LFL line with the stoichiometric line.
where
OSFC is the out-of-service fuel concentration, that is, the fuel concentration at point S in Figure 7-6,
LFL is the volume percent of fuel in air at the lower flammability limit, and z is the stoichiometric oxygen coefficient from the combustion reaction given by Equation 6-9.
The derivation of Equation 7-16 is provided in appendix C.
Another approach is to estimate the fuel concentration at point S by extending the line from point R though the intersection of the minimum oxygen concentration (M) and the stoichiometric combustion line. The analytical result is
(7-17)

where LOC is the limiting oxygen concentration (also called the minimum oxygen concentration) in volume percent of oxygen. Equation 7-17 is derived in appendix C.
Equations 7-16 and 7-17 are approximations of the fuel concentration at point S. Fortunately, they are usually conservative, that is, less than the experimentally determined OSFC value. For instance, for methane the LFL is 5.3% and z is 2. Thus Equation 7-16 predicts an OSFC of 10.7% fuel. This is compared to an experimentally determined OSFC of 14.5% (Table 7-1). By using an experimental LOC of 12%, an OSFC value of 14% is determined. This is closer to the experimental value but still conservative. For ethylene, 1,3-butadiene, and hydrogen Equation 7-17 predicts a higher OSFC than the experimentally determined value. For all other species in Table 7-1, Equation 7-16 estimates an OSFC that is less than the experimental value.
Table 7-1 Experimental In-Service Oxygen Concentrations (ISOCs) and Out-Of-Service Fuel Concentrations (OSFCs)1
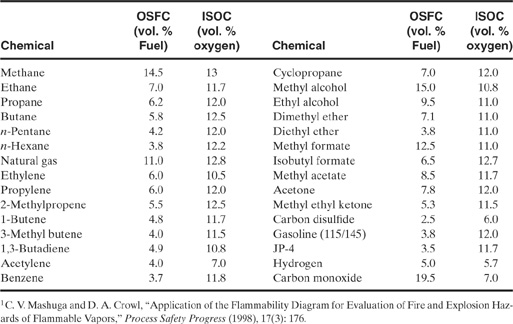
Figure 7-7 shows the procedure for placing a vessel into service. The vessel begins with air, shown as point A. Nitrogen is pumped into the vessel until point S is reached. Then fuel is pumped in, following line SR until point R is reached. The problem is to determine the oxygen (or nitrogen) concentration at point S. The in-service oxygen concentration (ISOC) represents the maximum oxygen concentration at point S in Figure 7-7 that just avoids the flammability zone, with a small margin of safety.
Figure 7-7 A procedure for avoiding the flammability zone for bringing a vessel into service.

If a detailed flammability diagram is lacking, then the ISOC is estimated. One approach is to use the intersection of the LFL with the stoichiometric combustion line. A line is drawn from the top apex of the triangle (R) through this intersection to the nitrogen axis. This is shown in Figure 7-8. The composition at S is determined graphically or with
Figure 7-8 Estimating a target nitrogen concentration at point S for placing a vessel into service. Point M is the intersection of the LFL line with the stoichiometric combustion line.
(7-18)

where
ISOC is the in-service oxygen concentration in volume % oxygen,
z is the stoichiometric coefficient for oxygen given in Equation 6-9, and
LFL is the fuel concentration at the lower flammability limit, in volume percent of fuel in air.
Equation 7-18 is derived in appendix C.
The nitrogen concentration at point S is equal to 100 – ISOC.
An expression to estimate ISOC using the intersection of the minimum oxygen concentration and the stoichiometric line is also found using a similar procedure. The analytical result is
(7-19)

where LOC is the minimum oxygen concentration in volume percent oxygen.
A comparison of the estimates using Equations 7-18 and 7-19 with the experimental values in Table 7-1 shows that Equation 7-18 predicts a lower oxygen value than the experimental values for all species, with the exception of methyl formate. Equation 7-19 predicts a lower oxygen concentration than the experimental value for all species in Table 7-1 with the exception of butane, 3-methyl-1-butane, 1,3-butadiene, isobutyl formate, and acetone. The calculated values are deliberately not shown in Table 7-1. Direct and reliable experimental data under conditions as close as possible to process conditions is always recommended.
Other methods are available to estimate the target gas concentration for placing a vessel into or out of service. For instance, NFPA 691 recommends a target oxygen concentration for storage vessels of no more than 2% below the measured LOC, if the oxygen concentration is continually monitored. If the LOC is less than 5%, the target oxygen concentration is no more than 60% of the LOC. If the oxygen concentration is not continuously monitored, then the equipment must not operate at more than 60% of the LOC, or 40% of the LOC if the LOC is below 5%.
1NFPA 69, Standard on Explosion Prevention Systems, 1997 ed. (Quincy, MA: National Fire Protection Association, 1997).
7-2 Static Electricity
A common ignition source within chemical plants is sparks resulting from static charge buildup and sudden discharge. Static electricity is perhaps the most elusive of ignition sources. Despite considerable efforts, serious explosions and fires caused by static ignition continue to plague the chemical process industry.
The best design methods for preventing this type of ignition source are developed by understanding the fundamentals relevant to static charge and by using these fundamentals to design specific features within a plant to prevent the accumulation of static charge or to recognize situations where the buildup of static electricity is inevitable and unavoidable. For unavoidable static buildup design features are added to continuously and reliably inert the atmosphere around the regions where static sparks are likely.
Fundamentals of Static Charge
Static charge buildup is a result of physically separating a poor conductor from a good conductor or another poor conductor. When different materials touch each other, the electrons move across the interface from one surface to the other. Upon separation, more of the electrons remain on one surface than on the other; one material becomes positively charged and the other negatively charged.
If both the materials are good conductors, the charge buildup as a result of separation is small because the electrons are able to scurry between the surfaces. If, however, one or both of the materials are insulators or poor conductors, electrons are not as mobile and are trapped on one of the surfaces, and the magnitude of the charge is much greater.
Household examples that result in a buildup of a static charge are walking across a rug, placing different materials in a tumble dryer, removing a sweater, and combing hair. The clinging fabrics and sometimes audible sparks are the result of the buildup of static charge.
Common industrial examples are pumping a nonconductive liquid through a pipe, mixing immiscible liquids, pneumatically conveying solids, and leaking steam that contacts an ungrounded conductor. The static charges in these examples accumulate to develop large voltages. Subsequent grounding produces large and energetic sparks.
For industrial operations where flammable vapors may be present, any charge accumulation exceeding 0.1 mJ is considered dangerous. Static charges of this magnitude are easy to generate; the static buildup created by walking across a carpet averages about 20 mJ and exceeds several thousand volts.
Basic electrostatic relationships are used to understand and investigate the sample situations. These relationships may include field strengths produced by static charges, electrostatic potential, capacitance, relaxation times, currents and potentials in flow systems, and many more.
An electrostatic discharge occurs when two materials at different potentials or polarities come close enough together to generate a charge transfer. In an explosive environment this sudden transfer of charges may be energetic enough to be an ignition source. To prevent these ignitions, one must understand (1) how charges accumulate on objects, (2) how charges discharge by means of charge transfer, and (3) how to estimate the resulting energy discharged in relation to the minimum ignition energy (MIE) of the explosive environment.
Charge Accumulation
There are four charge accumulation processes2 that are relevant to dangerous electro-static discharges in a chemical plant:
2J. A. Cross, Electrostatics: Principles, Problems, and Applications (Bristol: Adam Higler, 1987).
1. Contact and frictional charging: When two materials, with one being an insulator, are brought into contact, a charge separation occurs at the interface. If the two objects are then separated, some of the charges remain separated, giving the two materials opposite but equal charges.
2. Double-layer charging: Charge separation occurs on a microscopic scale in a liquid at any interface (solid-liquid, gas-liquid, or liquid-liquid). As the liquid flows, it carries a charge and it leaves a charge of opposite sign on the other surface, for example, a pipe wall.
3. Induction charging: This phenomenon is applicable only to materials that are electrically conductive. A person with insulated shoes, for example, may approach an overhead vessel that is positively charged (previously filled with positively charged solids). Electrons in the person’s body (head, shoulders, and arms) migrate toward the positive charge of the vessel, thus accumulating an equal quantity of positive charges on the opposite side of the body. This leaves the lower part of the body positively charged by induction. When a metal object is touched, there is a transfer of the electrons, creating a spark.
4. Charging by transport: When charged liquid droplets or solid particles settle on an isolated object, the object is charged. The transferred charge is a function of the object’s capacitance and of the conductivities of the droplet, particle, and interface.
Figure 7-9 Common electrostatic discharges.
Electrostatic Discharges3
3T. B. Jones and J. L. King, Powder Handling and Electrostatics (Chelsea, MI: Lewis Publishers, 1991).
A charged object can be discharged to a ground or to an oppositely charged object when the field intensity exceeds 3 MV/m (breakdown voltage of air) or when the surface reaches a maximum charge density of 2.7 × 10⁻⁵ C/m2 by six methods: (1) spark, (2) propagating brush, (3) conical pile (sometimes known as Maurer discharge), (4) brush, (5) lightning-like, and (6) corona discharges.
A spark discharge (Figure 7-9) is a discharge between two metallic objects. Because both objects are conductive, the electrons move to exit at a single point of the charged object, and they enter the second object at a single point. This is therefore an energetic spark that can ignite a flammable dust or gas.
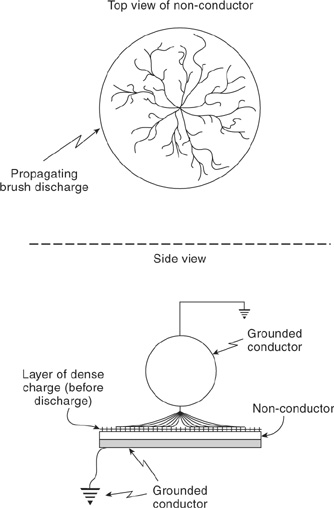
A propagating brush discharge (Figures 7-9 and 7-10) is a discharge from a grounded conductor when it approaches a charged insulator that is backed by a conductor. These discharges are energetic, and they can ignite flammable gases and dusts. Data show that propagating brush discharges are not possible if the breakdown voltage of the insulator is 4 kV or less.4
4B. Maurer, “Discharges Due to Electrostatic Charging of Particles in Large Storage Silos,” German Chemical Engineering (1979), 3: 189–195.
Figure 7-10 Propagating brush discharge.
A conical pile discharge (Figure 7-9) is a form of a brush-type discharge that occurs at the conical surface of a pile of powder.5 The necessary conditions for this discharge are (1) a powder with a high resistivity (>1010 ohm m), (2) a powder with coarse particles (>1 mm in diameter), (3) a powder with a high charge to mass ratio (for example, charged by pneumatic transport), and (4) filling rates above about 0.5 kg/s. These are relatively intense discharges with energies up to several hundred millijoules; therefore they can ignite flammable gases and dusts. To ignite dusts, the coarse particles need a fraction of fines to give an explosive atmosphere.
5M. Glor and B. Maurer, “Ignition Tests with Discharges from Bulked Polymeric Granules in Silos (Cone Discharge),” Journal of Electrostatics (1993), 30: 123–134.
A brush discharge (Figure 7-9) is a discharge between a relatively sharp-pointed conductor (radius of 0.1–100 mm) and either another conductor or a charged insulated surface. This discharge radiates from the conductor in a brush-like configuration. This discharge is less intense compared with the point-to-point spark discharge, and it is unlikely to ignite dusts. However, brush discharges can ignite flammable gases.
Lightning-like discharges (Figure 7-9) are discharges from a cloud in the air over the powder. It is known from experiments that lightning-like discharges do not occur in vessels with volumes less than 60 m3 or in silos with diameters less than 3 m.6 There is currently no physical evidence that lightning-like discharges have resulted in industrial deflagrations.
6P. Boschung, W. Hilgner, G. Luttgens, B. Maurer, and A. Wider, “An Experimental Contribution to the Question of the Existence of Lightning-Like Discharges in Dust Clouds,” Journal of Electrostatics (1977), 3: 303–310.
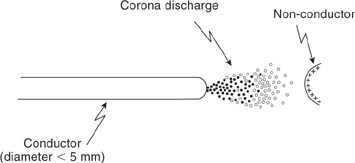
A corona discharge (Figure 7-11) is similar to a brush discharge. The electrode conductor has a sharp point. The discharge from such an electrode has sufficient energy to ignite only the most sensitive gases (for example, hydrogen).
Figure 7-11 Corona discharge.
Energy from Electrostatic Discharges
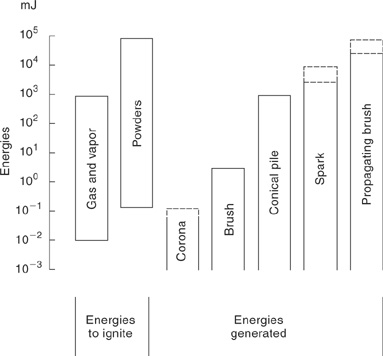
The energy generated in electrostatic discharges compared with the minimum ignition energies of gases and vapors and dusts is illustrated in Figure 7-12. In general, the results illustrate that flammable gases and vapors can be ignited by spark, brush, conical pile, and propagating brush discharges and that flammable dusts can be ignited only by sparks, propagating brush, and conical pile discharges. The regions enclosed by the dotted lines in Figure 7-12 indicate regions of uncertainty.
Figure 7-12 Minimum ignition energies compared to electrostatic discharge energies. Adapted from M. Glor and B. Maurer, “Ignition Tests with Discharges from Bulked Polymeric Granules in Silos (Cone Discharge),” Journal of Electrostatics (1993), 30: 123–134; and M. Glor, Electrostatic Hazards in Powder Handling (New York: Wiley, 1988).
Energy of Electrostatic Ignition Sources
A spark is generated between two conductors when the distance between the conductors is small compared to the diameter of the conductors and when the electric field intensity between the conductors is approximately 3 MV/m. A brush discharge is generated if the distance between the conductors is large compared to the radius of curvature of the conductor.
The energy of a spark discharge is a function of the accumulated charge (Q in coulombs) on the object, the capacitance of the object (C in farads), and the potential, or voltage (V in volts) of the object. These three variables are related by the expression C = Q/V. The actual energy (expressed in joules) associated with the discharge process is given by
(7-20)
![]()
Equation 7-20 assumes a capacitance-type discharge (that is, a spark); however, capacitance and voltage are not defined in nonconductive systems. Therefore Equation 7-20 is valid only for capacitive sparks, but it is used qualitatively for the other discharges.
A criterion that is commonly used to estimate the potential hazard of a discharge is to compare the MIE of the fuel-air mixture to the equivalent energy of the discharge. A precise experimental determination of the MIE is often required under the specific conditions of the system. MIEs are shown in Table 6-4 for a number of flammable gases and in Table 6-8 for dusts.
The static discharge energy is a function of the accumulated charge. In an industrial setting, this accumulated charge is usually the result of either contact or friction charging for flowing solids and double-layer charging for flowing liquids. In each case the charge (electrons) is transported with the material. The measure of this flow of electrons is a streaming current and is expressed in coulombs per second or amps.
Streaming Current
A streaming current IS is the flow of electricity produced by transfering electrons from one surface to another by a flowing fluid or solid. When a liquid or solid flows through a pipe (metal or glass), an electrostatic charge develops on the streaming material. This current is analogous to a current in an electrical circuit. The relation between a liquid streaming current and the pipe diameter, pipe length, fluid velocity, and fluid properties is given by7
7L. G. Britton, Avoiding Static Ignition Hazards in Chemical Operations (New York: American Institute of Chemical Engineers, 1999).
(7-21)
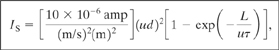
where
IS is the streaming current (amps),
u is the velocity (m/s),
d is the pipe diameter (m),
L is the pipe length (m), and
τ is the liquid relaxation time (seconds).
The relaxation time is the time required for a charge to dissipate by leakage. It is determined using
(7-22)
![]()
where
τ is the relaxation time (seconds),
εr is the relative dielectric constant (unitless),
ε0 is the permittivity constant, that is,
![]()
γcis the specific conductivity (mho/cm).
Specific conductivities and relative dielectric constants are listed in Table 7-2.
Table 7-2 Properties for Electrostatic Calculations1

Charges also accumulate when solids are transported. The buildup results from the separation of solid particle surfaces. Because solid geometries are almost always ill-defined, electrostatic calculations for solids are handled empirically.
The streaming current that is generated while transporting solids is a function of the solids processing method (see Table 7-3) and the flow rate, as shown by
Table 7-3 Charge Buildup for Various Operations1
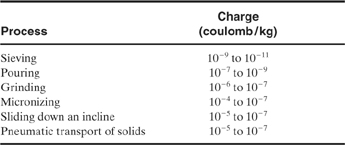
1R. A. Mancini, “The Use (and Misuse) of Bonding for Control of Static Ignition Hazards,” Plant/Operations Progress (Jan. 1988) 7(1): 24.
(7-23)
![]()
where
IS is coulombs/second or amps,
coulombs/kg is given in Table 7-3, and
kg/s is the solids flow rate.
Some generally accepted guidelines for electrostatic calculations are shown in Table 7-4.
Table 7-4 Accepted Electrostatic Values for Calculations1
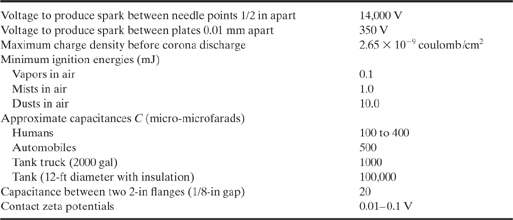
1F. G. Eichel, “Electrostatics,” Chemical Engineering (March 13, 1967), p. 163.
Electrostatic Voltage Drops
Figure 7-13 illustrates a tank with a feed line. Fluid flows through the feed line and drops into the tank. The streaming current builds up a charge and voltage in the feed line to the vessel and in the vessel itself. The voltage from the electrical ground in the metal line to the end of the glass pipe is calculated using
Figure 7-13 Electrical charge accumulation in a feed line resulting from fluid flow.

(7-24)
![]()
The resistance R (in ohms) is computed using the conductivity of the fluid γc (in mho/cm), the length of the conductor L (in cm), and the area A of the conductor (in cm2):
(7-25)
![]()
This relationship shows that as the area of the conductor increases, the resistance decreases, and if the conductor length increases, the resistance increases.
Energy of Charged Capacitors
The amount of work required to increase the charge on a capacitor from Q to Q + dQ is dJ = VdQ , where V is the potential difference and the charge is Q. Because V = Q/C, the integration gives Equation 7-20, and substitutions give
(7-26)
(7-27)

The units used in Equations 7-26 and 7-27 are usually C in farads, V in volts, Q in coulombs, and J in joules.
Capacitances of various materials used in the chemical industry are given in Table 7-5.
Table 7-5 Capacitance of Various Objects1
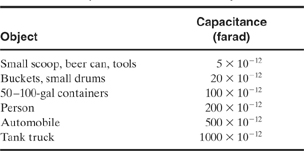
1R. A. Mancini, “The Use (and Misuse) of Bonding for Control of Static Ignition Hazards,” Plant/Operations Progress (Jan. 1988), 7(1): 24.
Charges can accumulate as a result of a streaming current dQ/dt = IS. Assuming a constant streaming current,
(7-28)
![]()
where IS is in amps and t is in seconds. Equation 7-28 assumes that the system starts with no accumulation of charge, only one constant source of charge IS, and no current or charge loss terms (see the section “Balance of Charges” for a more complex system).
Example 7-4
Determine the voltage developed between a charging nozzle and a grounded tank, as shown in Figure 7-14. Also, compute the energy stored in the nozzle and the energy accumulated in the liquid. Explain the potential hazards in this process for a flow rate of
Figure 7-14 System for Example 7-4.
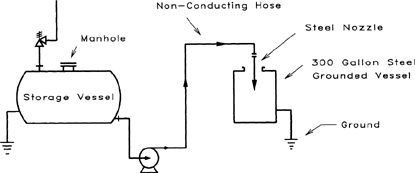
a. 1 gpm
b. 150 gpm
The data are:
Hose length: 20 ft
Hose diameter: 2 in
Liquid conductivity: 10-8 mho/cm
Dielectric constant εr: 25.7
Density: 0.88 g/cm3
Solution
a. Because the hose and nozzle are not grounded, the voltage generated at the nozzle tip is V = IR. The resistance is computed using Equation 7-25 for the conducting fluid with a resistance length equivalent to the hose length (from the ground near the pump to the nozzle) and a resistance area equivalent to the cross-sectional area of the conducting fluid:
L = (20ft)(12 in/ft)(2.54 cm/in) = 610 cm,
A = πr2 = (3.14)(1 in)2(2.54 cm/in)2 = 20.3 cm2.
Using Equation 7-25, we obtain
R = ![]()
= (108 ohm cm) ![]()
= 3.00 × 10⁹ ohm.
The streaming current is a function of the velocity and the pipe diameter. The average velocity in the pipe is
The relaxation time is estimated using Equation 7-22:
The streaming current is now determined using Equation 7-21:

Method 1: Compute the energy accumulated in the capacitor formed between the flanges at the nozzle. A spark between the flanges may be an ignition source. The voltage drop down the 20-ft line is the same as the voltage drop from the hose flange to the nozzle flange, assuming that the nozzle is grounded. The voltage is therefore
V = IR = (2.48 × 10⁻¹¹ amp)(3.0 × 10⁹ ohm)
= 0.074 volt.
The capacitance between the two 1-in flanges is given in Table 7-4, that is,
C = 20 × 10-12 farads = 20 × 10-12 coulomb/volt.
The energy is determined using Equation 7-26:
![]()
This is significantly lower than the energy required to ignite a flammable gas (0.1 mJ); therefore there is no hazard at the nozzle.
Method 2: Compute the energy accumulated in the capacitor formed by the tank of liquid. A brush discharge can jump from this liquid to a metal component, such as a grounded thermocouple. The accumulated charge is computed using Equation 7-28:
Q = Ist
with the time equal to the filling time of the vessel:
t = (300 gal/1 gpm)(60 s/min) = 18,000 s.
Substitution into Equation 7-28 gives
Q = Ist = (2.48 × 10⁻¹¹ amp)(18,000 s)
= 4.46 × 10⁻⁷ coulomb.
The capacitance of the liquid is estimated to be one-tenth of the capacitance of a 2000-gal vessel, shown in Table 7-4; therefore
C = 100 × 10-12 farads = 100 × 10-12 coulomb/volt,
and the accumulated energy is determined using Equation 7-20:
![]()
This exceeds the energy required to ignite a flammable gas (0.1 mJ). In this situation the vessel should be purged with nitrogen to keep the concentration of the flammable vapor below the LFL.
b. This case is identical to case a except that the flow rate is higher, 150 gpm versus 1 gpm for case a:
![]()
The resistance is the same as for case a, that is, 3.0 × 10⁹ ohm:
τ = 22.7 × 10⁻⁵S.
The streaming current is

Method 1: Compute the energy accumulated in the capacitor formed between the flanges at the nozzle:
V = IR = (8.08 × 10⁻⁴ amp)(3 × 10⁹ ohm) = 2.42 × 10⁻⁶ volts.
The accumulated energy is again computed using Equation 7-26:
![]()
This is greater than the energy required to ignite a flammable gas (0.1 mJ).
Method 2: Compute the energy accumulated in the capacitor formed by the tank of fluid:

This energy exceeds 0.1 mJ. This problem illustrates the importance of inerting. It is relatively easy to build up energies that exceed 0.1 mJ.
Capacitance of a Body
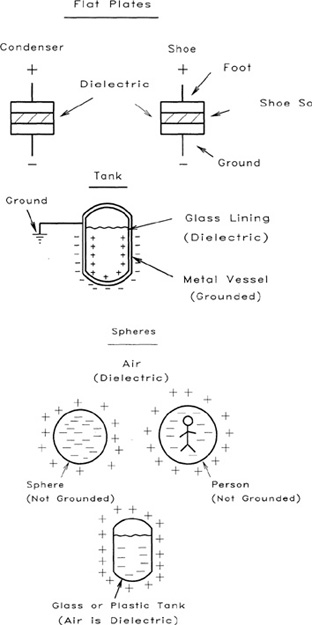
The buildup of a charge on one surface relative to another surface produces a capacitor. In the chemical industry the properties of the developed capacitor are estimated by assuming parallel flat plate or spherical geometries. For example, the capacitance of a tank or a person is estimated by assuming spherical geometries, and the capacitance of a person’s shoe sole or of a noncorrosive tank lining is estimated assuming parallel flat plates. Several examples are shown in Figure 7-15.
Figure 7-15 Different types of industrial capacitors.
The capacitance C of a body is Q/V. For a sphere with radius r the voltage developed when a charge Q is accumulated is derived with elementary physics:
(7-29)
![]()
Therefore, because C = Q/V, the capacitance for a spherical body is
(7-30)
![]()
where
εr is the relative dielectric constant (unitless),
ε0 is the permittivity (8.85 X 10⁻¹² coulomb2/N m2 = 2.7 X 10⁻¹² coulomb/volt ft),
r is the sphere radius, and
C is the capacitance.
For two parallel plates
(7-31)
![]()
Therefore the capacitance between parallel plates is
(7-32)
![]()
where
A is the area of the surface and
L is the thickness of the dielectric.
Example 7-5
Estimate the capacitance of a person (6 ft, 2 in tall) standing on a dry wooden floor.
Solution
This person’s capacitance is estimated assuming that the person’s shape is spherical and that the “sphere” is surrounded by air (εr is 1.0 for air). Using Equation 7-30 for a sphere, we have
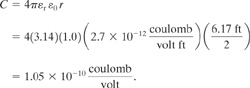
The calculated capacitance is close to the value listed for a person in Table 7-5.
Example 7-6
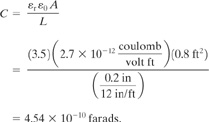
Estimate the capacitance of a person standing on a conductive floor. Assume that the person’s shoe soles separate the person from the floor; that is, the shoe sole is the dielectric of the capacitor. Given
Shoe sole area (ft2) = 2 shoes (0.4 ft2 each)
Shoe sole thickness = 0.2 in
Dielectric constant of shoe soles 3.5
Solution
Use Equation 7-32, which for flat parallel plates is
Example 7-7
Estimate the charge buildup, and accumulated energy, as a result of a person (insulated from the floor) charging 30 lb of a dry powder, using a scoop, into a 20-gal insulated drum. Assume that the person’s capacitance is 300 X 10-12 farad.
Solution
This operation is a sliding-contact type operation. From Table 7-3 this operation gives a charge of 10-5 coulomb/kg. Therefore the charge buildup is
![]()
The accumulated energy, using Equation 7-20, is
![]()
These results illustrate that the energy exceeds the requirement for generating a spark capable of igniting a flammable gas. This spark would be discharged if the person approached a ground with a hand or with the scoop.
An equal and opposite charge is also accumulated in the powder in the insulated drum. Therefore the charged powder is another ignition source. For example, if a grounded object of any kind is placed close to the solids, an energetic spark could be generated.
Balance of Charges
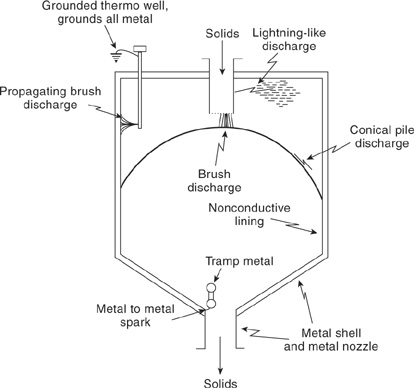
Some systems are more complex than those previously discussed; for example, a vessel may have several inlet lines and several outlet lines. An example is illustrated in Figure 7-16.
Figure 7-16 Vessel with multiple inlets and outlets.
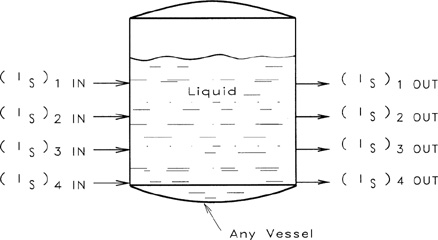
For this type of system a charge balance is required to establish the charge and accumulated energy as a function of time. The charge balance is developed by considering the currents streaming in, the charge carried away by flows going out, and charge loss resulting from relaxation. The result is
(7-33)
![]()
where
(IS)i,in is the streaming current entering the tank through a specific inlet line i from a set of n lines,
(IS)j,out is the current leaving through one specific outlet line j from a set of m lines,
Q/T is the charge loss resulting from relaxation, and T is the relaxation time.
(IS)j,out is a function of the charge accumulated in the tank and the rate of discharge F from the specific outlet nozzle j:
(7-34)
![]()
where
Vc is the container or tank volume and
Q is the total charge in the tank.
Substituting Equation 7-34 into Equation 7-33 gives
(7-35)
![]()
If the flows, streaming currents, and relaxation times are constant, Equation 7-35 is a linear differential equation that can be solved using standard techniques. The result is
(7-36)
![]()
where

Q0 is the initial charge in the tank at t = 0. These equations plus the equations described previously (equations for IS and J) are used to compute Q and J as a function of time. Therefore the hazards of relatively complex systems can be evaluated.
Equation 7-36 is also used when the filling and discharge rates are sequential. In this case Q is computed for each step with the specified Σ(IS)t,in and Σ(Fn/Vc) for that particular step, and the initial Q0 is the result from the previous step.
An example of a sequential operation is (1) charging benzene to a vessel at a specific rate through a specific line of known size, (2) charging methanol and toluene through two different lines at different rates, (3) holding the batch for a specified time, and (4) discharging the batch through a different line at a specified rate. If the line sizes, rates, and materials of construction are known, the potential hazard of each step of the operation can be estimated.
Example 7-8
A large vessel (50,000 gal) is being filled with toluene. Compute Q and J during the filling operation when the vessel is half full (25,000 gal) and where
F = 100 gpm,
IS = 1.5 10-7 amp,
Liquid conductivity = 10-14 mho cm -1, and
Dielectric constant = 2.4.
Solution
Because there is only one inlet line and no outlet lines, Equation 7-33 reduces to
![]()
Therefore
![]()
Because the vessel is initially empty, Q0 = 0. The relaxation time is computed using Equation 7-22:
![]()
The charge buildup as a function of time is
![]()
When the vessel contains 25,000 gal, the elapsed time is 15,000 s. Therefore
![]()
The capacitance of this vessel is estimated by assuming a spherical geometry surrounded by air:
Using Equation 7-30 and assuming a dielectric of 1 for air, we obtain
The energy stored in this vessel (25,000 gal of toluene) is computed using Equation 7-20:
![]()
The minimum condition for an ignition is 0.10 mJ; therefore the operating conditions for this vessel are extremely hazardous.
Example 7-9
Figure 7-17 shows an in-line trap for removing water from a process stream. Compute:
Figure 7-17 Charge buildup with complex vessel system.

a. Q and J when the vessel fluid just reaches the overflow line (start with an empty vessel).
b. Q and J under equilibrium conditions (t ∞).
c. The time required to reduce the accumulated charge to half the equilibrium charge if the flows are stopped after equilibrium conditions are reached.
d. The charge removed with the discharge under equilibrium conditions.
Given:
Volume of vessel = 5 gal
Flow rate = 100 gpm toluene
Streaming current IS = 1.5 X 10⁻⁷ amp (high value due to filter in line)
Liquid conductivity = 10-14 mho/cm
Dielectric constant = 2.4
Initial vessel charge = 2 x 10⁻⁷ coulomb
Solution
a. The residence time of this vessel is
Residence time = ![]()
The relaxation time is determined using Equation 7-22:

During the filling operation, before the liquid level reaches the discharge line, Equations 7-35 and 7-36 reduce to
with Q(t) in coulombs and t in seconds. At 3 seconds
![]()
This is the charge buildup just before reaching the overflow line.
The vessel capacitance is calculated by assuming a spherical geometry with the surrounding air serving as the dielectric. Because 5 gal = 0.668 ft3, the radius of this sphere is
![]()
The capacitance is estimated using Equation 7-30:

The energy accumulated in this vessel is estimated using Equation 7-20:
![]()
The accumulated energy (9.55 mJ) greatly exceeds the quantity required for ignition of flammable materials. This system is operating under hazardous conditions.
b. This vessel will gradually level off to steady-state equilibrium conditions when the operating time significantly exceeds the relaxation time; therefore the exponential term of Equation 7-36 is 0. Equation 7-36 for this case reduces to
![]()
From part a the capacitance is C = 1.84 X 10⁻¹¹ farads. The energy is determined by using Equation 7-20:
![]()
Although there is an additional loss of charge with the overflowing liquid, the system is still operating under hazardous conditions.
c. After the inlet flow is stopped, (IS)in and (IS)out are zero, and Equation 7-36 reduces to
![]()
For Q/Q0 = 0.5, from the problem definition,
![]()
Therefore it only takes about 15 s to reduce the accumulated charge to one-half its original charge.
d. Under equilibrium conditions Equation 7-35 is set to zero:
![]()
and from part b, Q(t = ∞) = 3.94 X 10⁻⁷ coulomb, and
Charge loss via relaxation ![]()
Charge loss via the overflow ![]()
For this example the charge loss resulting from flow out of a system is greater than the loss resulting from relaxation.
Sparks resulting from static charge and discharge continue to cause major fires and explosions within the chemical industry. The examples and fundamentals developed in these sections were designed to emphasize the importance of this subject. Hopefully this emphasis on the fundamentals will make the subject less elusive and destructive.
7-3 Controlling Static Electricity
Charge buildup, resulting sparks, and the ignition of flammable materials is an inevitable event if control methods are not appropriately used. In practice, however, design engineers recognize this problem and install special features to prevent (1) sparks by eliminating the buildup and accumulation of static charge and (2) ignition by inerting the surroundings.
Inerting (section 7-1) is the most effective and reliable method for preventing ignition. It is always used when working with flammable liquids that are 5°C (or less) below the flash point (closed cup). Methods for preventing charge buildup are described in the following paragraphs.
General Design Methods To Prevent Electrostatic Ignitions
The design objective is to prevent the buildup of charges on a product (liquid or powder) as well as on surrounding objects (equipment or personnel). For every charged object there exists its oppositely charged counterpart. Three methods are used to achieve this objective:
1. Prevent charges from accumulating to dangerous levels by reducing the rate of charge generation and increasing the rate of charge relaxation. This method is generally used when handling liquids.
2. Prevent charges from accumulating to dangerous levels by designing the system to include charge reduction by means of low-energy discharges. This method is generally used when handling powders.
3. When dangerous discharges cannot be eliminated, then prevent the possibility of an ignition by maintaining oxidant levels below the combustible levels (inerting) or by maintaining fuel levels below the LFL or above the UFL. Measures to mitigate the consequences of an explosion are also options for consideration (for example, deflagration venting and explosion suppression).
The special design features for preventing electrostatic ignitions are described in the following paragraphs.
Sparks are prevented by grounding and bonding. This procedure prevents two metallic objects (close to each other) from having different potentials. Grounding and bonding are used especially to prevent the existence of isolated metal parts or objects. Isolated objects are notorious for building up large potentials and energetic sparks when they are approached by another conductor at a lower potential.
Propagating brush discharges are prevented by keeping the nonconductive surfaces or coatings thin enough or conductive enough to have a breakdown voltage below 4 kV. These discharges are also prevented by keeping the metallic backings grounded, to eliminate the accumulation of a high-density charge on the metallic interface and a countercharge on the non-conductor surface.
Conical pile discharges are prevented by increasing the conductivity (additives), by decreasing the charge rate below 0.5 kg/s, or by using containers with a volume less than 1 m3. The most effective way of preventing ignitions from conical pile discharges is inerting.
Brush discharges are prevented by keeping the nonconductive surfaces thin enough or conductive enough to have a breakdown voltage (Ud) of 4 kV. Nonconductive coatings with a thickness greater than 2 mm, however, are capable of brush discharges even with a Ud less than 4 kV. To prevent brush discharges, a thickness of less than 2 mm is necessary. This fixes the charges accumulated on the nonconductor, and fixed charges cannot be transferred in a brush discharge. Brush discharges from nonconductive liquids are prevented by increasing the conductivity using conductive additives. The most effective way of preventing ignitions from brush discharges is inerting.
Lightning-like discharges are prevented by keeping the vessel volume to less than 60 m3 or the vessel diameter to less than 3 m. If this condition is not met, then the system needs to be inerted.
Relaxation
When pumping fluids into a vessel through a pipe on top of the vessel, the separation process produces a streaming current IS, which is the basis for charge buildup. It is possible to substantially reduce this electrostatic hazard by adding an enlarged section of pipe just before entering the tank. This hold provides time for charge reduction by relaxation. The residence time in this relaxation section of pipe should be about twice the relaxation time determined from Equation 7-22.
In actual practice,8 it was found that a hold time equal to or greater than one-half the calculated relaxation time is sufficient to eliminate charge buildup. The “twice the relaxation time” rule, therefore, provides a safety factor of 4. The American Petroleum Institute9 recommends a ud, from Equation 7-21, of less than 0.5 m2/s for road tanker filling and 0.8 m2/s for rail car filling.
8F. G. Eichel, “Electrostatics,” Chemical Engineering (Mar. 13, 1967), p. 153.
9APIRP 2003, Protection Against Ignitions Arising Out of Static, Lightning, and Stray Currents (Washington, DC: American Petroleum Institute, 1991).
Bonding and Grounding
The voltage difference between two conductive materials is reduced to zero by bonding the two materials, that is, by bonding one end of a conducting wire to one of the materials and bonding the other end to the second material.
When comparing sets of bonded materials, the sets may have different voltages. The voltage difference between sets is reduced to zero by bonding each set to ground, that is, by grounding.
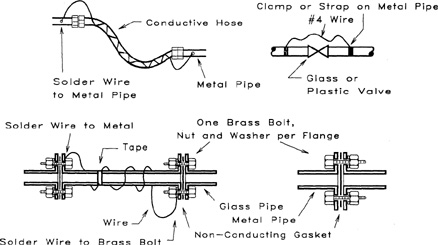
Bonding and grounding reduces the voltage of an entire system to ground level or zero voltage. This also eliminates the charge buildup between various parts of a system, eliminating the potential for static sparks. Examples of grounding and bonding are illustrated in Figures 7-18 and 7-19.
Figure 7-18 Bonding and grounding procedures for tanks and vessels. Adapted from F. G. Eichel, “Electrostatics,” Chemical Engineering (Mar. 13, 1967), p. 153.

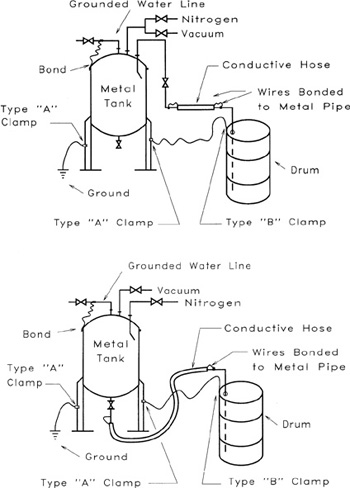
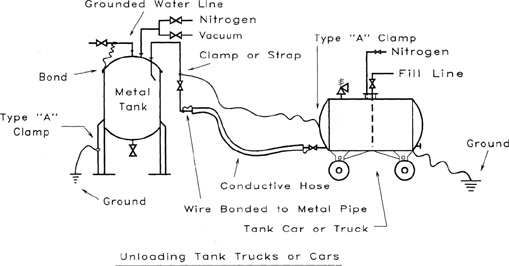
Figure 7-19 Bonding procedures for valves, pipes, and flanges. Adapted from F. G. Eichel, “Electrostatics,” Chemical Engineering (Mar. 13, 1967), p. 153.
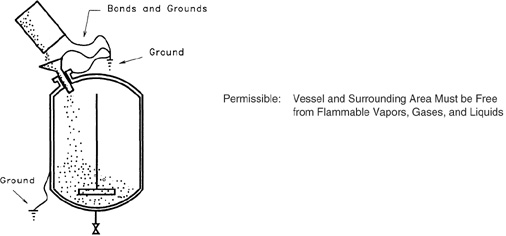
Glass and plastic lined vessels are grounded using tantalum inserts or metal probes, as illustrated in Figure 7-20. This technique, however, is not effective when handling liquids with low conductivity. In this case the fill line should extend to the bottom of the vessel (see Figure 7-21), to help eliminate the charge generation (and accumulation) resulting from separation during the filling operation. Also, the inlet velocities should be low enough to minimize the charge generated by streaming current IS.
Figure 7-20 Grounding glass-lined vessels.
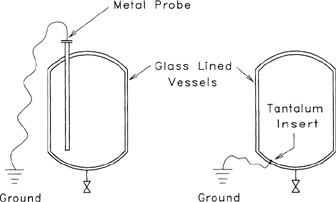
Figure 7-21 Dip legs to prevent free fall and accumulation of static charge.
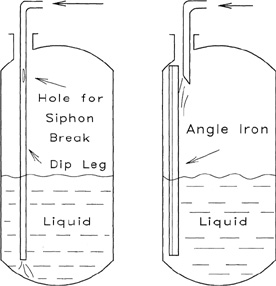
Dip Pipes
An extended line, sometimes called a dip leg or dip pipe, reduces the electrical charge that accumulates when liquid is allowed to free fall. When using dip pipes, however, care must be taken to prevent siphoning back when the inlet flow is stopped. A commonly used method is to place a hole in the dip pipe near the top of the vessel. Another technique is to use an angle iron instead of a pipe and to let the liquid flow down the angle iron (see Figure 7-21). These methods are also used when filling drums.
Increasing Conductivity with Additives
The conductivity of nonconducting organic materials can sometimes be increased using additives called antistatic additives. Examples of antistatic additives include water and polar solvents, such as alcohols. Water is effective only when it is soluble in the offending liquid, because an insoluble phase gives an additional source of separation and charge buildup.
Handling Solids without Flammable Vapors
Charging solids with a nongrounded and conductive chute can result in a buildup of a charge on the chute. This charge can accumulate and finally produce a spark that may ignite a dispersed and flammable dust.
Solids are transferred safely by bonding and grounding all conductive parts and/or by using nonconductive parts (drum and chute). See Figure 7-22.
Figure 7-22 Handling solids with no flammable vapors present. Adapted from Expert Commission for Safety in the Swiss Chemical Industry, “Static Electricity: Rules for Plant Safety,” Plant/Operations Progress (January 1988), p. 19.
Handling Solids with Flammable Vapors
A safe design for this operation includes closed handling of the solids and liquids in an inert atmosphere (see Figure 7-23).
Figure 7-23 Handling solids with flammable vapors present. Source: Expert Commission for Safety in the Swiss Chemical Industry, “Static Electricity: Rules for Plant Safety,” Plant/Operations Progress (January 1988), p. 19. Reprinted by permission of the American Institute of Chemical Engineers, New York.
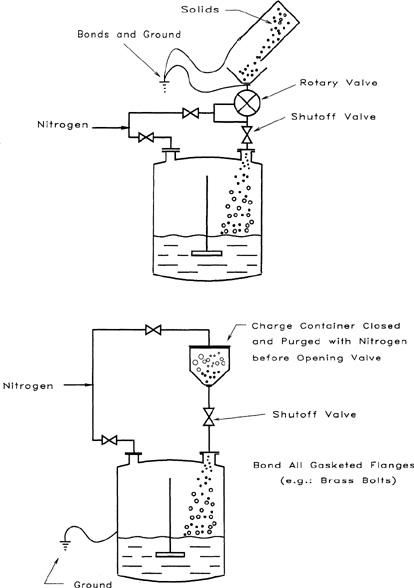
For solvent-free solids the use of nonconductive containers is permitted. For solids containing flammable solvents, only conductive and grounded containers are recommended.10
10Expert Commission for Safety in Swiss Chemical Industry, “Static Electricity: Rules for Plant Safety,” Plant/Operations Progress (January 1988), 7(1): 1.
7-4 Explosion-Proof Equipment and Instruments
All electrical devices are inherent ignition sources. Special design features are required to prevent the ignition of flammable vapors and dusts. The fire and explosion hazard is directly proportional to the number and type of electrically powered devices in a process area.
Most safety practices for electrical installations are based on the National Electric Code (NEC).11 Although states, municipalities, and insurance companies may have their own installation requirements, they are usually based on the NEC.
11NFPA 70, The National Electrical Code Handbook (Quincy, MA: National Fire Protection Association, 1996).
Process areas are divided into two major types of environments: XP and non-XP. XP, for explosion proof, means flammable materials (particularly vapors) might be present at certain times. Non-XP means that flammable materials are not present, even under abnormal conditions. For non-XP designated areas open flames, heated elements, and other sources of ignition may be present.
Explosion-Proof Housings
In an XP area the electrical equipment and some instrumentation must have special explosion-proof housings. The housings are not designed to prevent flammable vapors and gases from entering but are designed to withstand an internal explosion and prevent the combustion from spreading beyond the inside of the enclosure. A motor starter, for example, is enclosed in a heavy cast walled box with the strength needed to withstand explosive pressures.
The explosion-proof design includes the use of conduit with special sealed connections around all junction boxes.
Area and Material Classification
The design of electrical equipment and instrumentation is based on the nature of the process hazards or specific process classifications. The classification method is defined in the National Electrical Code; it is a function of the nature and degree of the process hazards within a particular area. The rating method includes Classes I, II, and III, Groups A-G, and Divisions 1 or 2.
The classes are related to the nature of the flammable material:
Class I: Locations where flammable gases or vapors are present.
Class II: Same for combustible dusts.
Class III: Hazard locations where combustible fibers or dusts are present but not likely to be in suspension.
The groups designate the presence of specific chemical types. Chemicals that are grouped have equivalent hazards:
Group A: acetylene
Group B: hydrogen, ethylene
Group C: carbon monoxide, hydrogen sulfide
Group D: butane, ethane, ethyl alcohol
Group E: aluminum dust
Group F: carbon black
Group G: flour
Division designations are categorized in relationship to the probability of the material being within the flammable or explosive regions:
Division 1: Probability of ignition is high; that is, flammable concentrations are normally present.
Division 2: Hazardous only under abnormal conditions. Flammable materials are normally contained in closed containers or systems.
Design of an XP Area
When designing an XP area, all pieces of electrical equipment and instrumentation are specified for the class, group, and division, as discussed previously. All pieces of equipment and instrumentation within an area must be appropriately specified and installed. The overall classification is only as good as the piece of equipment in an area with the lowest classification.
7-5 Ventilation
Proper ventilation is another method used to prevent fires and explosions. The purpose of ventilation is to dilute the explosive vapors with air to prevent explosion and to confine the hazardous flammable mixtures.
Open-Air Plants
Open-air plants are recommended because the average wind velocities are high enough to safely dilute volatile chemical leaks that may exist within a plant. Although safety precautions are always practiced to minimize leaks, accidental releases from pump seals and other potential release points.
Example 7-10
A plant handling substantial quantities of flammable toluene is located 1000 ft from a residential area. There is some concern that a sizable leak of flammable vapors will form a flammable cloud with subsequent ignition in the residential area. Determine the minimum mass flow rate of toluene leakage required to produce a vapor cloud in the residential area with a concentration equal to the LFL. Assume a 5 mph wind and D atmospheric stability.
Solution
Assume a continuous leak at ground level. The plume concentration directly downwind along the cloud centerline is given by Equation 5-48:
![]()
Solving for Qm, the mass flow rate from the leak, we obtain
![]()
The LFL for toluene is 1.4% in air (from appendix B). Converting the units, we obtain
![]()
The wind speed is 5 mph = 2.23 m/s. The distance downwind is 1000 ft = 304 m. From Figure 5-10, σy = 22 m and σz = 12 m. Substituting, we obtain
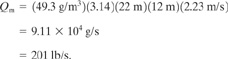
Any leak with a flow rate greater than 201 lb/s is capable of producing a flammable cloud in the residential area. Of course, the toxic effects of this cloud must also be considered. The LEL of 57.5 g/m3 is much above the TLV of 0.188 g/m3.
Plants Inside Buildings
Frequently, processes cannot be constructed outside. In this case local and dilution ventilation systems are required. These ventilation systems were discussed in detail in chapter 3, section 3-4.
Local ventilation is the most effective method for controlling flammable gas releases. Dilution ventilation, however, is also used because the potential points of release are usually numerous and it may be mechanically or economically impossible to cover every potential release point with only local ventilation.
There are empirically determined design criteria for designing ventilation systems for flammable materials inside storage and process areas. These design criteria are given in Table 7-6.
Table 7-6 Ventilation Data for Handling Flammable Materials1

1Data taken from NFPA 30, Flammables and Combustible Liquids Code, 1996 ed. (Quincy, MA: National Fire Protection Association, 1996).
The effectiveness of a ventilation system is determined using material balance equations, described in chapter 3 in the section “Estimating Worker Exposures to Toxic Vapors,” and as illustrated in the following example.
Example 7-11
Determine the concentration of toluene over a diked area (100 ft2) that contains toluene as a result of a spill. Assume that the process area (2500 ft2) is designed to handle Class I flammable materials and that the liquid and air temperature is 65°F. The vapor pressure of toluene at 65°F is 20 mm Hg. The LEL is 1.4% by volume.
Solution
The source models for spills are described in chapter 3, Equations 3-14 and 3-18. The concentration of volatiles in a ventilated area resulting from the evaporation from a pool is given by Equation 3-14: where
![]()
where
K is the mass transfer coefficient, determined using Equation 3-18,
A is the area of the pool,
Psat is the saturation vapor pressure of the liquid,
k is the nonideal mixing factor,
Qv is the volumetric ventilation rate, and
P is the pressure.
The ventilation capacity for this process area is based on the design criterion of 1 ft3/min/ft2 (Table 7-6); therefore
![]()
Also,

The mass transfer coefficient is computed using Equation 3-18 with M0, and K0 for water, that is, 18 and 0.83 cm/s, respectively:
![]()
The nonideal mixing factor k ranges between 0.1 and 0.5. Because no information is given about the ventilation, k is used as a parameter. Substituting into Equation 3-14, we obtain

The concentration range is estimated to be
Cppm = 1996 ppm = 0.1996% by volume, for k = 0.5,
Cppm = 9980 ppm = 0.998% by volume, for k = 0.1.
These concentrations are considerably below the LFL of 1.4% by volume, which illustrates that the specified ventilation rate for Class I liquids is satisfactory for handling relatively large spills of flammable materials. The concentrations do, however, exceed the TLV for this substance.
7-6 Sprinkler Systems
Sprinkler systems are an effective way to contain fires. The system consists of an array of sprinkler heads connected to a water supply. The heads are mounted in a high location (usually near ceilings) and disperse a fine spray of water over an area when activated. The heads are activated by a variety of methods. A common approach activates the heads individually by the melting of a fusible link holding a plug in the head assembly. Once activated, the sprinklers cannot be turned off unless the main water supply is stopped. This approach is called a wet pipe system. These systems are used for storage areas, laboratories, control rooms, and small pilot areas. Another approach activates the entire sprinkler array from a common control point. The control point is connected to an array of heat and/or smoke detectors that start the sprinklers when an abnormal condition is detected. If a fire is detected, the entire sprinkler array within an area is activated, possibly in areas not even affected by the fire. This approach is called a deluge system. This system is used for plant process areas and larger pilot plants.
Sprinkler systems can cause considerable water damage when activated, depending on the contents of the building or process structure. Statistically, the amount of water damage is never as great as the damage from fires in areas that should have had sprinklers.
Sprinkler systems require maintenance to ensure that they remain in service and have an adequate and uninterrupted water supply.
There are various fire classes that require different sprinkler designs. The detailed descriptions of these classes and sprinkler specifications are given in NFPA 13.12 An average chemical plant is classified as an ordinary hazard (Group 3) area. Various sprinkler specifications for this type of area are given in Table 7-7.
12NFPA 13, Installation of Sprinkler Systems (Quincy, MA: National Fire Protection Association, 1999).
Table 7-7 Fire Protection for Chemical Plants1

1Data taken from NFPA 13, Installation of Sprinkler Systems (Quincy, MA: National Fire Protection Associates, 1999); and NFPA 15, Standards for Water Spray Fixed Systems for Fire Protection (Quincy, MA: National Fire Protection Association, 1996).
Sometimes vessels need special water protection to keep the vessel walls cool during fires. High surface temperatures can result in metal failure at pressures far below the vessel’s maximum allowable working pressure (MAWP) with potentially disastrous consequences. In hydro-carbon spill fires unprotected vessels (no insulation or water spray) can fail within minutes.
A water spray protection system around vessels is recommended to prevent this type of failure. These water spray protection systems, commonly called deluge systems, are designed to keep the vessel cool, flush away potentially hazardous spills, and help to knock down gas clouds.13 Deluge systems can also provide enough time to transfer material out of a storage tank into another (safe) area.
13D. C. Kirby and J. L. De Roo, “Water Spray Protection for a Chemical Processing Unit: One Company’s View,” Plant/Operations Progress (October 1984), 13(4).
Vessel deluge systems are usually designed as open-head systems, which are activated when a fire is detected and/or a flammable gas mixture is detected. The deluge system is usually opened when the flammable gas concentration is a fraction of the LFL (approximately 25%) or when a fire is detected through heat. Table 7-7 provides descriptions and design specifications for these systems.
Monitors are fixed water hydrants with an attached discharge gun. They are also installed in process areas and storage tank areas. Fire hydrants and monitors are spaced 150–250 ft apart around process units, located so that all areas of the plant can be covered by 2 streams. The monitor is usually located 50 ft from the equipment being protected.14 Fire monitors discharge water at a rate of 500–2000 gpm.
14Orville M. Slye, “Loss Control Association,” Paper presented at AICHE Symposium, New Orleans, Louisiana, March 6–10, 1988.
Example 7-12
Determine the sprinkler requirements for a chemical process area within a building with an area of 100 ft by 30 ft that handles reactive solvents. Determine the number of sprinkler spray nozzles and pump specifications. Assume 0.5-in orifice sprinklers with 35 psig at each nozzle, giving 34 gpm each, a 10-psig frictional loss within the system, and a 15-ft elevation of the sprinkler system above the pump.
Solution
Data for designing this system are found in Table 7-7.
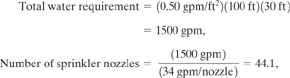
which is rounded to the next even number for layout convenience, or 44.
The pressure required at the pump is the sum of the minimum pressure at the nozzle (specified as 35 psi), the pressure loss resulting from friction (10 psi), and the pressure resulting from the
1John A. Davenport, “Prevent Vapor Cloud Explosions,” Hydrocarbon Processing (March 1977), pp. 205–214; and Orville M. Slye, “Loss Prevention Fundamentals for Process Industry,” Paper presented at AICHE Loss Prevention Symposium, New Orleans, LA, March 6–10, 1988.
pipe elevation over the pump (15 ft water or 6.5 psi). Therefore the total pressure is 51.5 psi, which is rounded up to 52 psi. The pump power is now determined:
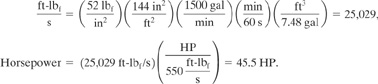
Therefore this sprinkler requires a pump with a capacity of 1500 gpm and a 45.5-HP motor, assuming an efficiency of 100%.
Actually, fire pumps are usually designed with discharge pressures of 100–125 psig so that the hose and monitor nozzle streams will have an effective reach. In addition, the size of the monitor is governed by requirements in the fire codes.15
15National Fire Codes, v. 1 (Quincy, MA: National Fire Protection Association, 1986).
7-7 Miscellaneous Designs for Preventing Fires and Explosions
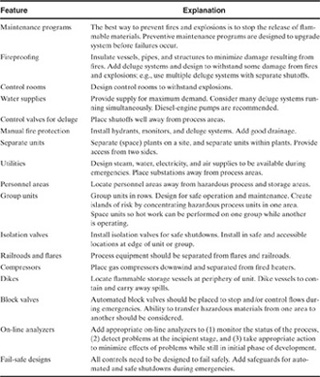
The successful prevention of fires and explosions in chemical plants requires a combination of many design techniques, including those mentioned previously and many more. A complete description of these techniques is far beyond the scope of this text. A partial list, shown in Table 7-8, is given to illustrate that safety technology is relatively complex (the appropriate application requires significant knowledge and experience) and to serve as a checklist for engineers to help them include the critical features for preventing fires and explosions.
Table 7-8 Miscellaneous Designs for Preventing Fires and Explosions1
Suggested Reading
R. Beach, “Preventing Static Electricity Fires,” Chemical Engineering (Dec. 21, 1964), pp. 73–78; (Jan. 4, 1965), pp. 63–73; and (Feb. 2, 1965), pp. 85–88.
L. G. Britton, Avoiding Static Ignition Hazards in Chemical Operations (New York: American Institute of Chemical Engineers, 1999).
H. Deichelmann, The Electrostatic Charge of Glass-Lined Vessels and Piping, Pfaudler PWAG Report 326e.
J.S. Dorsey, “Static Sparks: How to Exorcise the ‘Go Devils,’” Chemical Engineering (Sept. 13, 1976), pp. 203–205.
Fire Protection Handbook, 14th ed. (Boston: National Fire Protection Association, 1976), ch. 5.
S.K. Gallym, “Elements of Static Electricity,” Gas (March 1949), pp. 12–46.
M. Glor, Electrostatic Hazards in Powder Handling (New York: Wiley, 1988).
H. Haase, Electrostatic Hazards (New York: Verlag Chemie-Weinheim, 1977).
T. M. Kirby, “Overcoming Static Electricity Problems in Lined Vessels,” Chemical Engineering (Dec. 27, 1971), p. 90.
T.A. Kletz, What Went Wrong? (Houston: Gulf Publishing, 1985).
A. Klinkenberg and J.L. Van der Mine, Electrostatics in the Petroleum Industry (New York: Elsevier, 1958).
L.B. Loeb, “The Basic Mechanisms of Static Electrification,” Science (Dec. 7, 1945), pp. 573–576. “Loss Prevention,” Chemical Engineering Progress (1977), v. 11.
J. F. Louvar, B. Maurer, and G. W. Boicourt, “Tame Static Electricity,” Chemical Engineering Progress (November 1994), pp. 75–81.
G. Luttgens and M. Glor, Understanding and Controlling Static Electricity (Goethestrasse, Germany: Expert Verlag, 1989).
S.S. MacKeown and V. Wouk, “Electrical Charges Produced by Flowing Gasoline,” Industrial Engineering Chemistry (June 1942), pp. 659–664.
T. H. Pratt, Electrostatic Ignitions of Fires and Explosions (Marietta, GA: Burgoyne, 1997).
Recommended Practice on Static Electricity, NFPA 77-1972 (Boston: National Fire Protection Association, 1972).
D.I. Saletan, “Static Electricity Hazards,” Chemical Engineering (Jun. 1, 1959), pp. 99–102; and (Jun. 29, 1959), pp. 101–106.
F.B. Silsbee, Static Electricity, Circular C-438 (Washington, DC: National Bureau of Standards, 1942). Static Electricity, Bulletin 256 (Washington, DC: US Department of Labor, 1963).
Problems
7-1. Develop a list of steps needed to convert a common kitchen into an XP area.
7-2. What bonding and grounding procedures must be followed to transfer a drum of flammable solvent into a storage tank?
7-3. Ethylene oxide is a flammable liquid having a normal boiling temperature below room temperature. Describe a system and a procedure for transferring ethylene oxide from a tank car through a pumping system to a storage tank. Include both inerting and purging as well as bonding and grounding procedures.
7-4. Flammable liquid is being pumped out of a drum into a bucket using a hand pump. Describe an appropriate grounding and bonding procedure.
7-5. Using the sweep-through purging method, inert a 100-gal vessel containing 100% air until the oxygen concentration is 1%. What volume of nitrogen is required? Assume nitrogen with no oxygen and a temperature of 77°F.
7-6. A 150-ft3 tank containing air is to be inerted to 1% oxygen concentration. Pure nitrogen is available for the job. Because the tank’s maximum allowable working pressure is 150 psia, it is possible to use either the sweep-through or a pressurization technique. For the pressurization technique, multiple pressurization cycles might be necessary, with the tank being returned to atmospheric pressure at the end of each cycle. The temperature is 80°F.
a. Determine the volume of nitrogen required for each technique.
b. For the pressurization technique, determine the number of cycles required if the pressure purge includes increasing the pressure to 140 psia with nitrogen and then venting to 0 psig.
7-7. Use a vacuum purging technique to purge oxygen from a 150-ft3 tank containing air. Reduce the oxygen concentration to 1% using pure nitrogen as the inert gas. The temperature is 80°F. Assume that the vacuum purge goes from atmospheric pressure to 20 mm Hg absolute. Determine the number of purge cycles required and the total moles of nitrogen used.
7-8. Repeat Problem 7-7 using a combined vacuum and pressure purge. Use a vacuum of 20 mm Hg absolute and a pressure of 200 psig.
7-9. Use the sweep-through purging technique to reduce the concentration of toluene from an initial 20% to 1% in a room with a volume of 25,000 ft3. Assume that the room is purged with air at a rate of 6 room volumes per hour. How long will it take to complete this purge process?
7-10. Design an inerting system for a pressure vessel to maintain the inert atmosphere at 40 psig. Be sure to account for filling and emptying of the vessel. Indicate the precise location of valves, regulators, pipes, etc.
7-11. Design a generalized pressure vessel storage tank for a flammable material. Include the following design features:
a. Vacuum and pressure purging.
b. Vacuum charging of material from a 55-gal drum.
c. Draining the tank contents. Provide precise details on the location of valves, regulators, and process lines.
7-12. Determine the number of vacuum purges required to reduce a vessel’s oxygen concentration from 21% to 1% if the nitrogen contains:
a. 0 ppm of oxygen.
b. 9000 ppm of oxygen.
Assume that your vacuum system goes down to 20 mm Hg absolute.
7-13. Use the system described in Figure 7-14 to determine the voltage developed between the $$$ charging nozzle and the grounded tank, and the energy stored in the nozzle. Explain the potential hazard for cases a and b from the following table:
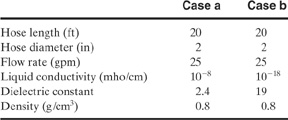
7-14. Use the system described in Problem 7-13, part b, to determine the hose diameter required to eliminate the potential hazard resulting from static buildup.
7-15. Repeat Example 7-2 with a 40,000-gal storage vessel. Assume that the vessel height is equal to the diameter.
7-16. Review Problem 7-13, part b. What is the most effective way to reduce the hazard of this situation?
7-17. Estimate the charge buildup and accumulated energy as a result of pneumatically conveying a dry powder through a Teflon duct. The powder is collected in an insulated vessel. Repeat the calculation for a transport rate of 50 lb/min and 100 lb/min for transport times of 1 hr and 5 hr. Discuss ways to improve the safety of this situation.
7-18. Compute the accumulated charge and energy for a 100,000-gal vessel being filled with a fluid at a rate of 200 gpm and having a streaming current of 2 X 10⁻⁶ amp. Make the calculation for a fluid having a conductivity of 10-18 mho/cm and a dielectric constant of 2.0. Repeat the calculation for (a) a half full vessel, (b) a full vessel, and (c) a full vessel with an overflow line.
7-19. For Problem 7-18, part c, if the inlet flow is stopped, compute the accumulated charge and energy after 5 hr and after 20 hr. Discuss the consequences of these results.
7-20. Some large storage vessels have a floating head, a flat cover that floats on the liquid surface. As the liquid volume increases and decreases, the floating head rises and falls within the cylindrical shell of the vessel. What are the reasons for this design?
7-21. Determine the fire water requirements (gpm, number of sprinklers, and pump horsepower) to protect an inside process area of 200 ft2. Assume that the sprinkler nozzles have a 0.5-in orifice, the nozzle pressure is 75 psig, and the rate is 50 gpm.
7-22. What electrical classification would be specified for an area that has Classes I and II, Groups A and E, and Divisions 1 and 2 motors?
7-23. Determine the recommended distance between a process area with toluene and an area with an open flame. Toluene leaks as large as 200 gpm have been recorded. Assume an average wind speed of 5 mph and stability class D.
7-24. Determine the recommended ventilation rate for an inside process area (30,000 ft3) that will handle Class I liquids and gases.
7-25. For the process area described in Problem 7-24, determine the concentration of propane in the area as a function of time if at t = 0 a 3/4-in propane line breaks (the propane main header is at 100 psig). The temperature is 80°F. See chapter 4 for the appropriate source model and chapter 3 for material balance models.
7-26. Using the results of Problem 7-25, describe what safety features should be added to this process area.
7-27. Determine the fire water requirements (gpm, number of sprinkler heads, and pump horsepower) to protect an inside process area of 2000 ft2. Assume that the sprinkler nozzles have a 0.5-in orifice and that the nozzle pressure is 75 psig.
7-28. Repeat Problem 7-27 assuming that the nozzle pressure is 100 psig and that the rate is 58 gpm.
7-29. Determine the water requirement (gpm) and number of nozzles for a deluge system required to protect a 10,000-gal storage tank that has a diameter of 15 ft. Use 0.5-in nozzles with a nozzle pressure of 35 psig, and assume that the vessel contains a reactive solvent.
7-30. Determine the sprinkler requirements for a chemical process area 150 ft by 150 ft. Determine the number of sprinkler heads and the pump specifications for this system (HP and gpm). Assume that the friction loss from the last sprinkler head to the pump is 50 psi and that the nozzles (0.5-in orifice) are at 75 psig.
7-31. Acetone (C3H6O) is to be stored in a cylindrical process vessel with a diameter of 5 ft and a height of 8 ft. The vessel must be inerted with pure nitrogen before storage of the acetone. A limited supply of pure nitrogen is available at 80 psig and 80°F. A vacuum is available at 30 mm Hg absolute pressure.
a. Determine the target oxygen concentration for the inerting procedure.
b. Decide whether a pressure or vacuum purge, or a combination of both, is the best procedure.
c. Determine the number of cycles required for your selected procedure.
d. Determine the total amount of nitrogen used. The final pressure in the tank after the inerting procedure is atmospheric. The ambient temperature is 80°F.