Chapter 3
Industrial Hygiene
Industry and society are continuing to focus on reducing personnel and environmental damage resulting from accidents. Many of the results in this area are due to civic concern and ethics, sometimes manifested in laws and regulations. In this chapter we describe the relationship between laws and regulations as an introduction to industrial hygiene.
Industrial hygiene is a science devoted to the identification, evaluation, and control of occupational conditions that cause sickness and injury. Industrial hygienists are also responsible for selecting and using instrumentation to monitor the workplace during the identification and control phases of industrial hygiene projects.
Typical projects involving industrial hygiene are monitoring toxic airborne vapor concentrations, reducing toxic airborne vapors through the use of ventilation, selecting proper personal protective equipment to prevent worker exposure, developing procedures for the handling of hazardous materials, and monitoring and reducing noise, heat, radiation, and other physical factors to ensure that workers are not exposed to harmful levels.
The three phases in any industrial hygiene project are identification, evaluation, and control:
• Identification: determination of the presence or possibility of workplace exposures.
• Evaluation: determination of the magnitude of the exposure.
• Control: application of appropriate technology to reduce workplace exposures to acceptable levels.
In chemical plants and laboratories the industrial hygienist works closely with safety professionals as an integral part of a safety and loss prevention program. After identifying and evaluating the hazards, the industrial hygienist makes recommendations relevant to control techniques. The industrial hygienist, safety professionals, and plant operations personnel work together to ensure that the control measures are applied and maintained. It has been clearly demonstrated that toxic chemicals can be handled safely when principles of industrial hygiene are appropriately applied.
3-1 Government Regulations
Laws and Regulations
Laws and regulations are major tools for protecting people and the environment. Congress is responsible for passing laws that govern the United States. To put these laws into effect, Congress authorizes certain government organizations, including the Environmental Protection Agency (EPA) and OSHA, to create and enforce regulations.
Creating a Law
A law is created with a three-step process:
Step 1: A member of Congress proposes a bill. A bill is a document that, if approved, becomes a law.
Step 2: If both houses of Congress approve the bill, it is sent to the president, who has the option to either approve it or veto it. If approved, it becomes a law that is called an act.
Step 3: The complete text of the law is published in the United States Code (USC).1 The code is the official record of all federal laws.
Creating a Regulation
After the law is official, how is it put into practice? Laws often do not include the details for compliance. For example, the USC requires the appropriate respirator protection, but it does not specify the detailed types or limitations of respirators. To make the laws work on a day-today level, Congress authorizes governmental organizations, including the EPA and OSHA, to create regulations and/or standards.
Regulations set specific rules about what is legal and what is not legal. For example, a regulation relevant to the Clean Air Act will specify levels of specific toxic chemicals that are safe, quantities of the toxic chemicals that are legally emitted into the air, and what penalties are given if the legal limits are exceeded. After the regulation is in effect, the EPA has the responsibility (1) to help citizens comply with the law and (2) to enforce the regulation.
The process for creating a regulation and/or standard has two steps:
Step 1: The authorized organization or agency decides when a regulation is needed. The organization then researches, develops, and proposes a regulation. The proposal is listed in the Federal Register (FR) so that the public can evaluate it and send comments to the organization. These comments are used to revise the regulation.
Step 2: After a regulation is rewritten, it is posted in the Federal Register as a final rule, and it is simultaneously codified by publishing it in the Code of Federal Regulations (CFR).
In 1970 the US Congress enacted a health and safety law that continues to have a signifi-cant impact on the practices of industrial hygiene in the chemical industry: the Occupational Safety and Health Act of 1970 (OSHAct). To appreciate the significance of the OSHAct, it is helpful to review regulations and practices2 before 1970.
2J. B. Olishifski, ed., Fundamentals of Industrial Hygiene, 2d ed. (Chicago: National Safety Council, 1979), pp. 758–777.
Before 1936 regulations concerning occupational health were poorly administered by state and local governmental agencies. During this era, staffs and funds were too small to carry out effective programs. In 1936 the federal government enacted the Walsh-Healy Act to establish federal safety and health standards for activities relating to federal contracts. This 1936 act also initiated significant research related to the cause, recognition, and control of occupational disease. The concepts promulgated by the Walsh-Healy Act, although not adequate by today’s standards, were the forerunners of our current occupational health and safety regulations.
Between 1936 and 1970 a number of states enacted their own safety and health regulations. Although some progress was made, these regulations were never sufficiently supported to carry out a satisfactory program. This produced relatively inconsistent and ineffective results.
The OSHAct of 1970 was developed to solve these problems and to give a nationally consistent program with the funding necessary to manage it effectively. This act defined clear procedures for establishing regulations, conducting investigations for compliance, and developing and maintaining safety and health records.
As a result of the OSHAct, sufficient funding was committed to create and support the Occupational Safety and Health Administration (OSHA), which manages and administers the government’s responsibilities specified in the OSHAct, and the National Institute for Occupational Safety and Health (NIOSH), which conducts research and technical assistance programs for improving the protection and maintenance of workers’ health. Examples of NIOSH responsibilities include (1) measuring health effects of exposure in the work environment, (2) developing criteria for handling toxic materials, (3) establishing safe levels of exposure, and (4) training professionals for administering the programs of the act.
NIOSH develops data and information regarding hazards, and OSHA uses these data to promulgate standards. Some laws and regulations particularly relevant to the chemical industry are shown in Table 3-1. As illustrated in this table, the distinction between laws (USC) and regulations (CFR) is global versus detail.
Table 3-1 A Few Laws (USC) and Regulations (CFR)

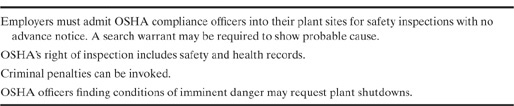
The OSHAct makes employers responsible for providing safe and healthy working conditions for their employees. OSHA is authorized, however, to conduct inspections, and when violations of the safety and health standards are found, they can issue citations and financial penalties. Highlights of OSHA enforcement rights are illustrated in Table 3-2.
Table 3-2 Highlights of OSHA’s Right of Enforcement
The implications, interpretations, and applications of the OSHAct will continue to develop as standards are promulgated. Especially within the chemical industry, these standards will continue to create an environment for improving process designs and process conditions relevant to the safety and health of workers and the surrounding communities.
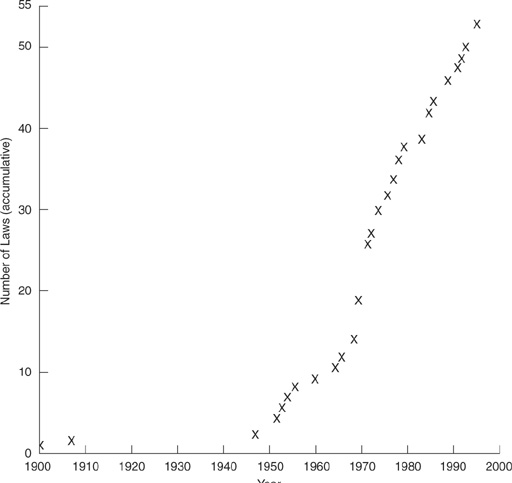
Government regulation will continue to be a significant part of the practice of chemical process safety. Since the OSHAct was signed into law, substantial new legislation controlling the workplace and community environment has been enacted. Table 3-3 provides a summary of relevant safety legislation, and Figure 3-1 shows how the amount of legislation has increased. A description of this legislation is well beyond the scope and goals of this textbook. However, it is important that chemical engineers be aware of the law to ensure that their facilities comply.
Table 3-3 Federal Legislation Relevant to Chemical Process Safety1
1 Information from the EPA and OSHA web sites: www.epa.gov/epahome and www.osha-stc.gov/oshstd-toc/osha-std-toc
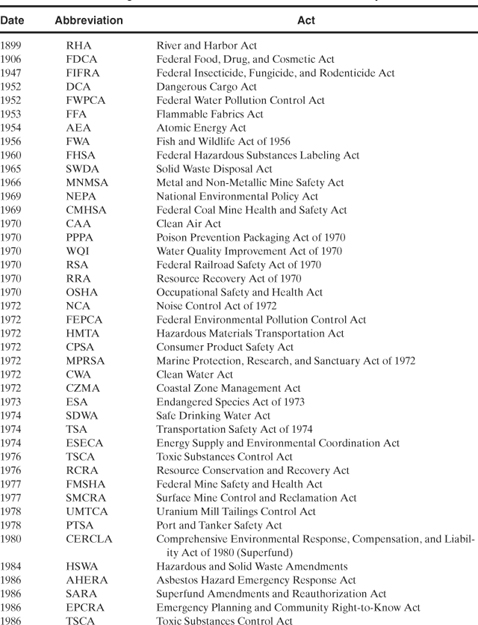
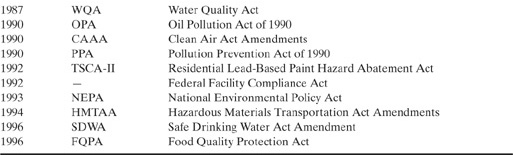
Figure 3-1 Number of federal laws relevant to chemical process safety.
OSHA: Process Safety Management
On February 24, 1992, OSHA published the final rule “Process Safety Management of Highly Hazardous Chemicals.” This standard is performance oriented; that is, it sets general requirements for the management of hazardous chemicals. Process safety management (PSM) was developed after the Bhopal accident (1984), to prevent similar accidents. It is recognized by industry and the government as an excellent regulation that will reduce the number and magnitude of accidents – if it is understood and practiced as intended.
The PSM standard has 14 major sections: employee participation, process safety information, process hazard analysis, operating procedures, training, contractors, pre-startup safety review, mechanical integrity, hot work permits, management of change, incident investigations, emergency planning and response, audits, and trade secrets. A brief description of each section is given in what follows.
Employee participation requires active employee participation in all the major elements of PSM. Employers must develop and document a plan of action to specify this participation.
Process safety information is compiled and made available to all employees to facilitate the understanding and identification of hazards. This information includes block flow diagrams or process flow diagrams, process chemistry, and process limitations, such as temperatures, pressures, flows, and compositions. Consequences of process deviations are also required. This process safety. information is needed before training, process hazards analysis, management of change, and accident investigations.
Process hazard analysis (PHA) must be performed by a team of experts, including engineers, chemists, operators, industrial hygienists, and other appropriate and experienced specialists. The PHA needs to include a method that fits the complexity of the process, a hazards and operability (HAZOP) study for a complex process, and for less complex processes a less rigorous process, such as what-if scenarios, checklists, failure mode and effects analysis, or fault trees.
Employers must ensure that the recommendations from the PHA are acted on in a timely manner. Every PSM process needs an updated PHA at least every five years after the initial analysis is completed.
Operating procedures that facilitate the safe operation of the plant must be documented. These instructions need to be clearly written and consistent with the process safety information. They need to cover, at a minimum, initial startup, normal operations, temporary operations, emergency shutdown, emergency operations, normal shutdown, startup after normal and emergency shutdowns, operating limits and consequences of deviations, safety and health considerations, hazardous properties of the chemicals, exposure precautions, engineering and administrative controls, quality control specifications for all chemicals, special or unique hazards, and safety control systems and functions. Safe work practices also need to be documented, such as hot work, lockout/tagout, and confined space. These operating procedures are updated frequently, with the frequency being set by the operating personnel.
An effective training program helps employees understand the hazards associated with the tasks they perform. Maintenance and operations personnel receive initial training and refresher training. Operators need to understand the hazards associated with every task, including emergency shutdowns, startups, and normal operations. Refresher training is given every three years and more often if necessary; the operators decide on the frequency of the refresher training.
Contractors are trained to perform their tasks safely to the same extent as employees. Even when selecting contractors, the employees need to consider the contractors’ safety performance in addition to their skills.
A pre-startup safety review is a special safety review that is conducted after a modification to the process or operating conditions has been made and before the startup. In this review a team of reviewers ensures that (1) the system is constructed in accordance with the design specifications, (2) the safety, maintenance, operating, and emergency procedures are in place, (3) the appropriate training is completed, and (4) the recommendations from the PHA are implemented or resolved.
The mechanical integrity section of the PSM standard ensures that the equipment, piping, relief systems, controls, and alarms are mechanically sound and operational. The requirements include (1) written procedures to maintain functioning systems, (2) training regarding preventive maintenance, (3) periodic inspections and testing based on vendor recommendations, (4) a process to correct deficiencies, and (5) a process to ensure that all equipment and spare parts are suitable.
The PSM standard ascertains that a system is in place to prepare and issue hot work permits before conducting hot work activities (welding, grinding, or using spark-producing equipment). The permit requires dates authorized for hot work, the equipment involved in the work, a system to maintain and document certification, identification of openings where sparks may drop, the types and numbers of fire extinguishers, identification of fire watches, an inspection before the work, authorization signatures, identification of flammable materials in the area, verification that the surrounding area is not explosive, verification that combustible materials are removed or covered appropriately, identification and closure of open vessels or ducts, and verification that welded walls are not flammable.
Under the management of change section of the PSM standard employees are required to develop and implement documented procedures to manage changes in the process chemistry, process equipment, and operating procedures. Before a change occurs (except for replacement-in-kind), it must be reviewed to ascertain that it will not affect the safety of the operation. After the change has been made, all the affected employees are trained, and a pre-startup review is conducted.
The PSM standard mandates incident investigation. Employers must investigate all incidents that have or could have resulted in a major release or accident within 48 hours of the event. The regulation requires an investigation team composed of people, including operators, who are knowledgeable about the system. After the investigation, the employers are required to appropriately use the investigation recommendations.
The intent of the PSM element for emergency planning and response is to require employers to respond effectively to the release of highly hazardous chemicals. Although the regulation requires this activity for companies with more than 10 employees, this element should be part of a program for even the smallest organizations that handle hazardous chemicals.
Under the audits section of the PSM standard employers are required to certify that they have evaluated their compliance with the standard at least every three years. The recommendations from the audit must be followed. The audit reports need to be retained as long as the process exists.
The trade secrets section of the PSM standard ensures that all contractors are given all the information relevant to operating in the plant safely. Some personnel may need to sign secrecy agreements before they receive this information.
EPA: Risk Management Plan
On June 20, 1996, the EPA published the Risk Management Plan (RMP) as a final rule.3 This regulation is also a response to the Bhopal accident. It is recognized by industry and the government as an excellent regulation that will reduce the number and magnitude of accidents – if it is understood and practiced as intended.
3Code of Federal Regulations, 40 CFR 68, subpart B (Washington, DC: US Government Printing Office, Jun. 20, 1996).
The RMP regulation is aimed at decreasing the number and magnitude of accidental releases of toxic and flammable substances. Although the RMP is similar to the PSM regulation in many respects, the RMP is designed to protect off-site people and the environment, whereas PSM is designed to protect on-site people. The RMP is required for plant sites that use more than a specified threshold quantity of regulated highly hazardous chemicals. The RMP is a site responsibility (the site may have several processes), whereas PSM covers every covered process on the site.
The RMP has the following elements:
• hazard assessment,
• prevention program,
• emergency response program,
• documentation that is maintained on the site and submitted to federal, state, and local authorities. This information is also shared with the local community.
The RMP document is updated when the process or chemistry changes or when a governmental audit requests an update. The first three parts of the regulation are described briefly in the following paragraphs. The fourth part, documentation, is self-explanatory.
Hazard assessment is a consequence analysis for a range of potential hazardous chemical releases, including the history of such releases at the facility. The releases must include the worst-case scenario and the more likely but significant accident release scenarios. A risk matrix can be used to characterize the worst-case and more likely scenarios.
The EPA requires the following consequence analyses: (1) A single worst-case release scenario is analyzed for all covered flammable materials on the site, and only one flammable substance is analyzed for other more likely scenarios; and (2) a single worst-case release scenario is analyzed for all toxic substances on the site, and more likely releases are analyzed for each toxic substance covered by the rule.
The worst-case scenario is based on releasing the entire contents of a vessel or piping system in a 10-minute period under worst-case meteorological conditions (F stability and 1.5 m/s wind speed). Passive mitigation measures (for example, dikes) can be used in the calculation process; therefore the release rate for liquid spills corresponds to the evaporation rate.
Alternative release cases for toxic substances cover scenarios with toxic concentrations beyond the fenceline. Alternative cases for flammable substances cover scenarios that may cause substantial damage off site and on site. The release scenarios that have a potential to reach the public are of the greatest concern. Those with no off-site potential damage are not required to be reported.
Dispersion model calculations are normally used to estimate downwind concentrations; these concentrations are the basis for determining the consequences resulting from toxicity, fires, and/or explosions. For those not interested in using dispersion models, the standard includes lookup tables for all the listed substances to help a facility determine the impact distances for specific release scenarios.
The RMP requires only an analysis of the consequence and not the probability. Therefore the results are not a true determination of risk, because risk is composed of both consequence and probability. A more detailed description of the required consequence analyses can be found elsewhere.4
4Daniel A. Crowl, “Consequence Modeling for the EPA Risk Management Plan (RMP),” Process Safety Progress (Spring 1997), pp. 1–5.
The second requirement of the RMP is a prevention program. The prevention program has 11 elements, compared to the 14 elements of the PSM standard. As shown in Table 3-4, many of these elements are duplicated. Fortunately, the EPA made a deliberate attempt to retain the same requirements wherever possible, although differences exist because the EPA and OSHA have different responsibilities. The first column in Table 3-4 lists each element of the PSM program, and the second column shows the corresponding element of the prevention program (some elements have no equivalence).
Table 3-4 Comparison of the PSM and RMP Prevention Programs

The emergency response program delineates the steps to be taken by the facility’s employees in response to accidental releases of hazardous materials. It also establishes procedures for notifying the local community and the appropriate emergency response agencies. Training is for all employees on the topics relevant to emergency response. The requirements include drills to test the plan and to evaluate its effectiveness, and the plan must be revised based on the findings of these drills.
The plan must be coordinated with local emergency response plans developed by Local Emergency Planning Committees (LEPCs) and local emergency response agencies. As with similar OSHA regulations, the Resource Conservation and Recovery Act (RCRA), and the Spill Prevention Control under the Clean Water Act, the emergency response plan must be maintained at the facility and must include descriptions of all mitigating systems.
3-2 Industrial Hygiene: Identification
One of the major responsibilities of the industrial hygienist is to identify and solve potential health problems within plants. Chemical process technology, however, is so complex that this task requires the concerted efforts of industrial hygienists, process designers, operators, laboratory personnel, and management. The industrial hygienist helps the effectiveness of the overall program by working with these plant personnel. For these reasons industrial hygiene (particularly identification) must be a part of the education process of chemists, engineers, and managers.
Many hazardous chemicals are handled safely on a daily basis within chemical plants. To achieve this operating success, all potential hazards must be identified and controlled. When toxic and/or flammable chemicals are handled, the potentially hazardous conditions may be numerous – in large plants there may be thousands. To be safe under these conditions requires discipline, skill, concern, and attention to detail.
The identification step requires a thorough study of the chemical process, operating conditions, and operating procedures. The sources of information include process design descriptions, operating instructions, safety reviews, equipment vendor descriptions, information from chemical suppliers, and information from operating personnel. The quality of this identification step is often a function of the number of resources used and the quality of the questions asked. The different resources may have different operating and technical emphases unique to pieces of equipment or specific chemicals. In this identification step it is often necessary to collate and integrate the available information to identify new potential problems resulting from the combined effects of multiple exposures.
During the identification step, the potential hazards and methods of contact are identified and recorded. As illustrated in Table 3-5, the potential hazards are numerous, especially because the listed hazards can also act in combination. This list of potential hazards together with the required data for hazard identification (see Table 3-6) is commonly used during the identification step of industrial hygiene projects.
Table 3-5 Identification of Potential Hazards1
1Olishifski, Fundamentals of Industrial Hygiene, pp. 24–26.

Table 3-6 Data Useful for Health Identification

Determining the potential for hazards to result in an accident (risk assessment) is frequently part of the identification step (see chapter 11). This list of potential hazards and their risk is used during the evaluation and control phase of the project. Resources for evaluating the hazards and developing control methods are allocated on a priority basis, giving the appropriate time and attention to the most significant hazards.
Material Safety Data Sheets
One of the most important references used during an industrial hygiene study involving toxic chemicals is the material safety data sheet (MSDS). A sample MSDS is shown in Figure 3-2. The MSDS lists the physical properties of a substance that may be required to determine the potential hazards of the substance.
Figure 3-2 Material safety data sheet. Most companies use their own MSDS format.


MSDSs are available from (1) the chemical manufacturer, (2) a commercial source, or (3) a private library developed by the chemical plant.
The industrial hygienist or safety professional must interpret the physical and toxicological properties to determine the hazards associated with a chemical. These properties are also used to develop a strategy for the proper control and handling of these chemicals.
Example 3-1
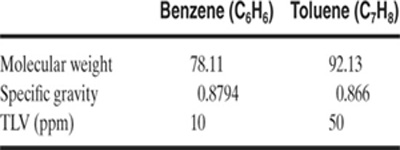
A survey of a laboratory is made and the following chemical species are identified: Sodium chlo-ride, toluene, hydrochloric acid, phenol, sodium hydroxide, benzene, and ether. Identify the potential hazards in this laboratory.
Solution
Sax5 provided the technical information required to solve this problem. The following table summarizes the results:
5R. I. Lewis, ed., Sax’s Dangerous Properties of Industrial Materials, 10th ed. (New York: Wiley, 2000).

3-3 Industrial Hygiene: Evaluation
The evaluation phase determines the extent and degree of employee exposure to toxicants and physical hazards in the workplace environment.
During the evaluation phase, the various types of existing control measures and their effectiveness are also studied. Control techniques are presented in more detail in section 3-4.
During the evaluation study, the likelihood of large and small leaks must be considered. Sudden exposures to high concentrations, through large leaks, may lead to immediate acute effects, such as unconsciousness, burning eyes, or fits of coughing. There is rarely lasting damage to individuals if they are removed promptly from the contaminated area. In this case ready access to a clean environment is important.
Chronic effects, however, arise from repeated exposures to low concentrations, mostly by small leaks. Many toxic chemical vapors are colorless and odorless (or the toxic concentration might be below the odor threshold). Small leaks of these substances might not become obvious for months or even years. There may be permanent and serious impairments from such exposures. Special attention must be directed toward preventing and controlling low concentrations of toxic gases. In these circumstances some provision for continuous evaluation is necessary; that is, continuous or frequent and periodic sampling and analysis is important.
To establish the effectiveness of existing controls, samples are taken to determine the workers’ exposure to conditions that may be harmful. If problems are evident, controls must be implemented immediately; temporary controls such as personal protective equipment can be used. Longer term and permanent controls are subsequently developed.
After the exposure data are obtained, it is necessary to compare actual exposure levels to acceptable occupational health standards, such as TLVs, PELs, or IDLH concentrations. These standards together with the actual concentrations are used to identify the potential hazards requiring better or more control measures.
Evaluating Exposures to Volatile Toxicants by Monitoring
A direct method for determining worker exposures is by continuously monitoring the air concentrations of toxicants on-line in a work environment. For continuous concentration data C(t) the TWA (time-weighted average) concentration is computed using the equation
(3-1)
![]()
where
C(t) is the concentration (in ppm or mg/m3) of the chemical in the air and
tw is the worker shift time in hours.
The integral is always divided by 8 hours, independent of the length of time actually worked in the shift. Thus, if a worker is exposed for 12 hours to a concentration of chemical equal to the TLV-TWA, then the TLV-TWA has been exceeded, because the computation is normalized to 8 hours.
Continuous monitoring is not the usual situation because most facilities do not have the necessary equipment available.
The more usual case is for intermittent samples to be obtained, representing worker exposures at fixed points in time. If we assume that the concentration Ci is fixed (or averaged) over the period of time Ti, the TWA concentration is computed by
(3-2)
![]()
All monitoring systems have drawbacks because (1) the workers move in and out of the exposed workplace and (2) the concentration of toxicants may vary at different locations in the work area. Industrial hygienists play an important role in the selection and placement of work-place monitoring equipment and the interpretation of the data.
If more than one chemical is present in the workplace, one procedure is to assume that the effects of the toxicants are additive (unless other information to the contrary is available). The combined exposures from multiple toxicants with different TLV-TWAs is determined from the equation
(3-3)
![]()
where
n is the total number of toxicants,
Ci is the concentration of chemical i with respect to the other toxicants, and
(TLV-TWA)i is the TLV-TWA for chemical species i.
If the sum in Equation 3-3 exceeds 1, then the workers are overexposed.
The mixture TLV-TWA can be computed from
(3-4)

If the sum of the concentrations of the toxicants in the mixture exceeds this amount, then the workers are overexposed.
For mixtures of toxicants with different effects (such as an acid vapor mixed with lead fume) the TLVs cannot be assumed to be additive.
Example 3-2
Air contains 5 ppm of diethylamine (TLV-TWA of 10 ppm), 20 ppm of cyclohexanol (TLV-TWA of 50 ppm), and 10 ppm of propylene oxide (TLV-TWA of 20 ppm). What is the mixture TLV-TWA and has this level been exceeded?
Solution
From Equation 3-4,

The total mixture concentration is 5 + 20 + 10 = 35 ppm. The workers are overexposed under these circumstances.
An alternative approach is to use Equation 3-3:
![]()
Because this quantity is greater than 1, the TLV-TWA has been exceeded.
Example 3-3
Determine the 8-hr TWA worker exposure if the worker is exposed to toluene vapors as follows:

Solution
Using Equation 3-2,

Because the TLV for toluene is 100 ppm, the worker is overexposed. Additional control measures need to be developed. On a temporary and immediate basis all employees working in this environment need to wear the appropriate respirators.
Example 3-4
Determine the mixture TLV at 25°C and 1 atm pressure of a mixture derived from the following liquid:
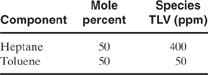
Solution
The solution requires the concentration of the heptane and toluene in the vapor phase. Assuming that the composition of the liquid does not change as it evaporates (the quantity is large), the vapor composition is computed using standard vapor-liquid equilibrium calculations. Assuming that Raoult’s and Dalton’s laws apply to this system under these conditions, the vapor composition is determined directly from the saturation vapor pressures of the pure components. Himmelblau6 provided the following data at the specified temperature:
6David M. Himmelblau, Basic Principles and Calculations in Chemical Engineering, 5th ed. (Englewood Cliffs, NJ: Prentice-Hall, 1989), p. 685.
![]()
Using Raoult’s law, the partial pressures in the vapor are determined:
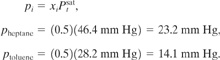
The total pressure of the toxicants is (23.2 + 14.1) = 37.3 mm Hg. From Dalton’s law the mole fractions on a toxicant basis are
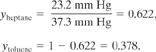
The mixture TLV is computed using Equation 3-4:
![]()
Because the vapor will always be the same concentration, the TLVs for the individual species in the mixture are
![]()
If the actual concentration exceeds these levels, more control measures will be needed. For mixtures of vapors the individual species’ TLVs in the mixture are significantly reduced from the TLVs of the pure substance.
Evaluation of Worker Exposures to Dusts
Industrial hygiene studies include any contaminant that may cause health injuries; dusts, of course, fit this category. Toxicological theory teaches that dust particles that present the greatest hazard to the lungs are normally in the respirable particle size range of 0.2–0.5 μm (see chapter 2). Particles larger than 0.5 μm are usually unable to penetrate the lungs, whereas those smaller than 0.2 μm settle out too slowly and are mostly exhaled with the air.
The main reason for sampling for atmospheric particulates is to estimate the concentrations that are inhaled and deposited in the lungs. Sampling methods and the interpretation of data relevant to health hazards are relatively complex; industrial hygienists, who are specialists in this technology, should be consulted when confronted with this type of problem.
Dust evaluation calculations are performed in a manner identical to that used for volatile vapors. Instead of using ppm as a concentration unit, mg/m3 or mppcf (millions of particles per cubic foot) is more convenient.
Example 3-5
Determine the TLV for a uniform mixture of dusts containing the following particles:
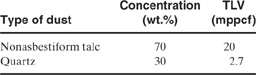
Solution
From Equation 3-4:

Special control measures will be required when the actual particle count (of the size range specified in the standards or by an industrial hygienist) exceeds 6.8 mppcf.
Evaluating Worker Exposures to Noise
Noise problems are common in chemical plants; this type of problem is also evaluated by industrial hygienists. If a noise problem is suspected, the industrial hygienist should immediately make the appropriate noise measurements and develop recommendations.
Noise levels are measured in decibels. A decibel (dB) is a relative logarithmic scale used to compare the intensities of two sounds. If one sound is at intensity I and another sound is at intensity Io, then the difference in intensity levels in decibels is given by
(3-5)
![]()
Thus a sound 10 times as intense as another has an intensity level 10 dB greater.
An absolute sound scale (in dBA for absolute decibels) is defined by establishing an intensity reference. For convenience, the hearing threshold is set at 0 dBA. Table 3-7 contains dBA levels for a variety of common activities.
Table 3-7 Sound Intensity Levels for a Variety of Common Activities1
1B. A. Plog, ed., Fundamentals of Industrial Hygiene, 3d ed. (Chicago: National Safety Council, 1988), p. 168.

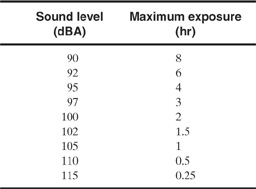
Some permissible noise exposure levels for single sources are provided in Table 3-8.
Table 3-8 Permissible Noise Exposures1
1B. A. Plog, ed., Fundamentals of Industrial Hygiene, 3d ed. (Chicago: National Safety Council, 1988), p. 176.
Noise evaluation calculations are performed identically to calculations for vapors, except that dBA is used instead of ppm and hours of exposure is used instead of concentration.
Example 3-6
Determine whether the following noise level is permissible with no additional control features:
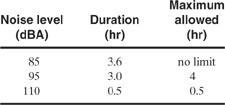
Solution
From Equation 3-3:
![]()
Because the sum exceeds 1.0, employees in this environment are immediately required to wear ear protection. On a longer-term basis, noise reduction control methods should be developed for the specific pieces of equipment with excessive noise levels.
Estimating Worker Exposures to Toxic Vapors
The best procedure to determine exposures to toxic vapors is to measure the vapor concentrations directly. For design purposes estimates of vapor concentrations are frequently required in enclosed spaces, above open containers, where drums are filled, and in the area of spills.
Consider the enclosed volume shown in Figure 3-3. This enclosure is ventilated by a constant volume airflow. Volatile vapors are evolved within the enclosure. An estimate of the concentration of volatile in the air is required.
Figure 3-3 Mass balance for volatile vapor in an enclosure.
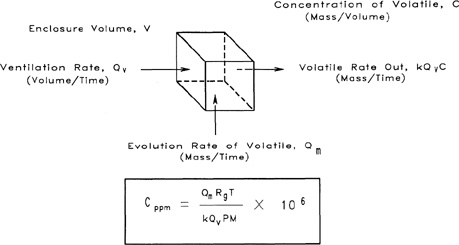
Let
C be the concentration of volatile vapor in the enclosure (mass/volume),
V be the volume of the enclosure (volume),
Qv be the ventilation rate (volume/time),
k be the nonideal mixing factor (unitless), and
Qm be the evolution rate of volatile material (mass/time).
The nonideal mixing factor k accounts for conditions in the enclosure that are less than well mixed. It follows that
Total mass of volatile in volume | = | VC, |
Accumulation of mass of volatile | = |
|
Mass rate of volatile material resulting from evolution | = | Qm, |
Mass rate of volatile material out | = | KQvC. |
Because accumulation equals mass in minus mass out, the dynamic mass balance on the volatile species is
(3-6)
![]()
At steady state the accumulation term is 0, and Equation 3-6 is solved for C:
(3-7)
![]()
Equation 3-7 is converted to the more convenient concentration units of ppm by direct application of the ideal gas law. Let m represent mass, r represent density, and the subscripts v and b denote the volatile and bulk gas species, respectively. Then:
(3-8)
![]()
where
Rg is the ideal gas constant,
T is the absolute ambient temperature,
P is the absolute pressure, and
M is the molecular weight of the volatile species.
The term mv/Vb is identical to the concentration of volatile computed using Equation 3-7. Substituting Equation 3-7 into Equation 3-8 yields
(3-9)
![]()
Equation 3-9 is used to determine the average concentration (in ppm) of any volatile species in an enclosure given a source term Qm and a ventilation rate Qv. It can be applied to the following types of exposures: a worker standing near a pool of volatile liquid, a worker standing near an opening to a storage tank, or a worker standing near an open container of volatile liquid.
Equation 3-9 includes the following important assumptions:
• The calculated concentration is an average concentration in the enclosure. Localized conditions could result in significantly higher concentrations; workers directly above an open container might be exposed to higher concentrations.
• A steady-state condition is assumed; that is, the accumulation term in the mass balance is zero.
The nonideal mixing factor varies from 0.1 to 0.5 for most practical situations.7 For perfect mixing k = 1.
7R. Craig Matthiessen, “Estimating Chemical Exposure Levels in the Workplace,” Chemical Engineering Progress (April 1986), p. 30.
Example 3-7
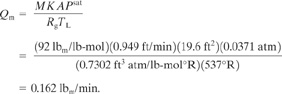
An open toluene container in an enclosure is weighed as a function of time, and it is determined that the average evaporation rate is 0.1 g/min. The ventilation rate is 100 ft3/min. The temperature is 80°F and the pressure is 1 atm. Estimate the concentration of toluene vapor in the enclosure, and compare your answer to the TLV for toluene of 50 ppm.
Solution
Because the value of k is not known directly, it must be used as a parameter. From Equation 3-9
![]()
From the data provided
Qm = 0.1 g/min = 2.20 × 10⁻⁴ lbm/min,
Rg = 0.7302 ft3 atm/lb-mol °R,
T = 80°F = 540°R,
Qv = 100 ft3/min,
M = 92 lbm/lb-mol,
P = 1 atm.
Substituting into the equation for kCppm:

Because k varies from 0.1 to 0.5, the concentration is expected to vary from 18.9 ppm to 94.3 ppm. Actual vapor sampling is recommended to ensure that the TLV is not exceeded.
Estimating the Vaporization Rate of a Liquid
Liquids with high saturation vapor pressures evaporate faster. As a result, the evaporation rate (mass/time) is expected to be a function of the saturation vapor pressure. In reality, for vaporization into stagnant air, the vaporization rate is proportional to the difference between the saturation vapor pressure and the partial pressure of the vapor in the stagnant air; that is
(3-10)
Qmα(Psat – p),
where
Psat is the saturation vapor pressure of the pure liquid at the temperature of the liquid and
p is the partial pressure of the vapor in the bulk stagnant gas above the liquid.
A more generalized expression for the vaporization rate is available8:
8Steven R. Hanna and Peter J. Drivas, Guidelines for the Use of Vapor Cloud Dispersion Models (New York: American Institute of Chemical Engineers, 1987).
(3-11)
![]()
where
Qm is the evaporation rate (mass/time),
M is the molecular weight of the volatile substance,
K is a mass transfer coefficient (length/time) for an area A,
Rg is the ideal gas constant, and
TL is the absolute temperature of the liquid.
For many situations, Psat >> p , and Equation 3-11 is simplified to
(3-12)
![]()
Equation 3-12 is used to estimate the vaporization rate of volatile from an open vessel or from a spill of liquid.
The vaporization rate or source term, determined by Equation 3-12, is used in Equation 3-9 to estimate the concentration (in ppm) of a volatile in an enclosure resulting from evaporation of a liquid:
(3-13)
![]()
For most situations T = TL, and Equation 3-13 is simplified to
(3-14)
![]()
The gas mass transfer coefficient is estimated using the relationship9
9Louis J. Thibodeaux, Chemodynamics (New York: Wiley, 1979), p. 85.
(3-15)
K = aD2/3,
where
a is a constant and
D is the gas-phase diffusion coefficient.
Equation 3-15 is used to determine the ratio of the mass transfer coefficients between the species of interest K and a reference species Ko:
(3-16)
![]()
The gas-phase diffusion coefficients are estimated from the molecular weights M of the species10:
10Gordon M. Barrow, Physical Chemistry, 2d ed. (New York: McGraw-Hill, 1966), p. 19.
(3-17)
![]()
Equation 3-17 is combined with Equation 3-16, giving
(3-18)
![]()
Water is most frequently used as a reference substance; it has a mass transfer coefficient11 of 0.83 cm/s.
11Matthiessen, “Estimating Chemical Exposure,” p. 33.
Example 3-8
A large open tank with a 5-ft diameter contains toluene. Estimate the evaporation rate from this tank assuming a temperature of 77°F and a pressure of 1 atm. If the ventilation rate is 3000 ft3/min, estimate the concentration of toluene in this workplace enclosure.
Solution
The molecular weight of toluene is 92. The mass transfer coefficient is estimated from Equation 3-18 using water as a reference:
![]()
The saturation vapor pressure is given in Example 3-4:
![]()
The pool area is
![]()
The evaporation rate is computed using Equation 3-12:
The concentration is estimated using Equation 3-14 with k as a parameter:
The concentration will range from 460 ppm to 2300 ppm, depending on the value of k. Because the TLV for toluene is 50 ppm, additional ventilation is recommended, or the amount of exposed surface area should be reduced. The amount of ventilation required to reduce the worst-case concentration (2300 ppm) to 50 ppm is
![]()
This represents an impractical level of general ventilation. Potential solutions to this problem include containing the toluene in a closed vessel or using local ventilation at the vessel opening.
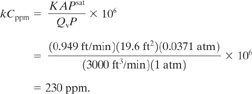
Estimating Worker Exposures during Vessel Filling Operations
For vessels being filled with liquid, volatile emissions are generated from two sources, as shown in Figure 3-4. These sources are
Figure 3-4 Evaporation and displacement from a filling vessel.
• evaporation of the liquid, represented by Equation 3-14, and
• displacement of the vapor in the vapor space by the liquid filling the vessel.
The net generation of volatile is the sum of the two sources:
(3-19)
![]()
where
(Qm)1 represents the source resulting from evaporation and
(Qm)2 represents the source resulting from displacement.
The source term (Qm)1 is computed using Equation 3-12. (Qm)2 is determined by assuming that the vapor is completely saturated with the volatile. An adjustment is introduced later for less than saturated conditions. Let
Vc be the volume of the container (volume),
rf be the constant filling rate of the vessel (time-1),
Psat be the saturation vapor pressure of the volatile liquid, and
TL be the absolute temperature of the container and liquid.
It follows that rfVc is the volumetric rate of bulk vapor being displaced from the drum (volume/time). Also, if ρv is the density of the volatile vapor, rfVcρv is the mass rate of volatile displaced from the container (mass/time). Using the ideal gas law,
(3-20)
![]()
and it follows that
(3-21)
![]()
Equation 3-21 can be modified for container vapors that are not saturated with the volatile. Let φ represent this adjustment factor; then,
(3-22)
![]()
For splash filling (filling from the top of a container with the liquid splashing to the bottom), ϕ = 1. For subsurface filling12 (by a dip leg to the bottom of the tank), ϕ = 0.5.
12Matthiessen, “Estimating Chemical Exposure,” p. 33.
The net source term resulting from filling is derived by combining Equations 3-12 and 3-22 with Equation 3-19:
(3-23)
![]()
This source term is substituted into Equation 3-9 to compute the vapor concentration (in ppm) in an enclosure resulting from a filling operation. The assumption that T = T L is also invoked. The result is
(3-24)
![]()
For many practical situations the evaporation term KA is much smaller than the displacement term and can be neglected.
Example 3-9
Railroad cars are being splash-filled with toluene. The 10,000-gal cars are being filled at the rate of one every 8 hr. The filling hole in the tank car is 4 in. in diameter. Estimate the concentration of toluene vapor as a result of this filling operation. The ventilation rate is estimated at 3000 ft3/min. The temperature is 77°F and the pressure is 1 atm.
Solution
The concentration is estimated using Equation 3-24. From Example 3-8, K = 0.949 ft/min and Psat 0.0371 atm. The area of the filling hole is
![]()
Thus
![]()
The filling rate rf, is
![]()
For splash filling the nonideal filling factor ϕ is 1.0. The displacement term in Equation 3-24 is
![]()
As expected, the evaporation term is small compared to the displacement term. The concentration is computed from Equation 3-24, using k as a parameter:

The actual concentration could range from 69 ppm to 344 ppm, depending on the value of k. Sampling to ensure that the concentration is below 50 ppm is recommended. For subsurface filling, ϕ = 0.5, and the concentration range is reduced to 35–172 ppm.
3-4 Industrial Hygiene: Control
After potential health hazards are identified and evaluated, the appropriate control techniques must be developed and installed. This requires the application of appropriate technology for reducing workplace exposures.
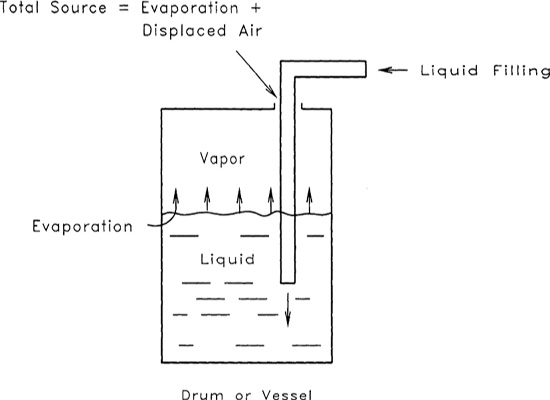
The types of control techniques used in the chemical industry are illustrated in Table 3-9.
Table 3-9 Chemical Plant Control Techniques
Designing control methods is an important and creative task. During the design process, the designer must pay particular attention to ensure that the newly designed control technique provides the desired control and that the new control technique itself does not create another hazard, sometimes even more hazardous than the original problem.
The two major control techniques are environmental controls and personal protection. Environmental control reduces exposure by reducing the concentration of toxicants in the work-place environment. This includes enclosure, local ventilation, dilution ventilation, wet methods, and good housekeeping, as discussed previously. Personal protection prevents or reduces exposure by providing a barrier between the worker and the workplace environment. This barrier is usually worn by the worker, hence the designation “personal.” Typical types of personal protective equipment are listed in Table 3-10.
Table 3-10 Personal Protective Equipment, Not Including Respirators1

1Lab Safety Supply Catalog (Janesvelle, WI: Lab Safety Supply Inc.). Manufacturers’ technical specifications must always be consulted.
Respirators
Respirators are routinely found in chemical laboratories and plants. Respirators should be used only
• on a temporary basis, until regular control methods can be implemented;
• as emergency equipment, to ensure worker safety in the event of an accident;
• as a last resort, in the event that environmental control techniques are unable to provide satisfactory protection.
Respirators always compromise worker ability. A worker with a respirator is unable to perform or respond as well as a worker without one. Various types of respirators are listed in Table 3-11.
Table 3-11 Respirators Useful to Chemical Industry

1MSA Home Page 2000, Air-purifying Respirators, Conventionally Maintained, Dustfoe® Respirator (Pittsburgh, PA: MSA International).
2MSA Home Page 2000, Air-purifying Respirators, Conventionally Maintained, Comfo Classic.
3MSA Home Page 2000, Air-purifying Respirators, Conventionally Maintained, Replacement Canisters for Gas Masks.
4MSA Home Page 2000, Supplied Air Respirators, Self-Contained Breathing Apparatus.
Respirators can be used improperly and/or can be damaged to the extent that they do not provide the needed protection. OSHA and NIOSH have developed standards for using respirators,13 including fit testing (to ensure that the device does not leak excessively), periodic inspections (to ensure that the equipment works properly), specified use applications (to ensure that the equipment is used for the correct job), training (to ensure that it is used properly), and record keeping (to ensure that the program is operating efficiently). All industrial users of respirators are legally bound to understand and fulfill these OSHA requirements.
13NIOSH Respirator Decision Logic, DHHS-NIOSH Publication 87-1-8 (Washington, DC: US Department of Health and Human Services, May 1987).
Ventilation
For environmental control of airborne toxic material the most common method of choice is ventilation, for the following reasons:
• Ventilation can quickly remove dangerous concentrations of flammable and toxic materials.
• Ventilation can be highly localized, reducing the quantity of air moved and the equipment size.
• Ventilation equipment is readily available and can be easily installed.
• Ventilation equipment can be added to an existing facility.
The major disadvantage of ventilation is the operating cost. Substantial electrical energy may be needed to drive the potentially large fans, and the cost to heat or cool the large quantities of fresh air can be large. These operating costs need to be considered when evaluating alternatives.
Ventilation is based on two principles: (1) dilute the contaminant below the target concentration, and (2) remove the contaminant before workers are exposed.
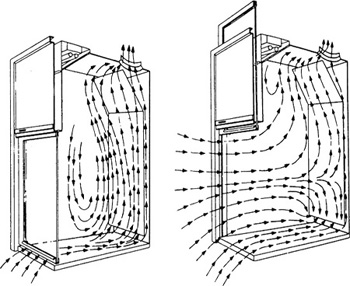
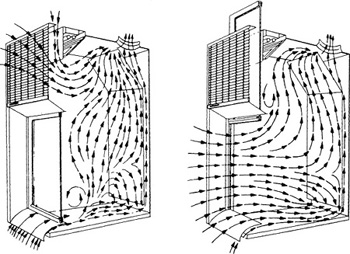
Ventilation systems are composed of fans and ducts. The fans produce a small pressure drop (less than 0.1 psi) that moves the air. The best system is a negative pressure system, with the fans located at the exhaust end of the system, pulling air out. This ensures that leaks in the system draw air in from the workplace rather than expel contaminated air from the ducts into the workplace. This is shown in Figure 3-5.
Figure 3-5 The difference between a positive and a negative pressure ventilation system. The negative pressure system ensures that contaminants do not leak into workplace environments.

There are two types of ventilation techniques: local and dilution ventilation.
Local Ventilation
The most common example of local ventilation is the hood. A hood is a device that either completely encloses the source of contaminant and/or moves the air in such a fashion as to carry the contaminant to an exhaust device. There are several types of hoods:
• An enclosed hood completely contains the source of contaminant.
• An exterior hood continuously draws contaminants into an exhaust from some distance away.
• A receiving hood is an exterior hood that uses the discharge motion of the contaminant for collection.
• A push-pull hood uses a stream of air from a supply to push contaminants toward an exhaust system.
The most common example of an enclosed hood is the laboratory hood. A standard laboratory utility hood is shown in Figure 3-6. Fresh air is drawn through the window area of the hood and is removed out the top through a duct. The airflow profiles within the hood are highly dependent on the location of the window sash. It is important to keep the sash open a few inches, minimally, to ensure adequate fresh air. Likewise, the sash should never be fully opened because contaminants might escape. The baffle at the rear of the hood ensures that contaminants are removed from the working surface and the rear lower corner.
Figure 3-6 Standard utility laboratory hood. Airflow patterns and control velocity are dependent on sash height. Source: N. Irving Sax, Dangerous Properties of Industrial Materials, 4th ed. (New York: Van Nostrand Reinhold, 1975), p. 74. Reprinted by permission of John Wiley & Sons, Inc.
Another type of laboratory hood is the bypass hood, shown in Figure 3-7. For this design bypass air is supplied through a grill at the top of the hood. This ensures the availability of fresh air to sweep out contaminants in the hood. The bypass air supply is reduced as the hood sash is opened.
Figure 3-7 Standard bypass laboratory hood. The bypass air is controlled by the height of the sash. Source: N. Irving Sax, Dangerous Properties of Industrial Materials, 4th ed. (New York: Van Nostrand Reinhold, 1975), p. 75. Reprinted by permission of John Wiley & Sons, Inc.
The advantages of enclosed hoods are that they
• completely eliminate exposure to workers,
• require minimal airflow,
• provide a containment device in the event of fire or explosion, and
• provide a shield to the worker by means of a sliding door on the hood.
The disadvantages of hoods are that they
• limit workspace and
• can be used only for small, bench-scale or pilot plant equipment.
Most hood calculations assume plug flow. For a duct of cross-sectional area A and average air velocity ū (distance/time), the volume of air moved per unit time Qv is computed from
(3-25)
![]()
For a rectangular duct of width W and length L, Qv is determined using the equation
(3-26)
![]()
Consider the simple box-type enclosed hood shown in Figure 3-8. The design strategy is to provide a fixed velocity of air at the opening of the hood. This face or control velocity (referring to the face of the hood) ensures that contaminants do not exit from the hood.
Figure 3-8 Determining the total volumetric air flow rate for a box-type hood. For general operation a control velocity of between 80 and 120 feet per minute (fpm) is desired.
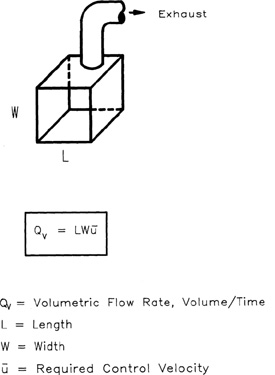
The required control velocity depends on the toxicity of the material, the depth of the hood, and the evolution rate of the contaminant. Shallower hoods need higher control velocities to prevent contaminants from exiting the front. However, experience has shown that higher velocities can lead to the formation of a turbulent eddy from the bottom of the sash; backflow of contaminated air is possible. For general operation a control velocity between 80 and 120 feet per minute (fpm) is suggested.
Instruments are available for measuring the airflow velocity at specific points of the hood window opening. Testing is an OSHA requirement.
The airflow velocity is a function of the sash height and the blower speed. Arrows are frequently used to indicate the proper sash height to ensure a specified face velocity.
Design equations are available for a wide variety of hood and duct shapes.14
14Industrial Ventilation: A Manual of Recommended Practice, 19th ed. (Cincinnati: American Conference of Governmental Industrial Hygienists, 1986).
Other types of local ventilation methods include “elephant trunks” and free-hanging canopies and plenums. The elephant trunk is simply a flexible vent duct that is positioned near a source of contaminant. It is most frequently used for loading and unloading toxic materials from drums and vessels. Free-hanging canopies and plenums can be either fixed in position or attached to a flexible duct to enable movement. These methods will most likely expose workers to toxicants, but in diluted amounts.
Dilution Ventilation
If the contaminant cannot be placed in a hood and must be used in an open area or room, dilution ventilation is necessary. Unlike hood ventilation, where the airflow prevents worker exposure, dilution ventilation always exposes the worker but in amounts diluted by fresh air. Dilution ventilation always requires more airflow than local ventilation; operating expenses can be substantial.
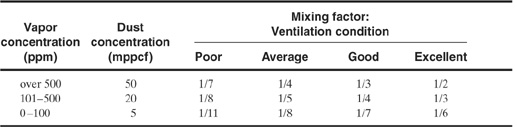
Equations 3-9, 3-12, and 3-14 are used to compute the ventilation rates required. Table 3-12 lists values for k, the nonideal mixing factor used with these equations.
Table 3-12 Nonideal Mixing Factor k for Various Dilution Ventilation Conditions1
1N. Irving Sax, Dangerous Properties, 6th ed., p. 29. The values reported here are the reciprocal of Sax’s values.
For exposures to multiple sources the dilution air requirement is computed for each individual source. The total dilution requirement is the sum of the individual dilution requirements.
The following restrictions should be considered before implementing dilution ventilation:
• The contaminant must not be highly toxic.
• The contaminant must be evolved at a uniform rate.
• Workers must remain a suitable distance from the source to ensure proper dilution of the contaminant.
• Scrubbing systems must not be required to treat the air before exhaust into the environment.
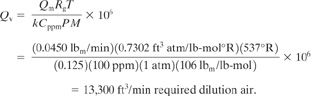
Example 3-10
Xylene is used as a solvent in paint. A certain painting operation evaporates an estimated 3 gal of xylene in an 8-hr shift. The ventilation quality is rated as average. Determine the quantity of dilution ventilation air required to maintain the xylene concentration below 100 ppm, the TLV-TWA. Also, compute the air required if the operation is carried out in an enclosed hood with an opening of 50 ft2 and a face velocity of 100 ft/min. The temperature is 77°F and the pressure is 1 atm. The specific gravity of the xylene is 0.864, and its molecular weight is 106.
Solution
The evaporation rate of xylene is
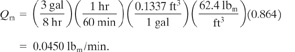
From Table 3-12, for average ventilation and a vapor concentration of 100 ppm, k = 1/8 = 0.125. With Equation 3-9, we solve for Qv:
For a hood with an open area of 50 ft2, using Equation 3-25 and assuming a required control velocity of 100 fpm, we get
![]()
The hood requires significantly less airflow than dilution ventilation and prevents worker exposure completely.
Suggested Reading
Industrial Hygiene
Lewis J. Cralley and Lester V. Cralley, eds., Industrial Hygiene Aspects of Plant Operations, v. 1–3 (New York: Macmillan, 1984).
J. B. Olishifski, ed., Fundamentals of Industrial Hygiene, 2d ed. (Chicago: National Safety Council, 1979).
B. A. Plog, ed., Fundamentals of Industrial Hygiene, 3d ed. (Chicago: National Safety Council, 1988).
N. Irving Sax, Dangerous Properties of Industrial Materials, 6th ed. (New York: Van Nostrand Reinhold, 1984), sec. 2 and 3.
Richard A. Wadden and Peter A. Scheff, eds., Engineering Design for the Control of Workplace Hazards (New York: McGraw-Hill, 1987).
A. C. Wentz, Safety, Health, and Environmental Protection (Boston: WCB/McGraw-Hill, 1998).
Ventilation
Industrial Ventilation: A Manual of Recommended Practice, 19th ed. (Cincinnati: American Conference of Governmental Industrial Hygienists, 1986).
Wadden and Scheff, Engineering Design, ch. 5.
Problems
3-1. Determine (a) whether the following chemicals are covered under the PSM regulation (29 CFR 1910.119) and (b) their threshold quantities: acrolein, hydrogen chloride, phosgene, propane, ethylene oxide, and methanol.
3-2. Determine (a) whether the following chemicals are covered under the PSM regulation and (b) their threshold quantities: ammonia (anhydrous), hydrogen selenide, formalde-hyde, methane, and ethanol.
3-3. Determine whether the following chemicals (a) are covered under the RMP (40 CFR 68.130) and (b) are listed as toxic or flammable. If they are listed, (c) what are their threshold quantities? The chemicals are acrolein, hydrogen chloride, phosgene, propane, ethylene oxide, and methanol.
3-4. Determine whether the following chemicals (a) are covered under the RMP and (b) are listed as toxic or flammable. If they are listed, (c) what are their threshold quantities? The chemicals are ammonia (anhydrous), hydrogen selenide, formaldehyde, methane, and ethanol.
3-5. In reviewing the results of Problems 3-1 to 3-4, describe why the threshold quantities are lower for the PSM-regulated chemicals than for the RMP-regulated chemicals.
3-6. Review the details of the RMP (40 CFR 68), and describe the three program categories that are used for consequence modeling.
3-7. Review the details of the RMP (40 CFR 68), and describe the endpoint parameters for consequence analyses for the worst-case scenarios.
3-8. Review the details of the RMP (40 CFR 68), and describe the endpoint parameters for consequence analyses for the alternative case scenarios.
3-9. Review the RMP (40 CFR 68) to determine the conditions that need to be used for dispersion modeling for the worst-case scenarios.
3-10. Review the RMP (40 CFR 68) to determine the conditions that need to be used for dispersion modeling for the alternative case scenarios.
3-11. Describe several typical alternative case scenarios for an RMP study.
3-12. A process plant inventories the following chemicals: vinyl chloride, methyl ethyl ketone, ethylene oxide, styrene, and cyclohexane. Determine the hazards associated with these chemicals. What additional information might you request to perform an appropriate assessment of the risk associated with these chemicals?
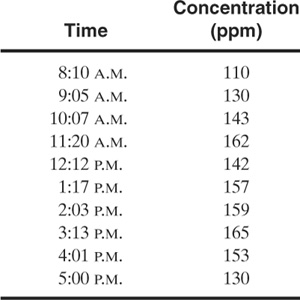
3-13. The TLV-TWA for a substance is 150 ppm. A worker begins a work shift at 8 A.M. and completes the shift at 5 P.M. A one-hour lunch break is included between 12 noon and 1 P.M., where it can be assumed that no exposure to the chemical occurs.
The data were taken in the work area at the times indicated. Has the worker exceeded the TLV specification?
3-14. Air contains 4 ppm of carbon tetrachloride and 25 ppm of 1,1-dichloroethane. Compute the mixture TLV, and determine whether this value has been exceeded.
3-15. A substance has a TLV-TWA of 200 ppm, a TLV-STEL of 250 ppm, and a TLV-C of 300 ppm. The data in the following table were taken in a work area:
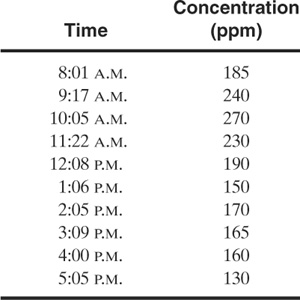
A worker on an 8-hour shift is exposed to this toxic vapor. Is the exposure within compliance? If not, what are the violations? Assume that the worker is at lunch between the hours of 12 noon to 1 P.M. and is not exposed to the chemical during that time.
3-16. Sax15 provided the following working equation for determining the dilution air requirements resulting from evaporation of a solvent:
15N. I. Sax, Dangerous Properties of Industrial Materials, 6th ed. (New York: Van Nostrand Reinhold, 1984), p. 28.
![]()
where CFM is the ft3/min of dilution air required. Show that this equation is the same as Equation 3-9. What assumptions are inherent in this equation?
Problems 3-17 through 3-22 apply to toluene and benzene. The following data are available for these materials:
Saturation vapor pressures:
![]()
where Psat is the saturation vapor pressure in mm Hg, T is the temperature in K, and A, B, and C are the constants, given by the following:
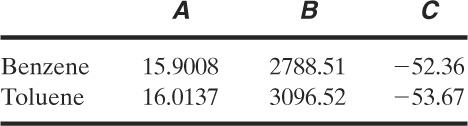
3-17. Compute the concentration (in ppm) of the saturated vapor with air above a solution of pure toluene. Compute the concentration (in ppm) of the equilibrium vapor with air above a solution of 50 mol % toluene and benzene. The temperature is 80°F and the total pressure is 1 atm.
3-18. Compute the density of pure air and the density of air contaminated with 100 ppm benzene. Do the densities of these two gases differ enough to ensure a higher concentration on floors and other low spots? The temperature is 70°F and the pressure is 1 atm.
3-19. Equations 3-12 and 3-12 represent the evaporation of a pure liquid. Modify these equations to represent the evaporation of a mixture of ideal miscible liquids.
3-20. Benzene and toluene form an ideal liquid mixture. A mixture composed of 50 mol % benzene is used in a chemical plant. The temperature is 80°F, and the pressure is 1 atm.
a. Determine the mixture TLV.
b. Determine the evaporation rate per unit area for this mixture.
c. A drum with a 2-in-diameter bung is used to contain the mixture. Determine the ventilation rate required to maintain the vapor concentration below the TLV. The ventilation quality within the vicinity of this operation is average.
3-21. A drum contains 42 gal of toluene. If the lid of the drum is left open (lid diameter = 3 ft), determine the time required to evaporate all the toluene in the drum. The temperature is 85°F. Estimate the concentration of toluene (in ppm) near the drum if the local ventilation rate is 1000 ft3/min. The pressure is 1 atm.
3-22. A certain plant operation evaporates 2 pint/hr of toluene and 1 pint/8-hr shift of benzene. Determine the ventilation rate required to maintain the vapor concentration below the TLV. The temperature is 80°F, and the pressure is 1 atm.
3-23. Equations 3-12 and 3-12 can be applied to nonenclosed exposures by using an effective ventilation rate. The effective ventilation rate for outside exposures has been estimated at 3000 ft3/min.16
16Matthieson, “Estimating Chemical Exposure,” p. 33.
A worker is standing near an open passageway of a tank containing 2-butoxyethanol (molecular weight = 118). The passageway area is 7 ft2. Estimate the concentration (in ppm) of the vapor near the passageway opening. The vapor pressure of the 2-butoxyethanol is 0.6 mm Hg.
3-24. Fifty-five-gallon drums are being filled with 2-butoxyethanol. The drums are being splash-filled at the rate of 30 drums per hour. The bung opening through which the drums are being filled has an area of 8 cm2. Estimate the ambient vapor concentration if the ventilation rate is 3000 ft3/min. The vapor pressure of 2-butoxyethanol is 0.6 mm Hg under these conditions.
3-25. A gasoline tank in a standard automobile contains about 14 gal of gasoline and can be filled in about 3 min. The molecular weight of gasoline is approximately 94, and its vapor pressure at 77°F is 4.6 psi. Estimate the concentration (in ppm) of gasoline vapor as a result of this filling operation. Assume a ventilation rate of 3000 ft3/min. The TLV for gasoline is 300 ppm.
3-26. A 6-in-diameter elephant trunk is used to remove contaminants near the open bung of a drum during a filling operation. The air velocity required at the end of the elephant trunk is 100 ft/min. Compute the volumetric flow rate of air required.
3-27. To reduce air pollution, gasoline filling stations are installing scavenger systems to remove the gasoline vapors ejected from the automobile tank during the filling operation. This is accomplished by an elephant trunk ventilation system installed as part of the filler hose.
Assume an average automobile tank size of 14 gal. If the vapor in the tank is saturated with gasoline vapor at a vapor pressure of 4.6 psi at these conditions, how many gallons of gasoline are recovered free for the station owner with each fill-up? For 10,000 gal of delivered gasoline, how many gallons are recovered? The molecular weight of gasoline is about 94, and its liquid specific gravity is 0.7.
3-28. Normal air contains about 21% oxygen by volume. The human body is sensitive to reductions in oxygen concentration; concentrations below 19.5% are dangerous, and concentrations below 16% can cause distress. Respiratory equipment without self-contained air supplies must never be used in atmospheres below 19.5% oxygen.
A storage tank of 1000 ft3 capacity must be cleaned before reuse. Proper procedures must be used to ensure that the oxygen concentration of the air within the tank is adequate.
Compute the cubic feet of additional nitrogen at 77°F and 1 atm that will reduce the oxygen concentration within the tank to (a) 19.5% and (b) 16%. Oxygen concentrations within tanks and enclosures can be reduced significantly by small amounts of inert elements!
3-29. A laboratory hood has an opening 4 ft in length by 3 ft in height. The hood depth is 18 in. This hood will be used for an operation involving trichloroethylene (TCE) (TLVTWA: 50 ppm). The TCE will be used in liquid form at room temperature. Determine an appropriate control velocity for this hood, and calculate the total air flow rate.
3-30. It is desired to operate the hood of Problem 3-29 so that the vapor concentration in the hood plenum is below the lower explosion limit of 12.5% by volume. Estimate the minimum control velocity required to achieve this objective. The amount of TCE evaporated within the hood is 5.3 lb per hour. The molecular weight of TCE is 131.4. The temperature is 70°F and the pressure is 1 atm.