3 Rectangular Coordinate System and Graphs
In This Chapter
1.3 The Rectangular Coordinate System

In Section 3.3 we will see that parallel lines have the same slope.
A Bit of History Every student of mathematics pays the French mathematician René Descartes (1596-1650) homage whenever he or she sketches a graph. Descartes is considered the inventor of analytic geometry, which is the melding of algebra and geometry–at the time thought to be completely unrelated fields of mathematics. In analytic geometry an equation involving two variables could be interpreted as a graph in a two-dimensional coordinate system embedded in a plane. The rectangular or Cartesian coordinate system is named in his honor. The basic tenets of analytic geometry were set forth in La Géométrie, published in 1637. The invention of the Cartesian plane and rectangular coordinates contributed significantly to the subsequent development of calculus by its co-inventors Isaac Newton (1643-1727) and Gottfried Wilhelm Leibniz (1646-1716).
René Descartes was also a scientist and wrote on optics, astronomy, and meteorology. But beyond his contributions to mathematics and science, Descartes is also remembered for his impact on philosophy. Indeed, he is often called the father of modern philosophy and his book Meditations on First Philosophy continues to be required reading to this day at some universities. His famous phrase cogito ergo sum (I think, therefore I am) appears in his Discourse on the Method and Principles of Philosophy. Although he claimed to be a fervent Catholic, the Church was suspicious of Descartes' philosophy and writings on the soul, and placed all his works on the Index of Prohibited Books in 1693.
3.1 The Rectangular Coordinate System
![]() Introduction In Section 1.2 we saw that each real number can be associated with exactly one point on the number, or coordinate, line. We now examine a correspondence between points in a plane and ordered pairs of real numbers.
Introduction In Section 1.2 we saw that each real number can be associated with exactly one point on the number, or coordinate, line. We now examine a correspondence between points in a plane and ordered pairs of real numbers.
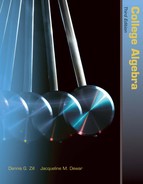
![]() The Coordinate Plane A rectangular coordinate system is formed by two perpendicular number lines that intersect at the point corresponding to the number 0 on each line. This point of intersection is called the origin and is denoted by the symbol O. The horizontal and vertical number lines are called the x-axis and the y-axis, respectively. These axes divide the plane into four regions, called quadrants, which are numbered as shown in FIGURE 3.1.1[a]. As we can see in Figure 3.1.1(b), the scales on the x- and y-axes need not be the same. Throughout this text, if tick marks are not labeled on the coordinates axes, as in Figure 3.1.1(a), then you may assume that one tick corresponds to one unit. A plane containing a rectangular coordinate system is called an xy-plane, a coordinate plane, or simply 2-space.
The Coordinate Plane A rectangular coordinate system is formed by two perpendicular number lines that intersect at the point corresponding to the number 0 on each line. This point of intersection is called the origin and is denoted by the symbol O. The horizontal and vertical number lines are called the x-axis and the y-axis, respectively. These axes divide the plane into four regions, called quadrants, which are numbered as shown in FIGURE 3.1.1[a]. As we can see in Figure 3.1.1(b), the scales on the x- and y-axes need not be the same. Throughout this text, if tick marks are not labeled on the coordinates axes, as in Figure 3.1.1(a), then you may assume that one tick corresponds to one unit. A plane containing a rectangular coordinate system is called an xy-plane, a coordinate plane, or simply 2-space.
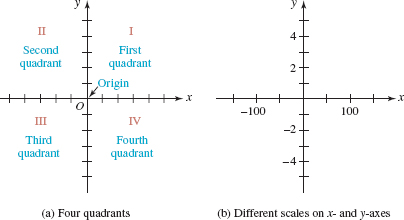
FIGURE 3.1.1 Coordinate plane
The rectangular coordinate system and the coordinate plane are also called the Cartesian coordinate system and the Cartesian plane after the famous French mathematician and philosopher René Descartes (1596-1650).
![]() Coordinates of a Point Let P represent a point in the coordinate plane. We associate an ordered pair of real numbers with P by drawing a vertical line from P to the x-axis and a horizontal line from P to the y axis. If the vertical line intersects the x-axis at the number a and the horizontal line intersects the y-axis at the number b, we associate the ordered pair of real numbers (a, b) with the point. Conversely, to each ordered pair (a, b) of real numbers, there corresponds a point P in the plane. This point lies at the intersection of the vertical line through a on the x-axis and the horizontal line passing through b on the y-axis. Here after, we will refer to an ordered pair as a point and denote it by either P(a, b) or (a, b).* The number a is the x-coordinate of the point and the number b is the y-coordinate of the point and we say that P has coordinates (a, b). For example, the coordinates of the origin are (0, 0). See FIGURE 3.1.2.
Coordinates of a Point Let P represent a point in the coordinate plane. We associate an ordered pair of real numbers with P by drawing a vertical line from P to the x-axis and a horizontal line from P to the y axis. If the vertical line intersects the x-axis at the number a and the horizontal line intersects the y-axis at the number b, we associate the ordered pair of real numbers (a, b) with the point. Conversely, to each ordered pair (a, b) of real numbers, there corresponds a point P in the plane. This point lies at the intersection of the vertical line through a on the x-axis and the horizontal line passing through b on the y-axis. Here after, we will refer to an ordered pair as a point and denote it by either P(a, b) or (a, b).* The number a is the x-coordinate of the point and the number b is the y-coordinate of the point and we say that P has coordinates (a, b). For example, the coordinates of the origin are (0, 0). See FIGURE 3.1.2.
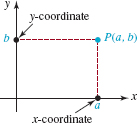
FIGURE 3.1.2 Point with coordinates (a, b)
FIGURE 3.1.3 Algebraic signs of coordinates in the four quadrants
The algebraic signs of the x-coordinate and the y-coordinate of any point (x, y) in each of the four quadrants are indicated in FIGURE 3.1.3. Points on either of the two axes are not considered to be in any quadrant. Since a point on the x-axis has the form (x, 0), an equation that describes the x-axis is y = 0. Similarly, a point on the y-axis has the form (0, y) and so an equation of the y-axis is x = 0. When we locate a point in the coordinate plane corresponding to an ordered pair of numbers and represent it using a solid dot, we say that we plot or graph the point.
EXAMPLE 1 Plotting Points
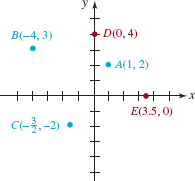
Plot the points ![]() and E(3.5, 0). Specify the quadrant in which each point lies.
and E(3.5, 0). Specify the quadrant in which each point lies.
Solution The five points are plotted in the coordinate plane in FIGURE 3.1.4. Point A lies in the first quadrant (quadrant I),B in the second quadrant (quadrant II), and C is in the third quadrant (quadrant III). Points D and E, which lie on the y- and the x-axes, respectively, are not in any quadrant.
Five points in Example 1
EXAMPLE 2 Plotting Points
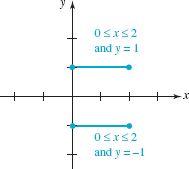
Sketch the set of points (x, y) in the xy-plane that satisfy both 0 ≤x ≤ 2 and |y| = 1.
Solution First, recall that the absolute-value equation |y| = 1 implies that y = –1 or y = 1. Thus the points that satisfy the given conditions are the points whose coordinates (x, y). simultaneously satisfy the conditions: each x –coordinate is a number in the closed interval [0, 2] and each y –coordinate is either y = –1 or y = 1. For example, (1, 1), (½, –1), and (2, –1) are a few of the points that satisfy the two conditions. Graphically, the set of all points satisfying the two conditions are points on the two parallel line segments shown in FIGURE 3.1.5.
Set of points in Example 2
EXAMPLE 3 Regions Defined by Inequalities
Sketch the set of points (x, y) in the xy –plane that satisfy each of the following conditions.
(a) xy < 0
(b) |y| ≥2
Solution From (3) of the sign properties of products in Section 2.7, we know that a product of two real numbers x and y is negative when one of the numbers is positive and the other is negative. Thus, xy<0 when x >0 and y <0 or when x <0 and y >0. We see from FIGURE 3.1.3 that xy < 0 for all points (x, y) in the second and fourth quadrants. Hence we can represent the set of points for which xy < 0 by the shaded regions in FIGURE 3.1.6. The coordinate axes are shown as dashed lines to indicate that the points on these axes are not included in the solution set.
(b) In Section 2.6 we saw that |y| ≥ 2 means that either y ≥ 2 or y ≤ –2. Since x is not restricted in any way it can be any real number, and so the points (x, y) for which
![]()
can be represented by the two shaded regions in FIGURE 3.1.7. We use solid lines to represent the boundaries y = –2 and y = 2 of the region to indicate that the points on these boundaries are included in the solution set.
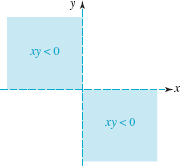
FIGURE 3.1.6 Region in the xy–plane satisfying condition in (a) of Example 3
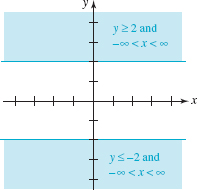
FIGURE 3.1.7 Region in the xy–plane satisfying condition in (b) of Example 3
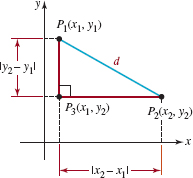
FIGURE 3.1.8 Distance between points P1 and P2
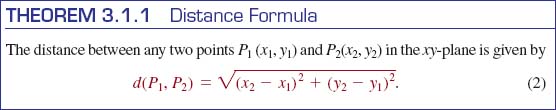
![]() Distance Formula Suppose P1(x1, y1) and P2(x2, y2) are two distinct points in the xy–plane that are not on a vertical line or on a horizontal line. As a consequence, P1, P2, and P3 (x1, y2)are vertices of a right triangle as shown in FIGURE 3.1.8. The length of the side P3P2 is |x2 – x1|, and the length of the side P1P3 is |y2 – y1|. If we denote the length of P1P2 by d, then
Distance Formula Suppose P1(x1, y1) and P2(x2, y2) are two distinct points in the xy–plane that are not on a vertical line or on a horizontal line. As a consequence, P1, P2, and P3 (x1, y2)are vertices of a right triangle as shown in FIGURE 3.1.8. The length of the side P3P2 is |x2 – x1|, and the length of the side P1P3 is |y2 – y1|. If we denote the length of P1P2 by d, then
![]()
by the Pythagorean theorem. Since the square of any real number is equal to the square of its absolute values, we can replace the absolute-value signs in (1) with parentheses. The distance formula given next follows immediately from (1).
Although we derived this equation for two points not on a vertical or horizontal line, (2) holds in these cases as well. Also, because (x2–x1)2 +(x1–x2)2 it makes no difference which point is used first in the distance formula, that is, d(P1, P2) = d(P2, P1).
EXAMPLE 4 Distance Between Two Points
Find the distance between the points A(8, –5) and B(3,7).
Solution From (2) with A and B playing the parts of P1 and P2:
![]()
The distance d is illustrated in FIGURE 3.1.9.
EXAMPLE 5 Three Points Form a Triangle
Determine whether the points P1(7, 1), P2(–4, –1), and P3(4, 5) are the vertices of a right triangle.
Solution From plane geometry we know that a triangle is a right triangle if and only if the sum of the squares of the lengths of two of its sides is equal to the square of the length of the remaining side. Now, from the distance formula (2), we have
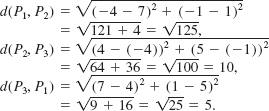
Since ![]() we conclude that P1, P2, and P3 are the vertices of a right triangle with the right angle at P3. See FIGURE 3.1.10.
we conclude that P1, P2, and P3 are the vertices of a right triangle with the right angle at P3. See FIGURE 3.1.10.
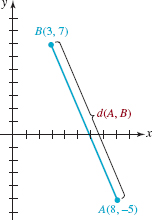
FIGURE 3.1.10 Distance between two points in Example 4
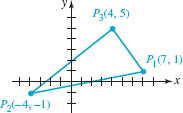
FIGURE 3.1.10 Triangle in Example 5
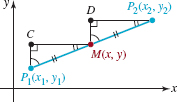
FIGURE 3.1.11 M is the midpoint of the line segment joining P1 and P2
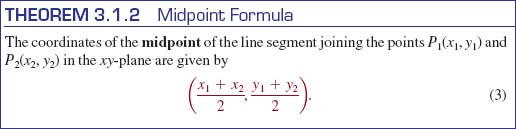
![]() Midpoint Formula In Section 1.2 we saw that the midpoint of a line segment between two numbers a and b on the number line is the average, (a + b)/2. In the xy– plane, each coordinate of the midpoint M of a line segment joining two points P1(x1, y1) and P2(x2, y2), as shown in FIGURE 3.1.11, is the average of the corresponding coordinates of the endpoints of the intervals [x1, x2] and [y1, y2].
Midpoint Formula In Section 1.2 we saw that the midpoint of a line segment between two numbers a and b on the number line is the average, (a + b)/2. In the xy– plane, each coordinate of the midpoint M of a line segment joining two points P1(x1, y1) and P2(x2, y2), as shown in FIGURE 3.1.11, is the average of the corresponding coordinates of the endpoints of the intervals [x1, x2] and [y1, y2].
To prove this, we note in Figure 3.1.11 that triangles P1CM and MDP2 are congruent since corresponding angles are equal and d(P1, M) = d(M, P2). Hence, d(P1, C) = d(M, D) or y – y1 = y2 – y. Solving the last equation for y gives ![]() . Similarly, d(C, M) = d(D, P2) so that x – x1 = x2 – x and therefore
. Similarly, d(C, M) = d(D, P2) so that x – x1 = x2 – x and therefore ![]() We summarize the result.
We summarize the result.
EXAMPLE 6 Midpoint of a Line Segment
Find the coordinates of the midpoint of the line segment joining A(–2, 5) and B(4, 1).
Solution From formula (3) the coordinates of the midpoint of the line segment joining the points A and B are given by
![]()
This point is indicated in red in FIGURE 3.1.12.
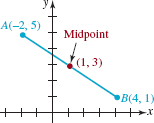
FIGURE 3.1.12 Midpoint of line segment in Example 6
3.1 Exercises Answers to selected odd–numbered problems begin on page ANS–5.
In Problems 1–4, plot the given points.
1. (2, 3), (4, 5), (0, 2), (–1, –3)
2. (1, 4), (–3, 0), (–4, 2), (–1, –1)
3. (–½, –2), (0, 0), (–1, ![]() ), (3, 3)
), (3, 3)
4. (0, 0.8), (–2, 0), (1.2,–1.2), (–2, 2)
In Problems 5–16, determine the quadrant in which the given point lies if (a,b) is in quadrant I.
5. (–a, b)
6. (a, – b)
7. (–a, –b)
8. (b, a)
9. (–b, a)
10. (–b, –a)
11. (a, a)
12. (b, –b)
13. (–a, –a)
14. (–a, a)
15. (b, –a)
16. (–b, b)
17. Plot the points given in Problems 5–16 if (a, b) is the point shown in FIGURE 3.1.13.
18. Give the coordinates of the points shown in FIGURE 3.1.14.
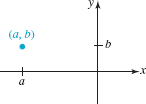
FIGURE 3.1.13Point (a,b) in Problem 17
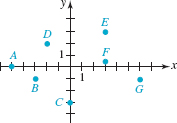
FIGURE 3.1.14Points in Problem 18
19. The points (–2, 0), (–2, 6), and (3, 0) are vertices of a rectangle. Find the fourth vertex.
20. Describe the set of all points (x,x) in the coordinate plane. The set of all points (x, –x).
In Problems 21–26, sketch the set of points (x, y) in the xy–plane that satisfy the given conditions.
21. xy = 0
22. xy > 0
23. |x| ≤1 and |y| ≤ 2
24. x ≤ 2 and y ≥ –1
25. |x| > 4
26. |y| ≤ 1
In Problems 27–32, find the distance between the given points.
27. A(1, 2), B(–3, 4)
28. A(–1, 3), B(5, 0)
29. A(2, 4), B(–4, –4)
30. A(–12, –3), B(–5, –7)
31. ![]()
32. ![]()
In Problems 33–36, determine whether the points A, B, and C are vertices of a right triangle.
33. A(8, 1), B(–3, –1), C(10, 5)
34. A(–2, –1), B(8, 2), C(1, –11)
35. A(2, 8),B(0, –3), C(6, 5)
36. A(4, 0), B(1, 1), C(2, 3)
37. Determine whether the points A(0, 0), B(3, 4), and C(7, 7) are vertices of an isosceles triangle.
38. Find all points on the y–axis that are 5 units from the point (4, 4).
39. Consider the line segment joining A(–1, 2) and B(3, 4).
40. Find an equation that expresses the fact that a point P(x, y) is equidistant from A and from B.
41. Describe geometrically the set of points described by the equation in part (a).
42. Use the distance formula to determine whether the points A(–1, –5), B(2, 4), and C(4, 10) lie on a straight line.
43. Find all points with x –coordinate 6 such that the distance from each point to (–1, 2) is ![]() .
.
44. Which point, (1/√2, 1/√2)or (0.25, 0.97), is closer to the origin?
In Problems 43–48, find the midpoint of the line segment joining the points A and B.
45. A(4, 1), B(–2, 4)
46. ![]()
47. A(–1, 0), B(–8, 5)
48. ![]()
49. A(2a, 3b), B(4a, –6b)
50. A(x, x),B(–x, x + 2)
In Problems 49–52, find the point B if M is the midpoint of the line segment joining points A and B.
51. ![]()
52. ![]()
53. A(5, 8), M(–1, –1)
54. A(–10, 2), M(5, 1)
55. Find the distance from the midpoint of the line segment joining A(–1, 3) and B(3, 5) to the midpoint of the line segment joining C(4, 6) and D(–2, –10).
56. Find all points on the x–axis that are 3 units from the midpoint of the line segment joining (5, 2) and (–5, –6).
57. The x–axis is the perpendicular bisector of the line segment through A(2, 5) and B(x, y). Find x and y.
58. Consider the line segment joining the points A(0, 0) and B(6, 0). Find a point C(x, y) in the first quadrant such that A, B, and C are vertices of an equilateral triangle.
59. Find points P1(x1, y1), P2(x2, y2), and P3(x3, y3)on the line segment joining A(3, 6) and B(5, 8) that divide the line segment into four equal parts.
Miscellaneous Applications
60. Going to Chicago Kansas City and Chicago are not directly connected by an interstate highway, but each city is connected to St. Louis and Des Moines. See FIGURE 3.1.15. Des Moines is approximately 40 mi east and 180 mi north of Kansas City, St. Louis is approximately 230 mi east and 40 mi south of Kansas City, and Chicago is approximately 360 mi east and 200 mi north of Kansas City. Assume that this part of the Midwest is a flat plane and that the connecting highways are straight lines. Which route from Kansas City to Chicago, through St. Louis or through Des Moines, is shorter?
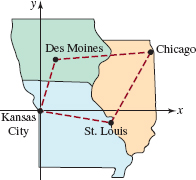
FIGURE 3.1.15 Map for Problem 58
For Discussion
The points A(1, 0), B(5, 0), C(4, 6), and D(8, 6) are vertices of a parallelogram. Discuss: How can it be shown that the diagonals of the parallelogram bisect each other? Carry out your ideas.
The points A(0, 0),B(a, 0), and C(a, b) are vertices of a right triangle. Discuss: How can it be shown that the midpoint of the hypotenuse is equidistant from the vertices? Carry out your ideas.
3.2 Circles and Graphs
![]() Introduction In Chapter 002 we studied equations as an equality of two algebraic quantities involving one variable. Our goal then was to find the solution set of the equation. In this and subsequent sections that follow we study equations in two variables, say x and y. Such an equation is simply a mathematical statement that asserts two quantities involving these variables are equal. In the fields of the physical sciences, engineering, and business, equations in two (or more) variables are a means of communication. For example, if a physicist wants to tell someone how far a rock dropped from a great height travels in a certain time t, he or she will write s =16t2. A mathematician will look at s = 16t2 and immediately classify it as a certain type of equation. The classification of an equation carries with it information about properties shared by all equations of that kind. The remainder of this text is devoted to examining different kinds of equations involving two or more variables and studying their properties. Here is a sample of some of the equations in two variables that you will see:
Introduction In Chapter 002 we studied equations as an equality of two algebraic quantities involving one variable. Our goal then was to find the solution set of the equation. In this and subsequent sections that follow we study equations in two variables, say x and y. Such an equation is simply a mathematical statement that asserts two quantities involving these variables are equal. In the fields of the physical sciences, engineering, and business, equations in two (or more) variables are a means of communication. For example, if a physicist wants to tell someone how far a rock dropped from a great height travels in a certain time t, he or she will write s =16t2. A mathematician will look at s = 16t2 and immediately classify it as a certain type of equation. The classification of an equation carries with it information about properties shared by all equations of that kind. The remainder of this text is devoted to examining different kinds of equations involving two or more variables and studying their properties. Here is a sample of some of the equations in two variables that you will see:
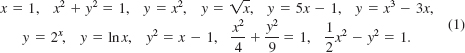
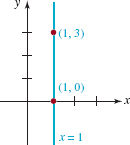
FIGURE 3.2.1 Graph of equation x = 1
![]() Terminology A solution of an equation in two variables x and y is an ordered pair of numbers (a, b) that yields a true statement when x =a and y = b are substituted into the equation. For example, (–2, 4) is a solution of the equation y = x2 because
Terminology A solution of an equation in two variables x and y is an ordered pair of numbers (a, b) that yields a true statement when x =a and y = b are substituted into the equation. For example, (–2, 4) is a solution of the equation y = x2 because
![]()
is a true statement. We also say that the coordinates (–2, 4)satisfy the equation. As in Chapter 002, the set of all solutions of an equation is called its solution set. Two equations are said to be equivalent if they have the same solution set. For example, we will see in Example 4 of this section that the equation x2 + y2 + 10x – 2y + 17 = 0 is equivalent to (x + 5)2 + (y – 1)2 = 32.
In the list given in (1), you might object that the first equation x = 1 does not involve two variables. It is a matter of interpretation! Because there is no explicit y dependence in the equation, the solution set of x = 1 can be interpreted to mean the set
{(x, y) |x = 1, where y is any real number}.
The solutions of x = 1 are then ordered pairs (1, y), where you are free to choose y arbitrarily so long as it is a real number. For example, (1, 0) and (1, 3) are solutions of the equation x = 1. The graph of an equation is the visual representation in the rectangular coordinate system of the set of points whose coordinates (a, b) satisfy the equation. The graph of x = 1 is the vertical line shown in FIGURE 3.2.1.
![]() Circles The distance formula discussed in the preceding section can be used to define a set of points in the coordinate plane. One such important set is defined as follows.
Circles The distance formula discussed in the preceding section can be used to define a set of points in the coordinate plane. One such important set is defined as follows.
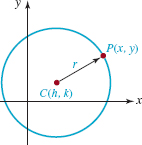
FIGURE 3.2.2 Circle with radius r and center (h, k)
If the center has coordinates C(h, k), then from the preceding definition a point P(x, y) lies on a circle of radius r if and only if
![]()
Since (x – h)2 + (y –k)2 is always nonnegative, we obtain an equivalent equation when both sides are squared. We conclude that a circle of radius r and center C(h, k) has the equation
![]()
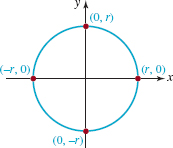
FIGURE 3.2.3 Circle with radius r and center (0, 0)
In FIGURE 3.2.2 we have sketched a typical graph of an equation of the form given in (2). Equation (2) is called the standard form of the equation of a circle. We note that the symbols h and k in (2) represent real numbers and as such can be positive, zero, or negative. When h = 0, k = 0, we see that the standard form of the equation of a circle with center at the origin is
![]()
See FIGURE 3.2.3. When r = 1, we say that (2) or (3) is an equation of a unit circle. For example, x2 + y2 = l is an equation of a unit circle centered at the origin.
EXAMPLE 1 Center and Radius
Find the center and radius of the circle whose equation is
![]()
Solution To obtain the standard form of the equation, we rewrite (4) as
![]()
Comparing this last form with (2) we identify h = 8, k = –2, and r = 7. Thus the circle is centered at (8, –2) and has radius 7.
EXAMPLE 2 Equation of a Circle
Find an equation of the circle with center C(–5, 4) with radius ![]() .
.
Solution Substituting h = – 5, k = 4, and r = ![]() in (2) we obtain
in (2) we obtain
![]()
EXAMPLE 3 Equation of a Circle
Find an equation of the circle with center C(4, 3) and passing through P(1, 4).
Solution With h = 4 and k = 3, we have from (2)
![]()
Since the point P(1, 4) lies on the circle as shown in FIGURE 3.2.4, its coordinates must satisfy equation (5). That is,
![]()
Thus the required equation in standard form is
![]()
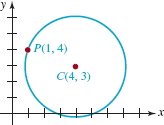
FIGURE 3.2.4 Circle in Example 3
![]() Completing the Square If the terms (x – h)2 and (y – k)2 are expanded and the like terms grouped together, an equation of a circle in standard form can be written as
Completing the Square If the terms (x – h)2 and (y – k)2 are expanded and the like terms grouped together, an equation of a circle in standard form can be written as
![]()
Of course in this last form the center and radius are not apparent. To reverse the process, in other words, to go from (6) to the standard form (2), we must complete the square in both x and y. Recall from Section 2.3 that adding (a/2)2 to a quadratic expression such as x2 + ax yields x2 + ax + (a/2)2, which is the perfect square (x + a/2)2. By rearranging the terms in (6),
![]()
and then adding (a/2)2 and (b/2)2 to both sides of the last equation
The terms in color added inside the parentheses on the left–hand side are also added to the right–hand side of the equality. This new equation is equivalent to (6). ![]()
![]()
we obtain the standard form of the equation of a circle:
![]()
You should not memorize the last equation; we strongly recommend that you work through the process of completing the square each time.
EXAMPLE 4 Completing the Square
Find the center and radius of the circle whose equation is
![]()
Solution To find the center and radius we rewrite equation (7) in the standard form (2). First, we rearrange the terms,
![]()
Then, we complete the square in x and y by adding, in turn, (10/2)2 in the first set of parentheses and (–2/2)2in the second set of parentheses. Proceed carefully here because we must add these numbers to both sides of the equation:

From the last equation we see that the circle is centered at (–5, 1) and has radius 3. See FIGURE 3.2.5.
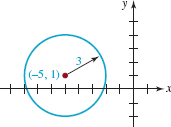
FIGURE 3.2.5 Circle in Example 4
It is possible that an expression for which we must complete the square has a leading coefficient other than 1. For example,
![]()
is an equation of a circle. As in Example 4 we start by rearranging the equation:
![]()
Now, however, we must do one extra step before attempting completion of the square; that is, we must divide both sides of the equation by 3 so that the coefficients of x2 and y2 are each 1:
![]()
At this point we can now add the appropriate numbers within each set of parentheses and to the right–hand side of the equality. You should verify that the resulting standard form is ![]()
![]() Semicircles If we solve (3) for y we get
Semicircles If we solve (3) for y we get ![]() . This last expression is equivalent to the two equations
. This last expression is equivalent to the two equations ![]() . In like manner if we solve (3) for x we obtain
. In like manner if we solve (3) for x we obtain ![]() . By convention, the symbol
. By convention, the symbol ![]() denotes a nonnegative quantity, thus the y–values defined by an equation such as
denotes a nonnegative quantity, thus the y–values defined by an equation such as ![]() are nonnegative. The graphs of the four equations highlighted in color are, in turn, the upper half, lower half, right half, and the left half of the circle shown in FIGURE 3.2.3. Each graph in FIGURE 3.2.6 is called a semicircle.
are nonnegative. The graphs of the four equations highlighted in color are, in turn, the upper half, lower half, right half, and the left half of the circle shown in FIGURE 3.2.3. Each graph in FIGURE 3.2.6 is called a semicircle.
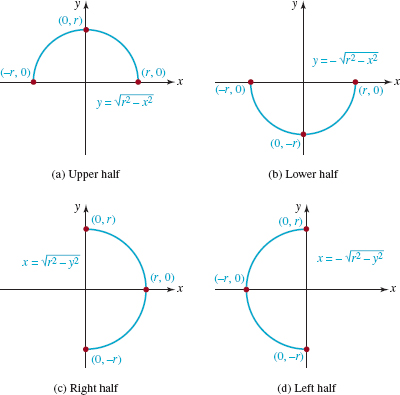
FIGURE 3.2.6Semicircles
![]() Inequalities One last point about circles. On occasion we encounter problems where we must sketch the set of points in the xy–plane whose coordinates satisfy inequalities such as x2 + y2 < r2 or x2 + y2 ≥ r2. The equation x2 + y2 = r2 describes the set of points (x, y) whose distance to the origin (0, 0) is exactly r. Therefore, the inequality x2 + y2 < r2 describes the set of points (x, y) whose distance to the origin is less than r. In other words, the points (x, y) whose coordinates satisfy the inequality x2 + y2 <r2 are in the interior of the circle. Similarly, the points (x, y) whose coordinates satisfy x2 + y2 ≥r2 lie either on the circle or are exterior to it.
Inequalities One last point about circles. On occasion we encounter problems where we must sketch the set of points in the xy–plane whose coordinates satisfy inequalities such as x2 + y2 < r2 or x2 + y2 ≥ r2. The equation x2 + y2 = r2 describes the set of points (x, y) whose distance to the origin (0, 0) is exactly r. Therefore, the inequality x2 + y2 < r2 describes the set of points (x, y) whose distance to the origin is less than r. In other words, the points (x, y) whose coordinates satisfy the inequality x2 + y2 <r2 are in the interior of the circle. Similarly, the points (x, y) whose coordinates satisfy x2 + y2 ≥r2 lie either on the circle or are exterior to it.
![]() Graphs It is difficult to read a newspaper, read a science or business text, surf the Internet, or even watch the news on TV without seeing graphical representations of data. It may even be impossible to get past the first page in a mathematics text without seeing some kind of graph. So many diverse quantities are connected by means of equations and so many questions about the behavior of the quantities linked by the equation can be answered by means of a graph, that the ability to graph equations quickly and accurately–like the ability to do algebra quickly and accurately–is high on the list of skills essential to your success in a course in calculus. For the rest of this section we will talk about graphs in general, and more specifically, about two important aspects of graphs of equations.
Graphs It is difficult to read a newspaper, read a science or business text, surf the Internet, or even watch the news on TV without seeing graphical representations of data. It may even be impossible to get past the first page in a mathematics text without seeing some kind of graph. So many diverse quantities are connected by means of equations and so many questions about the behavior of the quantities linked by the equation can be answered by means of a graph, that the ability to graph equations quickly and accurately–like the ability to do algebra quickly and accurately–is high on the list of skills essential to your success in a course in calculus. For the rest of this section we will talk about graphs in general, and more specifically, about two important aspects of graphs of equations.
![]() Intercepts Locating the points at which the graph of an equation crosses the coordinates axes can be helpful when sketching a graph by hand. The x–intercepts of a graph of an equation are the points at which the graph crosses the x–axis. Since every point on the x–axis has y–coordinate 0, the x–coordinates of these points (if there are any) can be found from the given equation by setting y = 0 and solving for x. In turn, the y –intercepts of the graph of an equation are the points at which its graph crosses the y–axis. The y–coordinates of these points can be found by setting x = 0 in the equation and solving for y. See FIGURE 3.2.7.
Intercepts Locating the points at which the graph of an equation crosses the coordinates axes can be helpful when sketching a graph by hand. The x–intercepts of a graph of an equation are the points at which the graph crosses the x–axis. Since every point on the x–axis has y–coordinate 0, the x–coordinates of these points (if there are any) can be found from the given equation by setting y = 0 and solving for x. In turn, the y –intercepts of the graph of an equation are the points at which its graph crosses the y–axis. The y–coordinates of these points can be found by setting x = 0 in the equation and solving for y. See FIGURE 3.2.7.
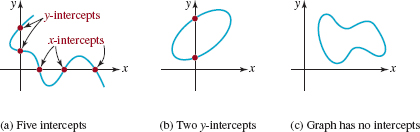
FIGURE 3.2.7 Intercepts of a graph
EXAMPLE 5 Intercepts
Find the intercepts of the graphs of the equations
(a) x2 – y2 = 9
(b) y = 2x2 + 5x – 12.
Solution (a) To find the x–intercepts we set y = 0 and solve the resulting equation x2 = 9 for x:
x2 – 9 = 0 or (x + 3)(x – 3) = 0
gives x = –3 and x = 3. The x–intercepts of the graph are the points (–3, 0) and (3, 0). To find the y–intercepts we set x = 0 and solve –y2 = 9 or y2 = –9 for y. Because there are no real numbers whose square is negative we conclude the graph of the equation does not cross the y–axis.
(b) Setting y = 0 yields 2 x2 + 5x – 12 = 0. This is a quadratic equation and can be solved either by factoring or by the quadratic formula. Factoring gives
(x + 4)(2x – 3) = 0
and so![]() . The x-intercepts of the graph are the points (–4, 0) and
. The x-intercepts of the graph are the points (–4, 0) and ![]() . Now, setting x = 0 in the equation y = 2 x2 + 5 x – 12 immediately gives y = –12. The y–intercept of the graph is the point (0, –12).
. Now, setting x = 0 in the equation y = 2 x2 + 5 x – 12 immediately gives y = –12. The y–intercept of the graph is the point (0, –12).
EXAMPLE 6 Example 4 Revisited
Let's return to the circle in Example 4 and determine its intercepts from equation (7). Setting y = 0 in x2 + y2 + 10x – 2y + 17 = 0 and using the quadratic formula to solve x2 + 10x + 17 = 0 shows the x –intercepts of this circle are ![]() and
and ![]() . If we let x = 0, then the quadratic formula shows that the roots of the equation y2 – 2y + 17 = 0 are complex numbers. As seen in FIGURE 3.2.5, the circle does not cross the y–axis.
. If we let x = 0, then the quadratic formula shows that the roots of the equation y2 – 2y + 17 = 0 are complex numbers. As seen in FIGURE 3.2.5, the circle does not cross the y–axis.
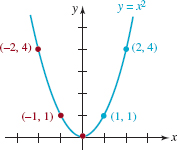
FIGURE 3.2.8 Graph with y –axis symmetry
![]() Symmetry A graph can also possess symmetry. You may already know that the graph of the equation y = x2 is called a parabola.FIGURE 3.2.8 shows that the graph of y = x2 is symmetric with respect to the y–axis since the portion of the graph that lies in the second quadrant is the mirror image or reflection of that portion of the graph in the first quadrant. In general, a graph is symmetric with respect to the y–axis if whenever (x, y) is a point on the graph, (–x, y) is also a point on the graph. Note in FIGURE 3.2.8 that the points (1, 1) and (2, 4) are on the graph. Because the graph possesses y–axis symmetry, the points (– 1, 1) and (–2, 4) must also be on the graph. A graph is said to be symmetric with respect to the x–axis if whenever (x, y) is a point on the graph, (x, –y) is also a point on the graph. Finally, a graph is symmetric with respect to the origin if whenever (x, y) is on the graph, (–x, –y) is also a point on the graph. FIGURE 3.2.9illustrates these three types of symmetries.
Symmetry A graph can also possess symmetry. You may already know that the graph of the equation y = x2 is called a parabola.FIGURE 3.2.8 shows that the graph of y = x2 is symmetric with respect to the y–axis since the portion of the graph that lies in the second quadrant is the mirror image or reflection of that portion of the graph in the first quadrant. In general, a graph is symmetric with respect to the y–axis if whenever (x, y) is a point on the graph, (–x, y) is also a point on the graph. Note in FIGURE 3.2.8 that the points (1, 1) and (2, 4) are on the graph. Because the graph possesses y–axis symmetry, the points (– 1, 1) and (–2, 4) must also be on the graph. A graph is said to be symmetric with respect to the x–axis if whenever (x, y) is a point on the graph, (x, –y) is also a point on the graph. Finally, a graph is symmetric with respect to the origin if whenever (x, y) is on the graph, (–x, –y) is also a point on the graph. FIGURE 3.2.9illustrates these three types of symmetries.
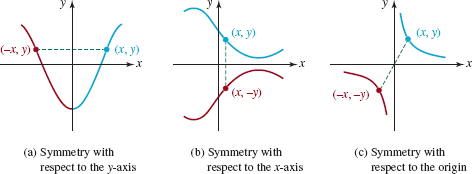
FIGURE 3.2.9 Symmetries of a graph
Observe that the graph of the circle given in FIGURE 3.2.3 possesses all three of these symmetries.
As a practical matter we would like to know whether a graph possesses any symmetry in advance of plotting its graph. This can be done by applying the following tests to the equation that defines the graph.
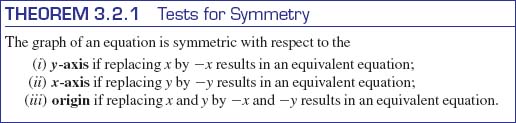
The advantage of using symmetry in graphing should be apparent: If say, the graph of an equation is symmetric with respect to the x–axis, then we need only produce the graph for y ≥ 0 since points on the graph for y < 0 are obtained by taking the mirror images, through the x–axis, of the points in the first and second quadrants.
EXAMPLE 7 Test for Symmetry
By replacing x by – x in the equation y = x2 and using (–x)2 = x2, we see that
y = (–x)2 is equivalent to y = x2.
This proves what is apparent in FIGURE 3.2.8; that is, the graph of y = x2 is symmetric with respect to the y–axis.
EXAMPLE 8 Intercepts and Symmetry
Determine the intercepts and any symmetry for the graph of
![]()
Solution
Intercepts: Setting y = 0in equation (8) immediately gives x = 10. The graph of the equation has a single x–intercept, (10, 0). When x = 0, we get y2 = 10, which implies that ![]() Thus there are two y–intercepts,
Thus there are two y–intercepts, ![]() .
.
Symmetry: If we replace x by –x in the equation x + y = 10, we get –x + y2 = 10. This is not equivalent to equation (8). You should also verify that replacing x and y by –x and –y in (8) does not yield an equivalent equation. However, if we replace y by –y, we find that
x + (–y)2 = 10 is equivalent to x + y2 = 10.
Thus, the graph of the equation is symmetric with respect to the x–axis.
Graph: In the graph of the equation given in FIGURE 3.2.10 the intercepts are indicated and the x – axis symmetry should be apparent.
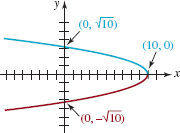
FIGURE 3.2.10 Graph of equation in Example 8
3.2 Exercises Answers to selected odd–numbered problems begin on page ANS–5.
In Problems 1–6, find the center and the radius of the given circle. Sketch its graph.
1. x2+y2=5
2. x2+y2=9
3. x2+(y–3)2=49
4. (x+2)2+y2=36
5. ![]()
6. (x+3)2+(y–5)2=25
In Problems 7–14, complete the square in x and y to find the center and the radius of the given circle.
![]()
7. x2 + y2 + 8y = 0
8. x2 + y2 – 6x = 0
9. x2 + y2 + 2x – 4y – 4 = 0
10. x2 + y2 – 18x – 6y – 10 = 0
11. x2 + y2 – 20x + 16y + 128 = 0
12. x2 + y2 + 3x – 16y + 63 = 0
13. 2x2 + 2y2 + 4x + 16y + 1 = 0
14. ![]()
In Problems 15–24, find an equation of the circle that satisfies the given conditions.
15. center (0, 0), radius 1
16. center (1, –3), radius 5
17. center (0, 2), radius ![]()
18. center (–9, –4), radius ![]()
19. endpoints of a diameter at (–1, 4) and (3, 8)
20. endpoints of a diameter at (4, 2) and (–3, 5)
21. center (0, 0), graph passes through (–1, –2)
22. center (4, –5), graph passes through (7, –3)
23. center (5, 6), graph tangent to the x–axis
24. center (–4, 3), graph tangent to the y–axis
In Problems 25–28, sketch the semicircle defined by the given equation.
25. ![]()
26. ![]()
27. ![]()
28. ![]()
29. Find an equation for the upper half of the circle x2 + (y – 3)2 = 4. The right half of the circle.
30. Find an equation for the lower half of the circle (x – 5)2 + (y – 1)2 = 9. The left half of the circle.
In Problems 31–34, sketch the set of points in the xy–plane whose coordinates satisfy the given inequality.
31. x2 + y2 ≥ 9
32. (x – 1)2 + (y + 5)2 ≤ 25
33. 1 ≥ x2 + y2 ≤ 4
34. x2 + y2 > 2y
In Problems 35 and 36, find the x– and y–intercepts of the given circle.
35. The circle with center (3, –6) and radius 7
36. The circle x2 +y2 + 5x – 6y = 0
In Problems 37–62, find any intercepts of the graph of the given equation. Determine whether the graph of the equation possesses symmetry with respect to the x –axis, y–axis, or origin. Do not graph.
37. y = – 3x
38. y – 2x = 0
39. –x + 2y = 1
40. 2x + 3y = 6
41. x = y2
42. y = x3
43. y =x2 – 4
44. x = 2y2 – 4
45. y = x2 – 2x – 2
46. y2 = 16(x + 4)
47. y = x(x2 – 3)
48. y = (x – 2)2(x + 2)2
49. ![]()
50. y3 – 4x2 + 8 = 0
51. 4y2 – x2 = 36
52. ![]()
53. ![]()
54. ![]()
55. ![]()
56. ![]()
57. ![]()
58. ![]()
59. ![]()
60. ![]()
61. ![]()
62. ![]()
In Problems 63–66, state all the symmetries of the given graph.
63. 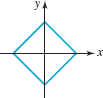
FIGURE 3.2.11 Graph for Problem 63
64. 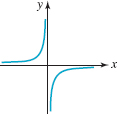
FIGURE 3.2.12 Graph for Problem 64
65. 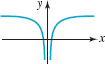
FIGURE 3.2.13 Graph for Problem 65
66. 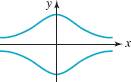
FIGURE 3.2.14 Graph for Problem 66
In Problems 67–72, use symmetry to complete the given graph.
67. The graph is symmetric with respect to the y–axis.
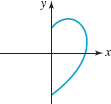
FIGURE 3.2.15 Graph for Problem 67
68. The graph is symmetric with respect to the x–axis.
FIGURE 3.2.16 Graph for Problem 68
69. The graph is symmetric with respect to the origin.
FIGURE 3.2.17 Graph for Problem 69
70. The graph is symmetric with respect to the y–axis.
FIGURE 3.2.18Graph for Problem 70
71. The graph is symmetric with respect to the x– and y–axes.
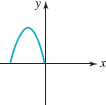
FIGURE 3.2.19 Graph for Problem 71
72. The graph is symmetric with respect to the origin.
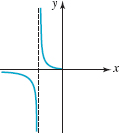
FIGURE 3.2.20 Graph for Problem 72
For Discussion
73. Determine whether the following statement is true or false. Defend your answer.
If a graph has two of the three symmetries defined on page 135,then the graph must necessarily possess the third symmetry.
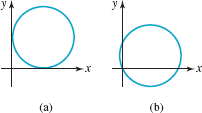
74. (a) The radius of the circle in Figure 3.2.21(a) is r. What is its equation in standard form?
(b) The center of the circle in Figure 3.2.21(b) is (h, k). What is its equation in standard form?
75. Discuss whether the following statement is true or false.
Every equation of the form x2 + y2 +ax + by + c = 0is a circle.
Circles in Problem 74
3.3 Equations of Lines
![]() Introductio Any pair of distinct points in the xy–plane determines a unique straight line. Our goal in this section is to find equations of lines. Fundamental to finding equations of lines is the concept of slope of a line.
Introductio Any pair of distinct points in the xy–plane determines a unique straight line. Our goal in this section is to find equations of lines. Fundamental to finding equations of lines is the concept of slope of a line.
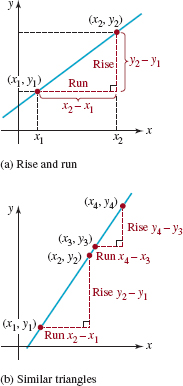
FIGURE 3.3.1 Slope of a line
![]() Slope If P1(x1, y1) and P2(x2, y2) are two points such that x1 ≠ x2, then the number
Slope If P1(x1, y1) and P2(x2, y2) are two points such that x1 ≠ x2, then the number
![]()
is called the slope of the line determined by these two points. It is customary to call y2 – y1 the change in y or rise of the line; x2 – x1 is the change in x or the run of the line. Therefore, the slope (1) of a line is
![]()
See FIGURE 3.3.1(a). Any pair of distinct points on a line will determine the same slope. To see why this is so, consider the two similar right triangles in Figure 3.3.1(b). Since we know that the ratios of corresponding sides in similar triangles are equal we have
![]()
Hence the slope of a line is independent of the choice of points on the line.
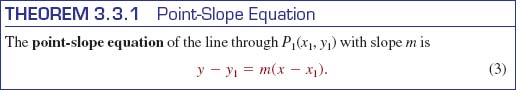
In FIGURE 3.3.2 we compare the graphs of lines with positive, negative, zero, and undefined slopes. In Figure 3.3.2(a) we see, reading the graph left to right, that a line with positive slope (m > 0) rises as x increases. Figure 3.3.2(b) shows that a line with negative slope (m <0) falls as x increases. If P1(x1, y1) and P2(x2,y2) are points on a horizontal line, then y1 = y2 and so its rise is y2 – y1 = 0. Hence from (1) the slope is zero (m = 0). See Figure 3.3.2(c). If P1(x1, y1) and P2(x2, y2) are points on a vertical line, then x1 = x2 and so its run is x2 – x1 = 0. In this case we say that the slope of the line is undefined or that the line has no slope. See Figure 3.3.2(d).
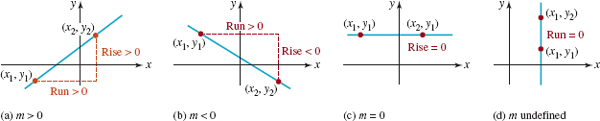
FIGURE 3.3.2 Lines with slope (a)–(c); line with no slope (d)
In general, since
![]()
it does not matter which of the two points is called P1(x1, y1) and which is called P2(x2, y2) in (1).
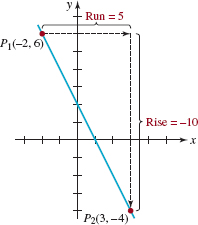
FIGURE 3.3.3 Line in Example 1
EXAMPLE 1 Slope and Graph
Find the slope of the line through the points (–2, 6) and (3, –4). Graph the line.
Solution Let (–2, 6) be the point P1(x1, y1) and (3, –4) be the point P2(x2, y2). The slope of the straight line through these points is
Thus the slope is –2, and the line through P1 and P2 is shown in FIGURE 3.3.3.
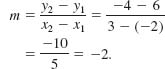
![]() Point–Slope Equation We are now in a position to find an equation of a line L.To begin, suppose L has slope m and that P1(x1, y1) is on the line. If P(x, y) represents any other point on L, then (1) gives
Point–Slope Equation We are now in a position to find an equation of a line L.To begin, suppose L has slope m and that P1(x1, y1) is on the line. If P(x, y) represents any other point on L, then (1) gives
![]()
Multiplying both sides of the last equality by x–x1 gives an important equation.
EXAMPLE 2 Point–Slope Equation
Find an equation of the line with slope 6 and passing through ![]() .
.
Solution Letting m = 6, x1 = ![]() and y1 = 2 we obtain from (3)
and y1 = 2 we obtain from (3)
![]()
Simplifying gives
![]()
EXAMPLE 3 Point–Slope Equation
Find an equation of the line passing through the points (4, 3) and (–2, 5).
Solution First we compute the slope of the line through the points. From (1),
![]()
The point–slope equation (3) then gives

![]() the distributive law
the distributive law
![]()
![]() is the source of many errors on students' papers. A common error goes something like this:
is the source of many errors on students' papers. A common error goes something like this:
![]()
The correct result is:
![]()
![]() Slope–Intercept Equation Any line with slope (that is, any line that is not vertical) must cross the y–axis. If this y–intercept is (0, b), then with x1 = 0, y1 =b, the point–slope form (3) gives y –b = m(x – 0). The last equation simplifies to the next result.
Slope–Intercept Equation Any line with slope (that is, any line that is not vertical) must cross the y–axis. If this y–intercept is (0, b), then with x1 = 0, y1 =b, the point–slope form (3) gives y –b = m(x – 0). The last equation simplifies to the next result.
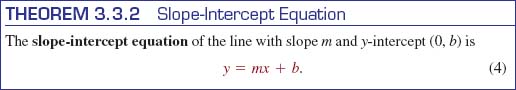

FIGURE 3.3.4 Lines through the origin are y = mx
When b = 0 in (4), the equation y =mx represents a family of lines that pass through the origin (0, 0). In FIGURE 3.3.4 we have drawn a few of the members of that family.
EXAMPLE 4 Example 3 Revisited
We can also use the slope–intercept form (4) to obtain an equation of the line through the two points in Example 3. As in that example, we start by finding the slope m = ![]() The equation of the line is then
The equation of the line is then ![]() By substituting the coordinates of either point (4, 3) or (–2, 5) into the last equation enables us to determine b. If we use x = 4 and y = 3, then
By substituting the coordinates of either point (4, 3) or (–2, 5) into the last equation enables us to determine b. If we use x = 4 and y = 3, then ![]() and so
and so ![]() The equation of the line is
The equation of the line is ![]()
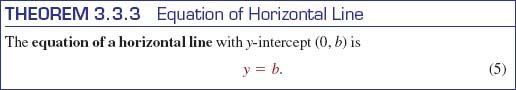
![]() Horizontal and Vertical Lines We saw in Figure 3.3.2(c) that a horizontal line has slope m = 0. An equation of a horizontal line passing through a point (a, b) can be obtained from (3), that is, y –b = 0(x –a) or y = b.
Horizontal and Vertical Lines We saw in Figure 3.3.2(c) that a horizontal line has slope m = 0. An equation of a horizontal line passing through a point (a, b) can be obtained from (3), that is, y –b = 0(x –a) or y = b.
A vertical line through (a, b) has undefined slope and all points on the line have the same x–coordinate. The equation of a vertical line is then
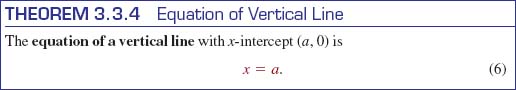
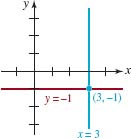
FIGURE 3.3.5 Horizontal and vertical lines in Example 5
EXAMPLE 5 Vertical and Horizontal Lines
Find equations for the vertical and horizontal lines through (3, –1). Graph these lines.
Solution Any point on the vertical line through (3, –1) has x –coordinate 3. The equation of this line is then x = 3. Similarly, any point on the horizontal line through (3, –1) has y–coordinate –1. The equation of this line is y = –1. Both lines are graphed in FIGURE 3.3.5.
![]() Linear Equation The equations (3), (4), (5), and (6) are special cases of the general linear equation in two variables x and y
Linear Equation The equations (3), (4), (5), and (6) are special cases of the general linear equation in two variables x and y
![]()
where a and b are real constants and not both zero. The characteristic that gives (7) its name linear is that the variables x and y appear only to the first power. Observe that

EXAMPLE 6 Slope and y–intercept
Find the slope and the y–intercept of the line 3x – 7y + 5 = 0.
Solution We solve the linear equation for y:
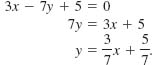
Comparing the last equation with (4) we see that the slope of the line is ![]() and the y–intercept is
and the y–intercept is ![]()
If the x– and y–intercepts are distinct, the graph of the line can be drawn through the corresponding points on the x– and y–axes.
EXAMPLE 7 Graph of a Linear Equation
Graph the linear equation 3x – 2y + 8 = 0.
Solution There is no need to rewrite the linear equation in the form y = mx + b. We simply find the intercepts.
y–intercept: Setting x = 0 gives –2y + 8 = 0 or y = 4. The y–intercept is (0, 4).
x–intercept: Setting y = 0 gives 3x + 8 = 0 or x = ![]() The x–intercept is (
The x–intercept is (![]() 0).
0).
As shown in FIGURE 3.3.6, the line is drawn through the two intercepts (0, 4) and (![]() 0).
0).
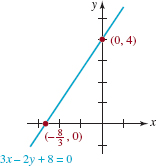
FIGURE 3.3.6 Line in Example 7
![]() Parallel and Perpendicular Lines Suppose L1 and L2 are two distinct lines with slope. This assumption means that both L1 and L2 are nonvertical lines. Then necessarily L1 and L2 are either parallel or they intersect. If the lines intersect at a right angle they are said to be perpendicular. We can determine whether two lines are parallel or are perpendicular by examining their slopes.
Parallel and Perpendicular Lines Suppose L1 and L2 are two distinct lines with slope. This assumption means that both L1 and L2 are nonvertical lines. Then necessarily L1 and L2 are either parallel or they intersect. If the lines intersect at a right angle they are said to be perpendicular. We can determine whether two lines are parallel or are perpendicular by examining their slopes.

Parallel lines
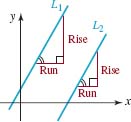
FIGURE 3.3.7 Parallel lines
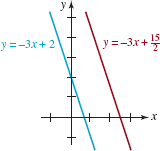
FIGURE 3.3.8 Parallel lines in Example 8
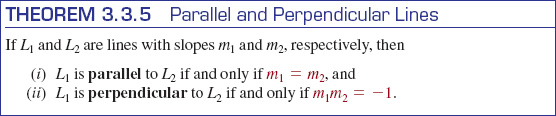
There are several ways of proving the two parts of Theorem 3.3.5. The proof of part (i) can be obtained using similar right triangles, as in FIGURE 3.3.7, and the fact that the ratios of corresponding sides in such triangles are equal. We leave the justification of part (ii) as an exercise. See Problems 49 and 50 in Exercises 3.3. Note that the condition m1m2 = –1 implies that m2 = –1/m1, that is, the slopes are negative reciprocals of each other. A horizontal line y = b and a vertical line x = a are perpendicular, but the latter is a line with no slope.
EXAMPLE 8 Parallel Lines
The linear equations 3x + y = 2 and 6x + 2y = 15 can be rewritten in the slope– intercept forms
![]()
respectively. As noted in color in the preceding line the slope of each line is –3. Therefore the lines are parallel. The graphs of these equations are shown inFIGURE 3.3.8.
EXAMPLE 9 Perpendicular lines
Find an equation of the line through(0, –3)that is perpendicular to the graph of 4x – 3y + 6=0
Solution We express the given linear equation in slope–intercept form:
4x – 3y + 6=0 implies 3y = 4x + 6
Dividing by 3 gives ![]() This line, whose graph is given in blue in FIGURE 3.3.9, has slope
This line, whose graph is given in blue in FIGURE 3.3.9, has slope ![]() The slope of any line perpendicular to it is the negative reciprocal of
The slope of any line perpendicular to it is the negative reciprocal of ![]() namely,
namely, ![]() Since (0, –3)is the y–intercept of the required line, it follows from(4) that its equation is
Since (0, –3)is the y–intercept of the required line, it follows from(4) that its equation is ![]() . The graph of the last equation is the red line in FIGURE 3.3.9.
. The graph of the last equation is the red line in FIGURE 3.3.9.
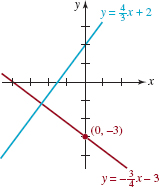
FIGURE 3.3.9 Perpendicular lines in Example 9
3.3 Exercises Answers to selected odd–numbered problems begin on page ANS–6.
In Problems 1–6, find the slope of the line through the given points. Graph the line through the points.
(3, –7), (1, 0)
(–4, –1), (1, –1)
(5, 2), (4, –3)
(1, 4), (6, –2)
(–1, 2), (3, –2)
(8, –½), (2, 5/2)
In Problems 7 and 8, use the graph of the given line to estimate its slope.
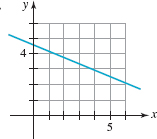
FIGURE 3.3.10 Graph for Problem 7
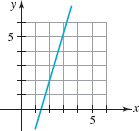
FIGURE 3.3.11 Graph for Problem 8
In Problems 9–16, find the slope and the x– and y–intercepts of the given line. Graph the line.
3x –4y + 12 = 0
½ x –3 y =3
2x – 3y = 9
– 4x – 2y 1 6 = 0
2x + 5y – 8 = 0
y/2 – x/10 – 1 =0
y = 2/3x = 1
y = 2x + 6
In Problems 17–22, find an equation of the line through (1, 2) with the indicated slope.
2/3
1/10
0
–2
–1
undefined
In Problems 23–36, find an equation of the line that satisfies the given conditions.
Through (2, 3) and (6, –5)
Through (5, –6) and (4, 0)
Through (8, 1) and (–3, 1)
Through (2, 2) and (–2, –2)
Through (–2, 0) and (–2, 6)
Through (0, 0) and (a,b)
Through (–2, 4) parallel to 3x + y – 5 = 0
Through (1, –3) parallel to 2x – 5y + 4 = 0
Through (5, –7) parallel to the y–axis
Through the origin parallel to the line through (1, 0) and (–2, 6)
Through (2, 3) perpendicular to x – 4y + 1 = 0
Through (0, –2) perpendicular to 3x + 4y + 5 = 0
Through (–5, –4) perpendicular to the line through (1, 1) and (3, 11)
Through the origin perpendicular to every line with slope 2
In Problems 37–40, determine which of the given lines are parallel to each other and which are perpendicular to each other.
![]()
![]()
![]()
![]()
Find an equation of the line L shown in FIGURE 3.3.12 if an equation of the blue curve is y = x2+ 1
A tangent to a circle is defined to be a straight line that touches the circle at only one point P. Find an equation of the tangent line L shown in FIGURE 3.3.13.
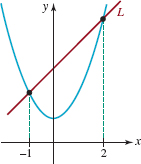
FIGURE 3.3.12 Graphs in Problem 41
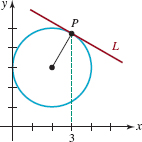
FIGURE 3.3.13 Circle and tangent line in Problem 42
For Discussion
How would you find an equation of the line that is the perpendicular bisector of the line segment through (½, 10) and (3/2, 4)?
Using only the concepts of this section, how would you prove or disprove that the triangle with vertices (2, 3), (–1, –3), and (4, 2) is a right triangle?
Using only the concepts of this section, how would you prove or disprove that the quadrilateral with vertices (0, 4), (–1, 3), (–2, 8), and (–3, 7) is a parallelogram?
If C is an arbitrary real constant, an equation such as 2x – 3 y = C is said to define a family of lines. Choose four different values of C and plot the corresponding lines on the same coordinate axes. What is true about the lines that are members of this family?
Find the equations of the lines through (0, 4) that are tangent to the circle x2+ y2 = 4.
For the line ax + by 1 c = 0, what can be said about a, b, and c if
(a) the line passes through the origin,
(b) the slope of the line is 0,
(c) the slope of the line is undefined?
In Problems 49 and 50, to prove part (ii) of Theorem 3.3.5 you have to prove two things, the only if part (Problem 49) and then the if part (Problem 50) of the theorem.
In FIGURE 3.3.14, without loss of generality, we have assumed that two perpendicular lines y = m1x, m1 > 0, and y =m2x, m2< 0, intersect at the origin. Use the information in the figure to prove the only if part:
If L1 and L2 are perpendicular lines with slopes m1 and m2, then m1m2 = –1.
Reverse your argument in Problem 49 to prove the if part:
If L1 and L2 are lines with slopes mx and m2 such that m1m2 = –1, then L1 and L2are perpendicular.
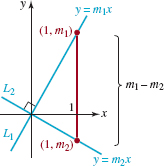
FIGURE 3.3.14 Lines through origin in Problems 49 and 50
3.4 Variation
![]() Introduction In many disciplines, a mathematical description by means of an equation, or mathematical model, of a real–life problem can be constructed using the notion of proportionality. For example, in one model of a growing population (say, bacteria) it is assumed that the rate of growth at time t is directly proportional to the population at that time. If we let R represent the rate of growth,P the population, then the preceding sentence translates into
Introduction In many disciplines, a mathematical description by means of an equation, or mathematical model, of a real–life problem can be constructed using the notion of proportionality. For example, in one model of a growing population (say, bacteria) it is assumed that the rate of growth at time t is directly proportional to the population at that time. If we let R represent the rate of growth,P the population, then the preceding sentence translates into
![]()
where the symbol ∞ is read “proportional to.” The mathematical statement in (1) is an example of variation. In this section we examine four types of variation: direct, inverse, joint, and combined. Each of these types of variation produce an equation in two or more variables.
![]() Direct Variation We begin with the formal definition of direct variation.
Direct Variation We begin with the formal definition of direct variation.
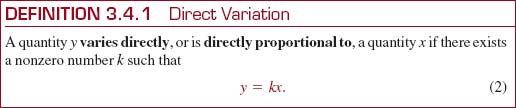
In (2) we say that the number k is the constant of proportionality. Comparing (2) with FIGURE 3.3.4 we know that the graph of any equation of the form given in (2) is a line through the origin with slope k. FIGURE 3.4.1 illustrates the graph of (2) in the case of when k > 0 and x ≥ 0.
Of course, symbols other than x and y are often used in (2). In the study of springs in physics, the force F required to keep a spring stretched x units beyond its natural, or unstretched, length is assumed to be directly proportional to the elongation x, that is,
![]()
See FIGURE 3.4.2. The result in (3) is called Hooke's law after the irascible English physicist Robert Hooke (1635–1703).
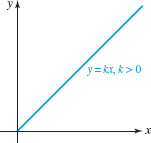
FIGURE 3.4.1 Graph of y = kx, k > 0, x ≥ 0.

FIGURE 3.4.2 Stretched spring
EXAMPLE 1 Hooke's Law
A spring whose natural length is ![]() ft is stretched 1 in. by a force of 30 lb. How much force is necessary to stretch the spring to a length of 1 ft?
ft is stretched 1 in. by a force of 30 lb. How much force is necessary to stretch the spring to a length of 1 ft?
Solution The elongation of 1 in. is equivalent to ![]() ft. Hence by (2) we have
ft. Hence by (2) we have
![]()
Therefore, F = 360x. When the spring is stretched to a length of 1 ft, its elongation is ![]() The force necessary to stretch the spring to a length of 1 ft is
The force necessary to stretch the spring to a length of 1 ft is
![]()
A quantity can also be proportional to a power of another quantity. In general, we say that yvaries directly, as the nth power of x, or is directly proportional toxn, if there exists a constant k such that
![]()
The power n in (4) need not be an integer.
EXAMPLE 2 Direct Variation
(a) The circumference C of a circle is directly proportional to its radius r. If k is the constant of proportionality, then by (2) we can write C = kr.
(b) The area A of a circle is directly proportional to the square of its radius r. If k is the constant of proportionality, then by (4),A = kr2.
(c) The volume V of a sphere is directly proportional to the cube of its radius r. If k is the constant of proportionality, then by (4), V = kr3.
From geometry we know in part (a) of Example 2 that k = 2π, in part (b),k = π, and in part (c),k = ![]()
EXAMPLE 3 Direct Variation
Suppose that y is directly proportional to x3. If y = 4 when x = 2, what is the value of y when x = 4?
Solution From (3) we can write y = kx3 By substitution of y= 4 and x = 2 into this equation, we obtain the constant of proportionality k, since 4= k.8 implies that k=1/2 Thus, y =1/2x3 Finally, when x=4, we have y = 1/2.43, or y=32.
![]() Inverse Variation We say that a quantity yvaries inversely with x if it is proportional to the reciprocal of x. The formal definition of this concept follows next.
Inverse Variation We say that a quantity yvaries inversely with x if it is proportional to the reciprocal of x. The formal definition of this concept follows next.
Note in (4) if we let one of the quantities, say x, increase in magnitude, then correspondingly the quantity y decreases in magnitude. Alternatively, if the value of x is small in magnitude, then the value of y is large in magnitude. This can be seen clearly in the graph given in FIGURE 3.4.3 for x> 0.
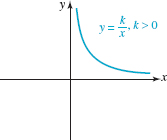
FIGURE 3.4.3 Graph of y=k/x,k>0, x≥0
An alternative form of (4) is xy = k. In the study of gases,Boyle's law stipulates that the product of an ideal gas'spressure P and the volume V occupied by that gas satisfies PV = k. In other words,P is inversely proportional to V. If the volume V of a containercontaining an ideal gas is decreased, necessarily the pressure exerted by the gas on the interior walls of the container increases.
In general, we say that y varies inversely, or is inversely proportional to, the nth power of x if there exists a constant k such that
![]()
![]() Joint and Combined Variation A variable may be directly proportional to the products of powers of several variables. If the variable z is given by
Joint and Combined Variation A variable may be directly proportional to the products of powers of several variables. If the variable z is given by
![]()
we say that zvaries jointly as the mth power of x and the nth power of y, or that z is jointly proportional to xm and yn. The concept ofjoint variation expressed in (5) can, of course, be extended to products of powers of more than two variables. Furthermore, a quantity may be directly proportional to several variables and inversely proportional to other variables. This type of variation is called combined variation.
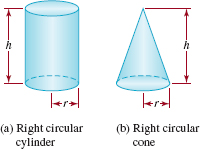
FIGURE 3.4.4 Cone and Cylinder in Example 4
EXAMPLE 4 Joint Variation
Consider the right circular cylinder and the right circular cone shown in FIGURE 3.4.4. The volume V of each is jointly proportional to the square of its radius r and its height h. That is
![]()
It turns out that the constants of proportionality are k1 = π and k2=π/3. Thus the volumes are
![]()
EXAMPLE 5 Joint Variation
The hydrodynamic resistance D to a boat moving through water is jointly proportional to the density p of the water, the area A of the wet portion of the boat's hull, and the square of the boat's velocity v. That is
![]()
where k is the constant of proportionality. See FIGURE 3.4.5.
The same relation (6) can sometimes be used to determine the drag force acting on an object moving through the air.
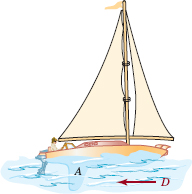
FIGURE 3.4.5 Boat in Example 5
EXAMPLE 6 Combined Variation
Newton's Law of Universal Gravitation is a good example of combined variation:
 Every point mass in the universe attracts every other point mass by a force that is directly proportional to the product of the two masses and inversely proportional to the square of the distance between the point masses.
If, as shown in FIGURE 3.4.6, we denote the masses by m1 and m2the distance between the masses by r, the square of the distance by r2, the common magnitude of the force vectors F1 and F2 as F, and k the constant of proportionality, then the formulaic interpretation of the foregoing paragraph is
![]()
The constant of proportionality k in Example 6 is usually denoted by the symbol G and is called the universal gravitational constant.
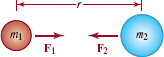
FIGURE 3.4.6 Gravitational force in Example 6
3.4 Exercises Answers to selected odd–numbered problems begin on page ANS–6.
1. Suppose that y varies directly as the square of x. If y = 3 when x = 1, what is the value of y = 3 when x = 2?
2. Suppose that y is directly proportional to the square root of x. If y = 4 when x = 16, what is the value of y when x = 25?
3. Suppose that w is inversely proportional to the cube root of t. If w = 2 when t = 27, what is the value of w when t = 8?
4. Suppose that s varies inversely as the square of r. If a value of r is tripled, what is the effect on s?
5. (a) Suppose a 10–lb force stretches a spring 3 in. beyond its natural length. Find a formula for the force F required to stretch the spring x ft beyond its natural length.
(b) Determine the elongation of the spring produced by a 50–lb force.
6. A spring whose natural length of 1 ft is stretched ¾ ft by a force of 100 lb. How much force is necessary to stretch the spring to a length of 2.5 ft?
Miscellaneous Applications
7. Falling Stone The distance s that a stone travels when dropped from a very tall building is proportional to the square of the time t in flight. If the stone falls 64 feet in 2 seconds, find a formula that relates s and t. How far does the stone fall in 5 s? How far does the stone fall between 2 s and 3 s?
8. Another Falling Stone The velocity v of a stone dropped from a very tall building varies directly as the time t in flight. Find a formula relating v and t if the velocity of the stone at the end of 1 second is 32 ft/s. If the stone is dropped from the top of a building that is 144 ft tall, what is its velocity when it hits the ground?[Hint: Use Problem 7.]
9. Pendulum Motion The period T of a plane pendulum varies directly as the square root of its length L. How much should the length L be changed in order to double the period of the pendulum?
10. Weight The weight w of a person varies directly as the cube of the person's length l. At age 13 a person 60 in. tall weighs 120 lb. What is the person's weight at age 16 when the person is 72 in. tall?
11. Animal Surface Area The surface area S (in square meters) of an animal is directly proportional to the two–thirds power of its weight w measured in kg. For humans the constant of proportionality is taken to be k = 0.11. Find the surface area of a person whose weight is 81 kg.
12. Kepler's Third Law According to Kepler's third law of planetary motion, the square of the period P of a planet (that is, the time it takes for a planet to revolve around the Sun) is proportional to the cube of its mean distance 5 from the sun. The period of the Earth is 365 days and its mean distance from the Sun is 92,900,000 mi. Determine the period of Mars given that its mean distance from the Sun is 142,000,000 mi.

FIGURE 3.4.7 Parallel wires in Problem 13
13. Magnetic Force Suppose that electrical currents I1 and I2 flow in long parallel wires as shown in FIGURE 3.4.7. The force FL per unit length exerted on a wire due to the magnetic field around the other wire is jointly proportional to the currents I1 and I2 and inversely proportional to the distance r between the wires. Express this combined variation as a formula. If the distance r is halved, then what is the effect on the force FL?
14. Energy The kinetic energy K of a moving body varies jointly as the product of its mass m and the square of its velocity v. If the constant of proportionality is 1/2, find the kinetic energy of a neutron of mass 1.7 × 10⁻²⁷ kg moving at a constant rate of 3.5 × 10⁴ m/s.
15. Got Gas? According to the general gas law, the pressure P of a quantity of gas is directly proportional to the absolute temperature T of the gas and inversely proportional to its volume V. Express this combined variation as a formula. A large balloon contains 500 ft3 of a gas at ground level, where the pressure is 14.7 lb/in2 and the absolute temperature is 293 K (or 20°C). What is the volume occupied by this gas at an altitude of 10 mi, where the pressure is 1.5 lb/in2 and the absolute temperature is 218 K (or –55°C)?
16. Stress and Strain In the study of elastic bodies, stress is directly proportional to strain. For a wire of length L and cross–sectional area A that is stretched an amount e by an applied force F, stress is defined to be F/A and strain is given by e/L. Find a formula that expresses e in terms of the other variables.
17. Speed of Sound The speed of sound in air varies with temperature according to the equation v =![]() where v is the speed of sound in centimeters per second and T is the temperature of the air in kelvin units (273 K = 0° Celsius). On which day does the sound of exploding fireworks travel faster: July 4th (T = 310 K) or January 1st (T = 270 K)? How much faster?
where v is the speed of sound in centimeters per second and T is the temperature of the air in kelvin units (273 K = 0° Celsius). On which day does the sound of exploding fireworks travel faster: July 4th (T = 310 K) or January 1st (T = 270 K)? How much faster?
18. Animal Life Span Empirical studies indicate that the life span of a mammal in captivity is related to body size by the formula L = (11.8)M0'20, where L is life span in years and M is body mass in kilograms.
(a) What does this function predict for the life span of a 4000–kg elephant in a zoo?
(b) What does this function predict for the life span of an 80–kg man confined to a prison?
19. Temperature The temperature of a Pyrex glass rod is raised from a temperature fx to a final temperature t2. The thermal expansion e of the rod is jointly proportional to its length L and the rise in the temperature. When a rod of length 10 cm is heated from 20°C to 420°C, its thermal expansion is 0.012 cm. What is the thermal expansion of the same rod when it is heated from 20°C to 550°C?
20. Pitch of a Bell A rule of thumb has it that the pitch P of a bell is inversely proportional to the cube root of its weight w. A bell weighing 800 lb has a pitch of 512 cycles per second. How heavy would a similar bell have to be in order to produce a pitch of 256 cycles per second (middle C)?

Fireworks in Problem 17

Pitch of a bell depends on its weight
A. True/False![]()
In Problems 1–22, answer true or false.
1. The point (5, 0) is in quadrant I.___
2. The point (–3, 7) is in quadrant III.__
3. The points (0, 3), (2, 2), and (6, 0) are collinear.____
4. Two lines with positive slopes cannot be perpendicular.____
5. The equation of a vertical line through (2, –5) is x = 2.____
6. If A, B, and C are points in the Cartesian plane, then it is always true that d(A, B) + d(B, C)>d(A, C).___
7. The lines 2x + 3y = 5 and – 2x + 3y = 1 are perpendicular.__
8. The circle (x + 1)2 + (y – 1)2 = l is tangent to both the x– and y–axes.___
9. The graph of the equation y = x + x3 is symmetric with respect to the origin.___
10. The center of the circle x2 + 4 x + y2 + 10y = 0is (–2, –5).___
11. The circle x2 + 4x + y2 + 10y = 0 passes through the origin.__
12. If a line has undefined slope, then it must be vertical.___
13. The circle (x –3)2 + (y + 5)2 = 2 has no intercepts.____
14. If (–1/2, 3/2) is on a line with slope 1, then (1/2, –3/2) is also on the line.___
15. The lines y = 2x – 5 and y = 2x are parallel.____
16. If y is inversely proportional to x, then y decreases as x increases.___
17. The line through the points (–1, 2) and (4, 2) is horizontal.___
18. Graphs of lines of the form y =mx, m> 0, cannot contain a point with a negative x–coordinate and a positive y–coordinate.___
19. If the graph of an equation contains the point (2, 3) and is symmetric with respect to the x–axis, then the graph also contains the point (2, –3).___
20. The graph of the equation |x| = |y| is symmetric with respect to the x–axis, the y–axis, and the origin.___
21. There is no point on the circle x2 + y2 – 10x + 22 = Owith x–coordinate 2.___
22. The radius r of the circle centered at the origin containing the point (1, –2) is 5.___
B. Fill in the Blanks ![]()
In Problems 1–20, fill in the blanks.
1. The lines 2x – 5y = 1 and kx + 3y + 3 = 0 are parallel if k =____.
2. An equation of a line through (1, 2) that is perpendicular to y = 3x – 5 is________.
3. The slope and the x– and y–intercepts of the line –4x + 3y – 48 = 0 are ________.
4. The distance between the points (5, 1) and (–1, 9) is_______.
5. The slope of the line 4y = 6x + 3 is m =________.
6. The lines 2x – 5y = 1 and kx + 3y + 3 = 0 are perpendicular if k =_____.
7. Two points on the circle x2 + y2 = 25 with the same y–coordinate –3 are_________.
8. The graph of y = –6 is a_____.
9. The center and the radius of the circle (x – 2)2 + (y + 7)2 = 8 are_______.
10. The point (1, 5) is on a graph. Give the coordinates of another point on the graph if the graph is
(a) symmetric with respect to the x–axis_____.
(b) symmetric with respect to the y–axis_____.
(c) symmetric with respect to the origin______.
11. If (–2, 6) is the midpoint of the line segment from P i (x1, 3) to P2(8, y2), then x1 = ____ and y2 =____.
12. The midpoint of the line segment from Px(2, –5) to P2(8, –9) is_____.
13. The quadrants of the xy–plane in which the quotient x/y is negative are______.
14. A line with x–intercept (–4, 0) and y–intercept (0, 32) has slope______.
15. An equation of a line perpendicular to y = 3 and contains the point (–2, 7) is______
16. If the point (a,a + ![]() ) is on the graph of y = 2x, then a =________.
) is on the graph of y = 2x, then a =________.
17. The graph of y = –![]() is a_______.
is a_______.
18. The equation________is an example of a circle with center and both x–intercepts on the negative x–axis.
19. The distance from the midpoint of the line segment joining the points (4, – 6) and (–2, 0) to the origin is______.
20. If p varies inversely as the cube of q and p = 9 when q = – 1, then p = _____ when q = 3_____.
C. Review Exercises![]()
1. Determine whether the points A(1, 1), B(3, 3), and C(5, 1) are vertices of a right triangle.
2. Find an equation of a circle with the points (3, 4) and (5, 6) as the endpoints of a diameter.
3. Find an equation of the line through the origin perpendicular to the line through (1, 1) and (2, –2).
4. Find an equation of the line through (2, 4) parallel to the line through (– 1, – 1) and (4, –3).
5. Consider the line segment joining (– 1, 6) and (1, 10) and the line segment joining (7, 3) and (–3, –2). Find an equation of the line containing the midpoints of these two line segments.
6. Find an equation of the line that passes through (3, –8) and is parallel to the line 2x – y = –7.
7. Find two distinct points, other than the intercepts, on the line2x + 5y = 12.
8. The y–coordinate of a point is 2. Find the x–coordinate of the point if the distance from the point to (1, 3) is![]()
9. Find an equation of the circle with center at the origin if the length of its diameter is 8.
10. Find an equation of the circle that has center (1, 1) and passes through the point (5, 2).
11. Find equations of the circles that pass through the points (1, 3) and (–1, –3) and have radius 10.
12. The point (–3, b) is on the graph of y + 2x + 10 = 0. Find b.
13. Three vertices of a rectangle are (3, 5), (–3, 7), and (–6, –2). Find the fourth vertex.
14. Find the point of intersection of the diagonals of the rectangle in Problem 13.
In Problems 15 and 16, solve for x.
15. P1(x, 2), P2(1, 1),d(P1, P2) =![]()
16. P1(x, 0), P2(–4, 3x),d(P1, P2) = 4
17. Find an equation that relates x and y if it is known that the distance (x, y) to (0, 1) is the same as the distance from(x, y) to (x, –1).
18. Show that the point (– 1, 5) is on the perpendicular bisector of the line segment from P1(1, 1) to P2(3, 7).
19. If M is the midpoint of the line segment from P1(2, 3) to P2(6, –9), find the midpoint of the line segment from Px to M and the midpoint of the line segment from M to P2.
20. Figure 3.R.1 shows the midpoints of the sides of a triangle. Determine the vertices of the triangle.
21. A tangent line to a circle at a point P on the circle is a line through P that is perpendicular to the line through P and the center of the circle. Find an equation of the tangent line L indicated inFigure 3.R.2.

FIGURE 3.R.1 Triangle in Problem 20
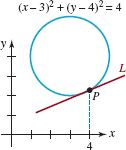
FIGURE 3.R.2 Graph for Problem 21

FIGURE 3.R.3 Graph for Problem 22
22. Which of the following equations best describes the circle given in Figure 3.R.3? The symbols a, b, c, d, and e stand for nonzero constants.
(a) ax2 + by2 +cx + dy + e = 0
(b) ax2 + ay2 +cx + dy + e = 0
(c) ax2 + ay2 +cx + dy = 0
(d) ax2 + ay2 +c = 0
(e) ax2 + ay2 +cx + e = 0
In Problems 23–30, match the given equation with the appropriate graph given in Figure 3.R.4.
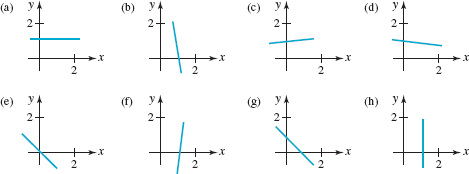
FIGURE 3.R.4 Graphs for Problems 23–30
23. x + y –1= 0
24. x + y = 0
25. x – 1 = 0
26. y – 1 = 0
27. 10x + y –10 = 0
28. –10x +y + 10 = 0
29. x + 10y –10 = 0
30. –x + 10y –10 = 0
* This is the same notation used to denote an open interval. It should be clear from the context of the discussion whether we are considering a point (a, b) or an open interval (a, b).