
2
A History of Communication Technology
The other chapters in this book provide details regarding the history of one or more communication technologies. However, one needs to understand that history works, in some ways, like a telescope. The closer an observer looks at the details, i.e. the particular human behaviors that changed communication technologies, the less they can grasp the big picture.
This chapter attempts to provide the big picture by discussing recent advancements along with a review of happenings “before we were born.” Without the understanding of the collective memory of the trailblazers of communication technology, we will be “children forever” when we make interpretations and implications from history records. (Cicero, 1876).
We will visit the print era, the electronic era, and the digital era in this chapter. To provide a useful perspective, we compare numerical statistics of adoption and use of these technologies across time. To that end, this chapter follows patterns adopted in previous summaries of trends in U.S. communications media (Brown & Bryant, 1989; Brown, 1996, 1998, 2000, 2002, 2004, 2006, 2008, 2010, 2012, 2014; Zhu & Brown, 2016). Non-monetary units are reported when possible, although dollar expenditures appear as supplementary measures. A notable exception is the de facto standard of measuring motion picture acceptance in the market: box office receipts.
Government sources are preferred for consistency in this chapter. However, they have recently become more volatile in terms of format, measurement and focus due to the shortened life circle of technologies (for example, some sources don’t distinguish laptops from tablets when calculating PC shipments). Readers should use caution in interpreting data for individual years and instead emphasize the trends over several years. One limitation of this government data is the lag time before statistics are reported, with the most recent data being a year or more older. The companion website for this book (www.tfi.com/ctu) reports more detailed statistics than could be printed in this chapter.
Communication technologies are evolving at a much faster pace today than they used to be, and the way in which we differentiate technologies is more about concepts rather than products. For example, audiocassettes and compact discs seem doomed in the face of rapid adoption of newer forms of digital audio recordings. But what fundamentally changed our daily experience is the surge of individual power brought by technological convenience: digitized audios empowered our mobility and efficiency both at work or at play. Quadraphonic sound, CB radios, 8-track audiotapes, and 8mm film cameras ceased to exist as standalone products in the marketplace, and we exclude them, not because they disappeared, but because their concepts were converted or integrated into newer and larger concepts. This chapter traces trends that reveal clues about what has happened and what may happen in the use of respective media forms.
To illustrate the growth rates and specific statistics regarding each technology, a large set of tables and figures have been placed on the companion website for this book at www.tfi.com/ctu. Your understanding of each technology will be aided by referring to the website as you read each section.
The Print Era
Printing began in China thousands of years before Johann Gutenberg developed the movable type printing press in 1455 in Germany. Gutenberg’s press triggered a revolution that began an industry that remained stable for another 600 years (Rawlinson, 2011).
Printing in the United States grew from a one-issue newspaper in 1690 to become the largest print industry in the world (U.S. Department of Commerce/International Trade Association, 2000). This enterprise includes newspapers, periodicals, books, directories, greeting cards, and other print media.
Newspapers
Publick Occurrences, Both Foreign and Domestick was the first newspaper produced in North America, appearing in 1690 (Lee, 1917). Table 2.1 and Figure 2.1 from the companion website (www.tfi.com/ctu) for this book show that U.S. newspaper firms and newspaper circulation had extremely slow growth until the 1800s. Early growth suffered from relatively low literacy rates and the lack of discretionary cash among the bulk of the population. The progress of the industrial revolution brought money for workers and improved mechanized printing processes. Lower newspaper prices and the practice of deriving revenue from advertisers encouraged significant growth beginning in the 1830s. Newspapers made the transition from the realm of the educated and wealthy elite to a mass medium serving a wider range of people from this period through the Civil War era (Huntzicker, 1999).
The Mexican and Civil Wars stimulated public demand for news by the middle 1800s, and modern journalism practices, such as assigning reporters to cover specific stories and topics, began to emerge. Circulation wars among big city newspapers in the 1880s featured sensational writing about outrageous stories. Both the number of newspaper firms and newspaper circulation began to soar. Although the number of firms would level off in the 20th century, circulation continued to rise.
The number of morning newspapers more than doubled after 1950, despite a 16% drop in the number of daily newspapers over that period. Overall newspaper circulation remained higher at the start of the new millennium than in 1950, although it inched downward throughout the 1990s. Although circulation actually increased in many developing nations, both U.S. newspaper circulation and the number of U.S. newspaper firms are lower today than the respective figures posted in the early 1990s. Many newspapers that operated for decades are now defunct, and many others offer only online electronic versions.
The newspaper industry shrunk as we entered the 21st century when new technologies such as the Internet became popular outlets for advertising. Newspaper publishing revenue declined from $29 billion in 2010 to $23 billion in 2017 (US Census Bureau, 2016). In the meantime, percentage of revenue generated from online newspapers rose from 5.6% to 15.2%. (US Census Bureau, 2016). Advertising as a source of revenue for newspaper publishers dropped by 27% from $20.4 billion to $14.9 billion (U.S. Census Bureau, 2017).
Communication Technology Timeline
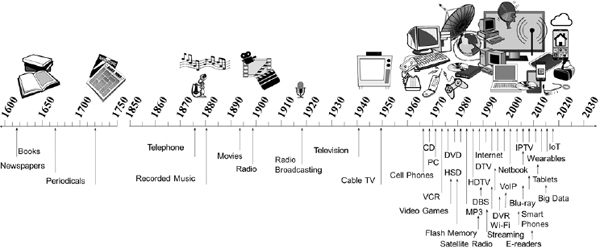
Source: Technology Futures, Inc.
Periodicals
“The first colonial magazines appeared in Philadelphia in 1741, about 50 years after the first newspapers” (Campbell, 2002, p. 310). Few Americans could read in that era, and periodicals were costly to produce and circulate. Magazines were often subsidized and distributed by special interest groups, such as churches (Huntzicker, 1999). The Saturday Evening Post, the longest running magazine in U.S. history, began in 1821 and became the first magazine to both target women as an audience and to be distributed to a national audience. By 1850, nearly 600 magazines were operating.
By early in the 20th century, national magazines became popular with advertisers who wanted to reach wide audiences. No other medium offered such opportunity. However, by the middle of the century, the many successful national magazines began dying in the face of advertiser preferences for the new medium of television and the increasing costs of periodical distribution. Magazines turned to smaller niche audiences that were more effectively targeted. Table 2.2, Figure 2.2, and Figure 2.3 on the companion website (www.tfi.com/ctu) show the number of American periodical titles by year, revealing that the number of new periodical titles nearly doubled from 1958 to 1960.
Single copy magazine sales were mired in a long period of decline in 2009 when circulation fell by 17.2%. However, subscription circulation fell by only 5.9%. In 2010, the Audit Bureau of Circulation reported that, among the 522 magazine titles monitored by the Bureau, the number of magazine titles in the United States fell by 8.7% (Agnese, 2011).
In 2010, 20,707 consumer magazines were published in North America, reaching a paid circulation of $8.8 billion. Subscriptions accounted for $6.2 billion (71%) of that circulation. During that year, 193 new North American magazines began publishing, but 176 magazines closed. Many print magazines were also available in digital form, and many had eliminated print circulation in favor of digital publishing. In 2009, 81 North American magazines moved online, but the number of additional magazines that went online in 2010 dropped to 28 (Agnese, 2011).
Books
Stephen Daye printed the first book in colonial America, The Bay Psalm Book, in 1640 (Campbell, 2002). Books remained relatively expensive and rare until after the printing process benefited from the industrial revolution. Linotype machines developed in the 1880s allowed for mechanical typesetting. After World War II, the popularity of paperback books helped the industry expand. The U.S. book publishing industry includes 87,000 publishers, most of which are small businesses. Many of these literally operate as “mom-and-pop desktop operations” (Peters & Donald, 2007, p. 11).
Table 2.3 and Figures 2.3 and 2.4 from the companion website (www.tfi.com/ctu) show new book titles published by year from the late 1800s through 2016. While times of war negatively affected the book industry, the number of book titles in the U.S. has been generally increasing with short-lived fluctuations like those in 1983–1986 and 1997–1999. The U.S. Bureau of the Census reports furnished data based on material from R. R. Bowker, which changed its reporting methods beginning with the 1998 report. Ink and Grabois (2000) explained the increase as resulting from the change in the method of counting titles “that results in a more accurate portrayal of the current state of American book publishing” (p. 508). The older counting process included only books included by the Library of Congress Cataloging in Publication program. This program included publishing by the largest American publishing companies, but omitted such books as “inexpensive editions, annuals, and much of the output of small presses and self-publishers” (Ink & Grabois, 2000, p. 509). Ink and Grabois observed that the U.S. ISBN (International Standard Book Number) Agency assigned more than 10,000 new ISBN publisher prefixes annually.
Books have long been available for reading via computers, but dedicated e-book readers have transformed the reading experience by bringing many readers into the digital era. By the end of 2009, 3.7 million Americans were reading e-books. In 2010, the readership grew to more than 10.3 million, an increase of 178%, and surveys reported by the Book Industry Study Group (BISG) reported that 20% of respondents had stopped buying printed books in favor of e-books within a year. By July 2010, Amazon reported that sales of e-books surpassed that of print hardcover sales for the first time, with “143 e-books sold for every 100 print hardcover books” (Dillon, 2011, p. 5). From mid-December 2011 through January 2012, the proportion of Americans owning both e-book readers and tablet computers nearly doubled from 10% to 19%, with 29% owning at least one of the devices (Rainie, 2012). In January 2014, e-book penetration rate in the U.S. reached 32% (Pew Research Center, 2014), and 51% of U.S. households owned a tablet in April 2015 (Nielsen, 2015a). However, e-book sales revenue in the United States reached its peak in 2014 ($1.6 billion) and continued to drop in 2015 ($1.4 billion) and 2016 ($1.1 billion) (Association of American Publishers, 2017).
The Electronic Era
The telegraph transitioned from the print era to a new period by introducing a means of sending messages far more rapidly than was previously possible. Soon, Americans and people around the world enjoyed a world enhanced by such electronic media as wired telephones, motion pictures, audio recording, radio, television, cable television, and satellite television.
Telephone
With the telephone, Alexander Graham Bell became the first to transmit speech electronically in 1876. By June 30, 1877, 230 telephones were in use, and the number rose to 1,300 by the end of August, mostly to avoid the need for a skilled interpreter of telegraph messages. The first switching office connected three company offices in Boston beginning on May 17, 1877, reflecting a focus on business rather than residential use during the telephone’s early decades. Hotels became early adopters of telephones as they sought to reduce the costs of employing human messengers, and New York’s 100 largest hotels had 21,000 telephones by 1909. After 1894, non-business telephone use became common, in part because business use lowered the cost of telephone service. By 1902, 2,315,000 telephones were in service in the United States (Aronson, 1977). Table 2.4 and Figure 2.4 on the companion website (www.tfi.com/ctu) document the growth to near ubiquity of telephones in U.S. households and the expanding presence of wireless telephones.
Wireless Telephones
Guglielmo Marconi sent the first wireless data messages in 1895. The growing popularity of telephony led many to experiment with Marconi’s radio technology as another means for interpersonal communication. By the 1920s, Detroit police cars had mobile radiophones for voice communication (ITU, 1999). The Bell system offered radio telephone service in 1946 in St. Louis, the first of 25 cities to receive the service. Bell engineers divided reception areas into cells in 1947, but cellular telephones that switched effectively among cells as callers moved did not arrive until the 1970s. The first call on a portable, handheld cell phone occurred in 1973. However, in 1981, only 24 people in New York City could use their mobile phones at the same time, and only 700 customers could have active contracts. To increase the number of people who could receive service, the Federal Communications Commission (FCC) began offering cellular telephone system licenses by lottery in June 1982 (Murray, 2001). Other countries, such as Japan in 1979 and Saudi Arabia in 1982, operated cellular systems earlier than the United States (ITU, 1999).
The U.S. Congress promoted a more advanced group of mobile communication services in 1993 by creating a classification that became known as Commercial Mobile Radio Service. This classification allowed for consistent regulatory oversight of these technologies and encouraged commercial competition among providers (FCC, 2005). By the end of 1996, about 44 million Americans subscribed to wireless telephone services (U.S. Bureau of the Census, 2008).
The new century brought an explosion of wireless telephones, and phones morphed into multipurpose devices (i.e., smartphones) with capabilities previously limited to computers. By the end of 2016, wireless phone penetration in the United States reached 395.9 million subscribers (CTIA, 2017), it further trended up to 417.5 million by 2017 (FierceWireless, 2017). CTIA-The Wireless Association (CTIA, 2017) reported that more than half (50.8%) of all American households were wireless-only by the end of 2016 up from about 10% in 2006. By 2017, worldwide shipments of smartphones exceeded 1.5 billion units (IDC, 2017), five times the quantity shipped in 2010 (IDC as cited by Amobi, 2013). As the Chinese smartphone market gradually matured, IDC (2015a) also forecasted that India would replace China as the leading driver of shipment increases.
Nevertheless, a factor that may trouble the advancement of smartphone sales and development is trade policy conflicts. Some governments are setting up barriers to foreign smartphone imports for trade or national security reasons. Without these obstacles, technological competition could have been fairer in the global market place and may lead to higher penetration rates and revenues for companies, with better services and products for ordinary customers.
Motion Pictures
In the 1890s, George Eastman improved on work by and patents purchased from Hannibal Goodwin in 1889 to produce workable motion picture film. The Lumière brothers projected moving pictures in a Paris café in 1895, hosting 2,500 people nightly at their movies. William Dickson, an assistant to Thomas Edison, developed the kinetograph, an early motion picture camera, and the kinetoscope, a motion picture viewing system. A New York movie house opened in 1894, offering moviegoers several coin-fed kinetoscopes. Edison’s Vitascope, which expanded the length of films over those shown via kinetoscopes and allowed larger audiences to simultaneously see the moving images, appeared in public for the first time in 1896. In France in that same year, Georges Méliès started the first motion picture theater. Short movies became part of public entertainment in a variety of American venues by 1900 (Campbell, 2002), and average weekly movie attendance reached 40 million people by 1922.
Average weekly motion picture theater attendance, as shown in Table 2.5 and Figure 2.6 on the companion website (www.tfi.com/ctu), increased annually from the earliest available census reports on the subject in 1922 until 1930. After falling dramatically during the Great Depression, attendance regained growth in 1934 and continued until 1937. Slight declines in the prewar years were followed by a period of strength and stability throughout the World War II years. After the end of the war, average weekly attendance reached its greatest heights: 90 million attendees weekly from 1946 through 1949. After the introduction of television, weekly attendance would never again reach these levels.
Although a brief period of leveling off occurred in the late 1950s and early 1960s, average weekly attendance continued to plummet until a small recovery began in 1972. This recovery signaled a period of relative stability that lasted into the 1990s. Through the last decade of the century, average weekly attendance enjoyed small but steady gains.
Box office revenues, which declined generally for 20 years after the beginning of television, began a recovery in the late 1960s, then began to skyrocket in the 1970s. The explosion continued until after the turn of the new century. However, much of the increase in revenues came from increases in ticket prices and inflation, rather than from increased popularity of films with audiences, and total motion picture revenue from box office receipts declined during recent years, as studios realized revenues from television and videocassettes (U.S. Department of Commerce/International Trade Association, 2000).
As shown in Table 2.5 on the companion website (www.tfi.com/ctu), American movie fans spent an average of 12 hours per person per year from 1993 through 1997 going to theaters. That average stabilized through the first decade of the 21st century (U.S. Bureau of the Census, 2010), despite the growing popularity of watching movies at home with new digital tools. In 2011, movie rental companies were thriving, with Netflix boasting 25 million subscribers and Redbox having 32,000 rental kiosks in the United States (Amobi, 2011b). However, recent physical sales and rental of home entertainment content suffered from the rise of web streaming services and consumer behavior change (Digital Entertainment Group, 2017). Redbox kiosk rentals started to decline in 2013 ($1.97 billion) to $1.76 billion in 2015 (Outerwall, 2016).
The record-breaking success of Avatar in 2009 as a 3D motion picture triggered a spate of followers who tried to revive the technology that was a brief hit in the 1950s. Avatar earned more than $761 million at American box offices and nearly $2.8 billion worldwide.
In the United States, nearly 8,000 of 39,500 theater screens were set up for 3D at the end of 2010, half of them having been installed in that year. The ticket prices for 3D films ran 20–30% higher than that of 2D films, and 3D films comprised 20% of the new films released. Nevertheless, American audiences preferred subsequent 2D films to 3D competitors, although 3D response remained strong outside the United States, where 61% of the world’s 22,000 3D screens were installed. In 2014, there were 64,905 3D screens worldwide, except for the Asian Pacific region (55% annual growth), the annual growth rates of 3D screen numbers have stabilized around 6%–10% (HIS quoted in MPAA, 2015). Another factor in the lack of success of 3D in America might have been the trend toward viewing movies at home, often with digital playback. In 2010, home video purchases and rentals reached $18.8 billion in North America, compared with only $10.6 billion spent at theaters (Amobi, 2011b). U.S. home entertainment spending rose to $20.8 billion in 2017, with revenues in the physical market shrinking ($12 billion in 2016) and digital subscriptions to web streaming (e.g. Netflix) soaring (Digital Entertainment Group, 2018). In the meantime, the 2014 U.S. domestic box office slipped 1.4% to $10.44 billion (Nash Information Services quoted in Willens, 2015) and remained at a similar level for the next three years (Digital Entertainment Group, 2017).
Globally, the Asian Pacific region and Latin America have been the main contributors to global box office revenue since 2004 (MPAA, 2017). And the bloom of the Chinese movie market has been a major reason for the increase of global revenue. Chinese box office revenue continued to soar to $6.78 billion in 2015, this figure was only $1.51 billion in 2011, and a 48.7% annual growth rate in 2015 was also a new historical record for the Chinese movie market (State Administration of Press, Publication, Radio, Film and TV, 2016).
Audio Recording
Thomas Edison expanded on experiments from the 1850s by Leon Scott de Martinville to produce a talking machine or phonograph in 1877 that played back sound recordings from etchings in tin foil. Edison later replaced the foil with wax. In the 1880s, Emile Berliner created the first flat records from metal and shellac designed to play on his gramophone, providing mass production of recordings. The early standard recordings played at 78 revolutions per minute (rpm). After shellac became a scarce commodity because of World War II, records were manufactured from polyvinyl plastic. In 1948, CBS Records produced the long-playing record that turned at 33-1/3 rpm, extending the playing time from three to four minutes to 10 minutes. RCA countered in 1949 with 45 rpm records that were incompatible with machines that played other formats. After a five-year war of formats, record players were manufactured that would play recordings at all of the speeds (Campbell, 2002).
The Germans used plastic magnetic tape for sound recording during World War II. After the Americans confiscated some of the tapes, the technology was adopted and improved, becoming a boon for Western audio editing and multiple track recordings that played on bulky reel-to-reel machines. By the 1960s, the reels were encased in plastic cases, variously known as 8-track tapes and compact audio cassettes, which would prove to be deadly competition in the 1970s for single song records playing at 45 rpm and long-playing albums playing at 33-1/3 rpm. Thomas Stockholm began recording sound digitally in the 1970s, and the introduction of compact disc (CD) recordings in 1983 decimated the sales performance of earlier analog media types (Campbell, 2002). Tables 2.6 and 2.6A and Figures 2.7 and 2.7A on the companion website (www.tfi.com/ctu) show that total unit sales of recorded music generally increased from the early 1970s through 2004 and kept declining after that mainly because of the rapid decline in CD sales. Figure 2.7a shows trends in downloaded music.
The 21st century saw an explosion in new digital delivery systems for music. Digital audio players, which had their first limited popularity in 1998 (Beaumont, 2008), hit a new gear of growth with the 2001 introduction of the Apple iPod, which increased the storage capacity and became responsible for about 19% of music sales within its first decade. Apple’s online iTunes store followed in 2003, soon becoming the world’s largest music seller (Amobi, 2009). However, as shown in Table 2.6A, notwithstanding with the drop in CD sales, a new upward trend was prompted by the emergence of paid online music subscriptions, sound exchange, synchronization, etc. Revenue-wise, paid subscriptions generated $2.26 billion, while CD revenue declined to $1.17 billion. Again, we are witnessing another “technological dynasty” after the “CD dynasty”, the “cassette dynasty” and the “LP/EP dynasty” of recorded music (RIAA, 2017).
Radio
Guglielmo Marconi’s wireless messages in 1895 on his father’s estate led to his establishing a British company to profit from ship-to-ship and ship-to-shore messaging. He formed a U.S. subsidiary in 1899 that would become the American Marconi Company. Reginald A. Fessenden and Lee De Forest independently transmitted voice by means of wireless radio in 1906, and a radio broadcast from the stage of a performance by Enrico Caruso occurred in 1910. Various U.S. companies and Marconi’s British company owned important patents that were necessary to the development of the infant industry, so the U.S. firms, including AT&T formed the Radio Corporation of America (RCA) to buy the patent rights from Marconi.
The debate still rages over the question of who became the first broadcaster among KDKA in Pittsburgh (Pennsylvania), WHA in Madison (Wisconsin), WWJ in Detroit (Michigan), and KQW in San Jose (California). In 1919, Dr. Frank Conrad of Westinghouse broadcast music from his phonograph in his garage in East Pittsburgh. Westinghouse’s KDKA in Pittsburgh announced the presidential election returns over the airwaves on November 2, 1920. By January 1, 1922, the Secretary of Commerce had issued 30 broadcast licenses, and the number of licensees swelled to 556 by early 1923. By 1924, RCA owned a station in New York, and Westinghouse expanded to Chicago, Philadelphia, and Boston. In 1922, AT&T withdrew from RCA and started WEAF in New York, the first radio station supported by commercials. In 1923, AT&T linked WEAF with WNAC in Boston by the company’s telephone lines for a simultaneous program. This began the first network, which grew to 26 stations by 1925. RCA linked its stations with telegraph lines, which failed to match the voice quality of the transmissions of AT&T. However, AT&T wanted out of the new business and sold WEAF in 1926 to the National Broadcasting Company, a subsidiary of RCA (White, 1971).
The 1930 penetration of radio sets in American households reached 40%, then approximately doubled over the next 10 years, passing 90% by 1947 (Brown, 2006). Table 2.7 and Figure 2.8, on the companion website (www.tfi.com/ctu), show the rapid rate of increase in the number of radio households from 1922 through the early 1980s, when the rate of increase declined. The increases resumed until 1993, when they began to level off.
Although thousands of radio stations were transmitting via the Internet by 2000, Channel1031.com became the first station to cease using FM and move exclusively to the Internet in September 2000 (Raphael, 2000). Many other stations were operating only on the Internet when questions about fees for commercial performers and royalties for music played on the Web arose. In 2002, the Librarian of Congress set royalty rates for Internet transmissions of sound recordings (U.S. Copyright Office, 2003). A federal court upheld the right of the Copyright Office to establish fees on streaming music over the Internet (Bonneville v. Peters, 2001).
In March 2001, the first two American digital audio satellites were launched, offering the promise of hundreds of satellite radio channels (Associated Press, 2001). Consumers were expected to pay about $9.95 per month for access to commercial-free programming that would be targeted to automobile receivers. The system included amplification from about 1,300 ground antennas. By the end of 2003, about 1.6 million satellite radio subscribers tuned to the two top providers, XM and Sirius (Schaeffler, 2004). These two players merged soon before the 2008 stock market crisis, during which the new company, Sirius XM Radio, lost nearly all of its stock value. In 2011, the service was used by 20.5 million subscribers, with its market value beginning to recover (Sirius XM Radio, 2011). The company continues to attract new subscribers and reported its highest subscriber growth since 2007 in 2015 with a 30% growth rate to 29.6 million subscribers; this number continued to grow to more than 32.7 million in 2017 (Sirius XM Radio, 2016; 2018).
Television
Paul Nipkow invented a scanning disk device in the 1880s that provided the basis from which other inventions would develop into television. In 1927, Philo Farnsworth became the first to electronically transmit a picture over the air. Fittingly, he transmitted the image of a dollar sign. In 1930, he received a patent for the first electronic television, one of many patents for which RCA would be forced, after court challenges, to negotiate. By 1932, Vladimir Zworykin discovered a means of converting light rays into electronic signals that could be transmitted and reconstructed at a receiving device. RCA offered the first public demonstration of television at the 1939 World’s Fair.
The FCC designated 13 channels in 1941 for use in transmitting black-and-white television, and the commission issued almost 100 television station broadcasting licenses before placing a freeze on new licenses in 1948. The freeze offered time to settle technical issues, and it ran longer because of U.S. involvement in the Korean War (Campbell, 2002). As shown in Table 2.8 on the companion website (www.tfi.com/ctu), nearly 4 million households had television sets by 1950, a 9% penetration rate that would escalate to 87% a decade later. Penetration has remained steady at about 98% since 1980 until a recent small slide to about 96% in 2014. Figure 2.8 illustrates the meteoric rise in the number of households with television by year from 1946 through 2015. In 2010, 288.5 million Americans had televisions, up by 0.8% from 2009, and average monthly time spent viewing reached 158 hours and 47 minutes, an increase of 0.2% from the previous year (Amobi, 2011a). In 2015, Nielsen estimated that 296 million persons age 2 and older lived in 116.3 million homes that have TV, which showed that “Both the universe of U.S. television homes and the potential TV audience in those homes continue to grow” (Nielsen, 2015b). In 2014, Americans were spending an average of 141 hours per month watching TV and paid more attention to online video streaming and Over-The-Top TV service such as Netflix (IDATE quoted in Statista, 2016).
By the 1980s, Japanese high-definition television (HDTV) increased the potential resolution to more than 1,100 lines of data in a television picture. This increase enabled a much higher-quality image to be transmitted with less electromagnetic spectrum space per signal. In 1996, the FCC approved a digital television transmission standard and authorized broadcast television stations a second channel for a 10-year period to allow the transition to HDTV. As discussed in Chapter 6, that transition made all older analog television sets obsolete because they cannot process HDTV signals (Campbell, 2002).
The FCC (2002) initially set May 2002 as the deadline by which all U.S. commercial television broadcasters were required to be broadcasting digital television signals. Progress toward digital television broadcasting fell short of FCC requirements that all affiliates of the top four networks in the top 10 markets transmit digital signals by May 1, 1999.
Within the 10 largest television markets, all except one network affiliate had begun HDTV broadcasts by August 1, 2001. By that date, 83% of American television stations had received construction permits for HDTV facilities or a license to broadcast HDTV signals (FCC, 2002). HDTV penetration into the home marketplace would remain slow for the first few years of the 21st century, in part because of the high price of the television sets.
Although 3D television sets were available in 2010, little sales success occurred. The sets were quite expensive, not much 3D television content was available, and the required 3D viewing glasses were inconvenient to wear (Amobi, 2011b).
During the fall 2011–12 television season, The Nielsen Company reported that the number of households with televisions in the United States dropped for the first time since the company began such monitoring in the 1970s. The decline to 114.7 million from 115.9 million television households represented a 2.2% decline, leaving the television penetration at 96.7%. Explanations for the reversal of the long-running trend included the economic recession, but the decline could represent a transition to digital access in which viewers were getting TV from devices other than television sets (Wallenstein, 2011). But the number of television households has since increased again, with Nielsen reporting 116.3 million U.S. television households in 2015 (Nielsen, 2015b).
Cable Television
Cable television began as a means to overcome poor reception for broadcast television signals. John Watson claimed to have developed a master antenna system in 1948, but his records were lost in a fire. Robert J. Tarlton of Lansford (Pennsylvania) and Ed Parsons of Astoria (Oregon) set up working systems in 1949 that used a single antenna to receive programming over the air and distribute it via coaxial cable to multiple users (Baldwin & McVoy, 1983). At first, the FCC chose not to regulate cable, but after the new medium appeared to offer a threat to broadcasters, cable became the focus of heavy government regulation. Under the Reagan administration, attitudes swung toward deregulation, and cable began to flourish. Table 2.9 and Figure 2.9 on the companion website (www.tfi.com/ctu) show the growth of cable systems and subscribers, with penetration remaining below 25% until 1981, but passing the 50% mark before the 1980s ended.
In the first decade of the 21st century, cable customers began receiving access to such options as Internet access, digital video, video on demand, DVRs, HDTV, and telephone services. By fall 2010, 3.2 million (9%) televisions were connected to the Internet (Amobi, 2011b). The success of digital cable led to the FCC decision to eliminate analog broadcast television as of February 17, 2009. However, in September 2007, the FCC unanimously required cable television operators to continue to provide carriage of local television stations that demand it in both analog and digital formats for three years after the conversion date. This action was designed to provide uninterrupted local station service to all cable television subscribers, protecting the 40 million (35%) U.S. households that remained analog-only (Amobi & Kolb, 2007).
Telephone service became widespread via cable during the early years of the 21st century. For years, some cable television operators offered circuit-switched telephone service, attracting 3.6 million subscribers by the end of 2004. Also by that time, the industry offered telephone services via voice over Internet protocol (VoIP) to 38% of cable households, attracting 600,000 subscribers. That number grew to 1.2 million by July 2005 (Amobi, 2005).
The growth of digital cable in the first decade of the new century also saw the growth of video-on-demand (VOD), offering cable television customers the ability to order programming for immediate viewing.
Cable penetration declined in the United States after 2000, as illustrated in Figure 2.9 on the companion website (www.tfi.com/ctu). However, estimated use of a combination of cable and satellite television increased steadily over the same period (U.S. Bureau of the Census, 2008).
Worldwide, pay television flourished in the new century, especially in the digital market. From 2009 to 2014, pay TV subscriptions increased from 648 million households to 923.5 million households. (Statista, 2016). This increase was and is expected to be led by rapid growth in the Asia Pacific region and moderate growth in Latin America and Africa, while pay TV subscription slowly declined in North America and Eastern Europe (Digital TV Research, 2017). At the same time, the number of pay television subscribers in the U.S. was falling, from more than 95 million in 2012 to 94.2 million in 2015 (Dreier, 2016).
Direct Broadcast Satellite and Other Cable TV Competitors
Satellite technology began in the 1940s, but HBO became the first service to use it for distributing entertainment content in 1976 when the company sent programming to its cable affiliates (Amobi & Kolb, 2007). Other networks soon followed this lead, and individual broadcast stations (WTBS, WGN, WWOR, and WPIX) used satellites in the 1970s to expand their audiences beyond their local markets by distributing their signals to cable operators around the U.S.
Competitors for the cable industry include a variety of technologies. Annual FCC reports distinguish between home satellite dish (HSD) and direct broadcast satellite (DBS) systems. Both are included as MVPDs (multi-channel video program distributors), which include cable television, wireless cable systems called multichannel multipoint distribution services (MMDS), and private cable systems called satellite master antenna television (SMATV). Table 2.10 and Figure 2.10 on the companion website for this book (www.tfi.com/ctu), show trends in home satellite dish, DBS, MMDS, and SMATV (or PCO, Private Cable Operator) subscribers. However, the FCC (2013a) noted that little public data was available for the dwindling services of HSD, MMDS, and PCO, citing SNL Kagan conclusions that those services accounted for less than 1% of MVPDs and were expected to continue declining over the coming decade.
In developed markets like the U.S., Internet-based Over-the-Top TV services such as Netflix, Hulu and SlingTV have grown substantially since 2015. SlingTV’s subscriber totals grew from 169,000 in March 2015 to 523,000 in the end of 2015 (Ramachandran, 2016). The number of Netflix subscribers grew to 52.77 million in the U.S. in the third quarter of 2017 (Netflix, 2017) and its international subscribers are accumulating even faster, adding up to 109.25 million subscribers worldwide (Netflix, 2017). In the company’s 2016 long term market view, Netflix reported: “People love TV content, but they don’t love the linear TV experience, where channels present programs only at particular times on non-portable screens with complicated remote controls” (Netflix, 2016). It is possible that the concept of TV is again being redefined by people’s need for cord-cutting and screen convergence. From 2014 to 2017, share of cord-cutters/nevers among all U.S. TV households grew from 18.8% to 24.6% (Convergence Consulting Group, 2017).
Home Video
Although VCRs became available to the public in the late 1970s, competing technical standards slowed the adoption of the new devices. After the longer taping capacity of the VHS format won greater public acceptance over the higher-quality images of the Betamax, the popularity of home recording and playback rapidly accelerated, as shown in Table 2.11 and Figure 2.11 on the companion website (www.tfi.com/ctu).
By 2004, rental spending for videotapes and DVDs reached $24.5 billion, far surpassing the $9.4 billion spent for tickets to motion pictures in that year. During 2005, DVD sales increased by 400% over the $4 billion figure for 2000 to $15.7 billion. However, the annual rate of growth reversed direction and slowed that year to 45% and again the following year to 2%. VHS sales amounted to less than $300 million in 2006 (Amobi & Donald, 2007).
Factors in the decline of VHS and DVD use included growth in cable and satellite video-on-demand services, growth of broadband video availability, digital downloading of content, and the transition to DVD Blu-ray format (Amobi, 2009). The competing new formats for playing high-definition content was similar to the one waged in the early years of VCR development between the Betamax and VHS formats. Similarly, in early DVD player development, companies touting competing standards settled a dispute by agreeing to share royalties with the creator of the winning format. Until early 2008, the competition between proponents of the HD-DVD and Blu-ray formats for playing high-definition DVD content remained unresolved, and some studios were planning to distribute motion pictures in both formats. Blu-ray seemed to emerge the victor in 2008 when large companies (e.g., Time Warner, Walmart, Netflix) declared allegiance to that format. By July 2010, Blu-ray penetration reached 17% of American households (Gruenwedel, 2010), and 170 million Blu-ray discs shipped that year (Amobi, 2011b).
Digital video recorders (DVRs, also called personal video recorders, PVRs) debuted during 2000, and about 500,000 units were sold by the end of 2001 (FCC, 2002). The devices save video content on computer hard drives, allowing fast-forwarding, reversing, and pausing of live television; replay of limited minutes of previously displayed live television; automatic recording of all first-run episodes; automatic recording logs; and superior quality to that of analog VCRs. Multiple tuner models allow viewers to watch one program, while recording others simultaneously.
DVR providers generate additional revenues by charging households monthly fees, and satellite DVR households tend to be less likely to drop their satellite subscriptions. Perhaps the most fundamental importance of DVRs is the ability of consumers to make their own programming decisions about when and what they watch. This flexibility threatens the revenue base of network television in several ways, including empowering viewers to skip commercials. Advertiser responses included sponsorships and product placements within programming (Amobi, 2005).
Reflecting the popularity of the DVR, time shifting was practiced in 2010 by 107.1 million American households (up 13.2% from 2009). Time shifted viewing increased by 12.2% in 2010 from 2009 to an average of 10 hours and 46 minutes monthly (Amobi, 2011a). As shown in Table 2.11 on the companion website (www.tfi.com/ctu), its penetration rate also bounced back to 45.1% in 2014, however, it declined again in 2016 (Plastics Industry Association, 2017).
The Digital Era
The digital era represents a transition in modes of delivery of mediated content. Although the tools of using digital media may have changed, in many cases, the content remains remarkably stable. With other media, such as social media, the digital content fostered new modes of communicating. This section contains histories of the development of computers and the Internet. Segments of earlier discussions could be considered part of the digital era, such as audio recording, HDTV, films on DVD, etc., but discussions of those segments remain under earlier eras.
Computers
The history of computing traces its origins back thousands of years to such practices as using bones as counters (Hofstra University, 2000). Intel introduced the first microprocessor in 1971. The MITS Altair, with an 8080 processor and 256 bytes of RAM (random access memory), sold for $498 in 1975, introducing the desktop computer to individuals. In 1977, Radio Shack offered the TRS80 home computer, and the Apple II set a new standard for personal computing, selling for $1,298. Other companies began introducing personal computers, and, by 1978, 212,000 personal computers were shipped for sale.
Early business adoption of computers served primarily to assist practices such as accounting. When computers became small enough to sit on office desktops in the 1980s, word processing became popular and fueled interest in home computers. With the growth of networking and the Internet in the 1990s, both businesses and consumers began buying computers in large numbers. Computer shipments around the world grew annually by more than 20% between 1991 and 1995 (Kessler, 2007).
By 1997, the majority of American households with annual incomes greater than $50,000 owned a personal computer. At the time, those computers sold for about $2,000, exceeding the reach of lower income groups. By the late 1990s, prices dropped below $1,000 per system (Kessler, 2007), and American households passed the 60% penetration mark within a couple of years (U.S. Bureau of the Census, 2008).
Table 2.12 and Figure 2.12 on the companion website (www.tfi.com/ctu) trace the rapid and steady rise in American computer shipments and home penetration. After 2006, U.S. PC shipments started to decline and with penetration reaching 65.3% in 2015 (IDC, 2016). By 1998, 42.1% of American households owned personal computers (U.S. Bureau of the Census, 2006). After the start of the 21st century, personal computer prices declined, and penetration increased from 63% in 2000 to 77% in 2008 (Forrester Research as cited in Kessler, 2011). Worldwide personal computer sales increased by 34% from 287 million in 2008 to 385 million in 2011 (IDC as cited Kessler, 2011). However, this number suffered from a 3.2% decrease in 2012 (IDC, 2016). This downward trend continued, in 2016 worldwide shipments were down to 260 million, lower than in 2008 (IDC, 2015b).
IDC (2017) also predicted that the downward trend would continue. However, while pointing out that shipments of desktops and slate tables would decline, it predicted that shipments of detachable tablets would increase from 21.5 million units in 2016 to 37.1 units in 2021. It is important to note that media convergence is present even with PCs, as an analyst from IDC pointed out: “a silver lining is that the industry has continued to refine the more mobile aspects of personal computers—contributing to higher growth in Convertible & Ultraslim Notebooks” (IDC, 2015c).
Internet
The Internet began in the 1960s with ARPANET, or the Advanced Research Projects Agency (ARPA) network project, under the auspices of the U.S. Defense Department. The project intended to serve the military and researchers with multiple paths of linking computers together for sharing data in a system that would remain operational even when traditional communications might become unavailable. Early users—mostly university and research lab personnel—took advantage of electronic mail and posting information on computer bulletin boards. Usage increased dramatically in 1982 after the National Science Foundation (NSF) supported high-speed linkage of multiple locations around the United States. After the collapse of the Soviet Union in the late 1980s, military users abandoned ARPANET, but private users continued to use it and multimedia transmissions of audio and video became possible once this content could be digitized. More than 150,000 regional computer networks and 95 million computer servers hosted data for Internet users (Campbell, 2002).
Penetration and Usage
During the first decade of the 21st century, the Internet became the primary reason that consumers purchased new computers (Kessler, 2007). Cable modems and digital subscriber line (DSL) telephone line connections increased among home users as the means for connecting to the Internet, as more than half of American households accessed the Internet with high-speed broadband connections.
Tables 2.13 and 2.14 and Figures 2.13 and 2.14 on the companion website (www.tfi.com/ctu) show trends in Internet penetration in the United States. By 2008, 74 million (63%) American households had high-speed broadband access (Kessler, 2011). In June 2013, 91,342,000 fixed broadband subscriptions and 299,447,000 million American subscribers had wireless broadband subscriptions (OECD, 2013). In 2012, although the number of DSL+ users decreased, the numbers on other fronts are showing growth (FCC, 2013b). In 2013, however, subscription to all types of Internet connections declined, and resulted in a 6% decline in total penetration (FCC, 2014). In recent years, however, the penetration gradually climbed up to 76.2% in 2016, this rate is the highest recorded Internet penetration in the U.S. so far (ITU, 2017).
Synthesis
Although this chapter has emphasized the importance of quantitative records of technology adoption, any understanding and interpretation of these numbers should consider the social contexts and structures in each historical period.
Early visions of the Internet (see Chapter 23) did not include the emphasis on entertainment and information to the general public that has emerged. The combination of this new medium with older media belongs to a phenomenon called convergence, referring to the merging of functions of old and new media (Grant, 2009). By 2002, the FCC (2002) reported that the most important type of convergence related to video content is the joining of Internet services. The report also noted that companies from many business areas were providing a variety of video, data, and other communications services.
The word convergence itself excludes the idea that technologies are monolithic constructs that symbolize the separation between two or more types of products. Rather, we see that older media, including both print and electronic types, have gone through transitions from their original forms into digital media.
In this way, many of the core assumptions and social roles of older media have converged with new desires and imaginations of society, and then take form in new media (Castells, 2011). Such technological convergence is compatible with both the power structure of the current society and that of a desired society (Habermas, 1991) which (was) inspired (by) the process of liberal movements, democratic transitions, capitalist motivations and globalization (Ravenhill, 2014).
For example, print media, with the help of a complex writing system, largely protected the centrality and authority of government power in ancient China. When government announcements were replaced by folklore announcements (i.e. the press), and when the printing press abandoned its paper form and went online, organizational power and authority decreased to be replaced with individual power.
However, this change does not suggest that the core functions of print media have changed: governmental power is now represented by individual power in democratic societies and it has become more invisible with technological advancements. “Print media” still carries an assumption of authority whether it is distributed using ink or electricity; the difference is that such authority is more interactive.
Just as media forms began converging nearly a century ago when radios and record players merged in the same appliance, media in recent years have been converging at a more rapid pace. As the popularity of print media generally declined throughout the 1990s, the popularity of the Internet grew rapidly, particularly with the increase in high-speed broadband connections, for which adoption rates achieved comparability with previous new communications media. Consumer flexibility through the use of digital media became the dominant media consumption theme during the first decade of the new century.
Bibliography
Agnese, J. (2011, October 20). Industry surveys: Publishing & advertising. In E. M. Bossong-Martines (Ed.), Standard & Poor’s industrysSurveys, Vol. 2.
Amobi, T. N. (2005, December 8). Industry surveys: Broadcasting, cable, and satellite industry survey. In E. M. Bossong-Martines (Ed.), Standard & Poor’s industry surveys, 173 (49), Section 2.
Amobi, T. N. (2009). Industry surveys: Movies and home entertainment. In E. M. Bossong-Martines (Ed.), Standard & Poor’s industry surveys, 177 (38), Section 2.
Amobi, T. N. (2011a). Industry surveys: Broadcasting, cable, and satellite. In E. M. Bossong-Martines (Ed.), Standard & Poor’s industry surveys, Vol. 1.
Amobi, T. N. (2011b). Industry surveys: Movies & entertainment. In E. M. Bossong-Martines (Ed.), Standard & Poor’s industry surveys, Vol. 2.
Amobi, T. N. (2013). Industry surveys: Broadcasting, cable, & satellite. In E. M. Bossong-Martines (Ed.), Standard & Poor’s industry surveys, Vol. 1.
Amobi, T. N. & Donald, W. H. (2007, September 20). Industry surveys: Movies and home entertainment. In E. M. Bossong-Martines (Ed.), Standard & Poor’s industry surveys, 175 (38), Section 2.
Amobi, T. N. & Kolb, E. (2007, December 13). Industry surveys: Broadcasting, cable & satellite. In E. M. Bossong-Martines (Ed.), Standard & Poor’s industry surveys, 175 (50), Section 1.
Aronson, S. (1977). Bell’s electrical toy: What’s the use? The sociology of early telephone usage. In I. Pool (Ed.). The social impact of the telephone. Cambridge, MA: The MIT Press, 15-39.
Association of American Publishers. (2017). Publisher Revenue for Trade Books Up 10.2% in November 2016. Retrieved January 15, 2018, from http://newsroom.publishers.org/publisher-revenue-for-trade-books-up-102-in-november-2016/.
Associated Press. (2001, March 20). Audio satellite launched into orbit. New York Times. Retrieved from http://www.nytimes.com/aponline/national/AP-Satellite-Radio.html?ex=986113045&ei=1&en=7af33c7805ed8853.
Baldwin, T. & McVoy, D. (1983). Cable communication. Englewood Cliffs, NJ: Prentice-Hall.
Beaumont, C. (2008, May 10). Dancing to the digital tune As the MP3 turns 10. The Daily Telegraph, p. 19. Retrieved from LexisNexis Database.
Bonneville International Corp., et al. v. Marybeth Peters, as Register of Copyrights, et al. Civ. No. 01-0408, 153 F. Supp.2d 763 (E.D. Pa., August 1, 2001).
Brown, D. & Bryant, J. (1989). An annotated statistical abstract of communications media in the United States. In J. Salvaggio & J. Bryant (Eds.), Media use in the information age: Emerging patterns of adoption and consumer use. Hillsdale, NJ: Lawrence Erlbaum Associates, 259-302.
Brown, D. (1996). A statistical update of selected American communications media. In Grant, A. E. (Ed.), Communication Technology Update (5th ed.). Boston, MA: Focal Press, 327-355.
Brown, D. (1998). Trends in selected U. S. communications media. In Grant, A. E. & Meadows, J. H. (Eds.), Communication Technology Update (6th ed.). Boston, MA: Focal Press, 279-305.
Brown, D. (2000). Trends in selected U. S. communications media. In Grant, A. E. & Meadows, J. H. (Eds.), Communication Technology Update (7th ed.). Boston, MA: Focal Press, 299-324.
Brown, D. (2002). Communication technology timeline. In A. E. Grant & J. H. Meadows (Eds.), Communication technology update (8th ed.) Boston: Focal Press, 7-45.
Brown, D. (2004). Communication technology timeline. In A. E. Grant & J. H. Meadows (Eds.). Communication technology update (9th ed.). Boston: Focal Press, 7-46.
Brown, D. (2006). Communication technology timeline. In A. E. Grant & J. H. Meadows (Eds.), Communication technology update (10th ed.). Boston: Focal Press. 7-46.
Brown, D. (2008). Historical perspectives on communication technology. In A. E. Grant & J. H. Meadows (Eds.), Communication technology update and fundamentals (11th ed.). Boston: Focal Press. 11-42.
Brown, D. (2010). Historical perspectives on communication technology. In A. E. Grant & J. H. Meadows (Eds.), Communication technology update and fundamentals (12th ed.). Boston: Focal Press. 9-46.
Brown, D. (2012). Historical perspectives on communication technology. In A. E. Grant & J. H. Meadows (Eds.), Communication technology update and fundamentals (13th ed.). Boston: Focal Press. 9-24.
Brown, D. (2014). Historical perspectives on communication technology. In A. E. Grant & J. H. Meadows (Eds.), Communication technology update and fundamentals (14th ed.). Boston: Focal Press. 9-20.
Campbell, R. (2002). Media & culture. Boston, MA: Bedford/St. Martins.
Castells, M. (2011). The rise of the network society: The information age: Economy, society, and culture (Vol. 1). John Wiley & Sons.
Cicero, M. T. (1876). Orator ad M. Brutum. BG Teubner.
Convergence Consulting Group. (2017). The Battle for the North American (US/Canada) Couch Potato: Online & Traditional TV and Movie Distribution. Retrieved January 14, 2018, from http://www.convergenceonline.com/downloads/New-Content2017.pdf?lbisphpreq=1.
CTIA. (2017). Annual Wireless Industry Survey. Retrieved January 15, 2018, from https://www.ctia.org/industry-data/ctiaannual-wireless-industry-survey.
Digital Entertainment Group. (2017). DEG Year End 2016 Home Entertainment Report. from http://degonline.org/portfolio_page/deg-year-end-2016-home-entertainment-report/.
Digital Entertainment Group. (2018). DEG Year End 2017 Home Entertainment Report. from http://degonline.org/portfolio_page/deg-year-end-2017-home-entertainment-report/.
Digital TV Research. (2017). Digital TV Research’s July 2017 newsletter. Retrieved January 14, 2018, from https://www.digitaltvresearch.com/press-releases?id=204.
Dillon, D. (2011). E-books pose major challenge for publishers, libraries. In D. Bogart (Ed.), Library and book trade almanac (pp. 3-16). Medford, NJ: Information Today, Inc.
Dreier, T. (2016, March 11). Pay TV industry losses increase to 385,000 subscribers in 2015. Retrieved from: http://www.streamingmedia.com/Articles/Editorial/Featured-Articles/Pay-TV-Industry-Losses-Increase-to-385000-Subscribers-in-2015-109711.aspx.
Federal Communications Commission. (2002, January 14). In the matter of annual assessment of the status of competition in the market for the delivery of video programming (eighth annual report). CS Docket No. 01-129. Washington, DC 20554.
Federal Communications Commission. (2005). In the matter of Implementation of Section 6002(b) of the Omnibus Budget Reconciliation Act of 1993: Annual report and analysis of competitive market conditions with respect to commercial mobile services (10th report). WT Docket No. 05-71. Washington, DC 20554.
Federal Communications Commission. (2013a, July 22). In the matter of annual assessment of the status of competition in the market for the delivery of video programming (fifteenth annual report). MB Docket No. 12-203. Washington, DC 20554.
Federal Communications Commission. (2013b, December). Internet access services: Status as of December 31, 2012. Retrieved from http://hraunfoss.fcc.gov/edocs_public/attachmatch/DOC-324884A1.pdf.
Federal Communications Commission. (2014, October). Internet access services: Status as of December 31, 2013. Retrieved from https://transition.fcc.gov/Daily_Releases/Daily_Business/2014/db1016/DOC-329973A1.pdf.
FierceWireless. (2017). How Verizon, AT&T, T-Mobile, Sprint and more stacked up in Q3 2017: The top 7 carriers. Retrieved January 12, 2018, from https://www.fiercewireless.com/wireless/how-verizon-at-t-t-mobile-sprint-and-more-stacked-up-q3-2017-top-7-carriers.
Grant, A. E. (2009). Introduction: Dimensions of media convergence. In Grant, A E. and Wilkinson, J. S. (Eds.) Understanding media convergence: The state of the field. New York: Oxford University Press.
Gruenwedel, E. (2010). Report: Blu’s household penetration reaches 17%. Home Media Magazine, 32, 40.
Habermas, J. (1991). The structural transformation of the public sphere: An inquiry into a category of bourgeois society. MIT press.
Hofstra University. (2000). Chronology of computing history. Retrieved from http://www.hofstra.edu/pdf/CompHist_9812tla1.pdf.
Huntzicker, W. (1999). The popular press, 1833–1865. Westport, CT: Greenwood Press.
Ink, G. & Grabois, A. (2000). Book title output and average prices: 1998 final and 1999 preliminary figures, 45th edition. D. Bogart (Ed.). New Providence, NJ: R. R. Bowker, 508-513.
International Data Corporation. (2015a). Worldwide Smartphone Market Will See the First Single-Digit Growth Year on Record, According to IDC [Press release]. Retrieved from http://www.idc.com/getdoc.jsp?containerId=prUS40664915.
International Data Corporation. (2015b). Worldwide PC Shipments Will Continue to Decline into 2016 as the Short-Term Outlook Softens, According to IDC [Press release]. Retrieved from http://www.idc.com/getdoc.jsp?containerId=prUS40704015.
International Data Corporation. (2015c). PC Shipments Expected to Shrink Through 2016 as Currency Devaluations and Inventory Constraints Worsens Outlook, According to IDC [Press release]. Retrieved from http://www.idc.com/getdoc.jsp?
containerId=prUS25866615.
International Data Corporation. (2016). United States Quarterly PC Tracker. Retrieved from http://www.idc.com/tracker/showproductinfo.jsp?prod_id=141.
International Data Corporation. (2017). Worldwide Quarterly Mobile Phone Tracker. Retrieved from https://www.idc.com/tracker/showproductinfo.jsp?prod_id=37.
International Telecommunications Union. (1999). World telecommunications report 1999. Geneva, Switzerland: Author.
ITU. (2017). Percentage of Individuals using the Internet. Retrieved January 15, 2018, from http://www.itu.int/en/ITU-D/
Statistics/Documents/statistics/2017/Individuals_Internet_2000-2016.xls.
Kessler, S. H. (2007, August 26). Industry surveys: Computers: Hardware. In E M. Bossong-Martines (Ed.), Standard & Poor’s industry surveys, 175 (17), Section 2.
Kessler, S. H. (2011). Industry surveys: Computers: Consumer services and the Internet. In E. M. Bossong-Martines (Ed.), Standard & Poor’s industry surveys, Vol. 1.
Lee, J. (1917). History of American journalism. Boston: Houghton Mifflin.
Moorman, J. G. (2013, July). Industry surveys: Publishing and advertising. In E. M. Bossong-Martines (Ed.), Standard & Poor’s industry surveys, Vol 2.
MPAA. (2015). 2014 Theatrical Market Statistics [Press release]. Retrieved from http://www.mpaa.org/wp-content/uploads/2015/03/MPAA-Theatrical-Market-Statistics-2014.pdf.
MPAA. (2017). 2016 Theatrical Market Statistics [Press release]. Retrieved from https://www.mpaa.org/wp-content/uploads/2017/03/2016-Theatrical-Market-Statistics-Report-2.pdf.
Murray, J. (2001). Wireless nation: The frenzied launch of the cellular revolution in America. Cambridge, MA: Perseus Publishing.
Nielsen. (2015a). Q1 2015 Local Watch Report: Where You Live and Its Impact On Your Choices. [Press release] Retrieved from http://www.nielsen.com/us/en/insights/reports/2015/q1-2015-local-watch-report-where-you-live-and-its-impact-on-your-choices.html.
Nielsen. (2015b). Nielsen Estimates 116.3 Million TV Homes In The U.S., Up 0.4%. [Press release] Retrieved from http://www.nielsen.com/us/en/insights/news/2014/nielsen-estimates-116-3-million-tv-homes-in-the-us.html.
Netflix. (2016). Netflix’s View: Internet TV is replacing linear TV. Retrieved from http://ir.netflix.com/long-term-view.cfmOECD. (2013). Broadband and telecom. Retrieved from http://www.oecd.org/internet/broadband/oecdbroad-bandportal.htm.
Netflix. (2017). Consolidated Segment Information. Retrieved January 14, 2018, from https://ir.netflix.com/financial-statements.
OECD. (2013). Broadband and telecom. Retrieved from http://www.oecd.org/internet/broadband/oecdbroadbandportal.htm.
Outerwall. (2016). Outerwall Annual Report to U.S. Security and Exchange Commission. Retrieved January 13, 2018, from http://d1lge852tjjqow.cloudfront.net/CIK-0000941604/a5b4e8c7-6f8f-428d-b176-d9723dcbc772.pdf?noexit=true.
Peters, J. & Donald, W. H. (2007). Industry surveys: Publishing. In E. M. Bossong-Martines (Ed.), Standard & Poor’s industry surveys. 175 (36). Section 1.
Pew Research Center. (2014, January 16). E-Reading Rises as Device Ownership Jumps. Retrieved from http://www.pewinternet.org/files/2014/01/PIP_E-reading_011614.pdf.
Plastics Industry Association. (2017). Watching: Consumer Technology Plastics’ Innovative Chapter in The Consumer Technology Story. from http://www.plasticsindustry.org/sites/plastics.dev/files/PlasticsMarketWatchConsumerTechnologyWebVersion.pdf.
Rainie, L. (2012, January 23). Tablet and e-book reader ownership nearly doubles over the holiday gift-giving period. Pew Research Center’s Internet & American Life Project. Retrieved from http://pewinternet.org/Reports/2012/E-readers-and-tablets.aspx.
Ramachandran, S. (2016, February 18). Dish Network’s Sling TV Has More Than 600,000 Subscribers. Wall Street Journal. Retrieved http://www.wsj.com/article_email/dish-networks-sling-tv-has-more-than-600-000-subscribers-1455825689-
Raphael, J. (2000, September 4). Radio station leaves earth and enters cyberspace. Trading the FM dial for a digital stream. New York Times. Retrieved from http://www.nytimes.com/library/tech/00/09/biztech/articles/04radio.html.
Ravenhill, J. (2014). Global political economy. Oxford University Press.
Rawlinson, N. (2011, April 28). Books vs ebooks. Computer Active. Retrieved from General OneFile database.
The Recording Industry Association of America. (2017). U.S. Sales Database. from https://www.riaa.com/u-s-sales-database/
Schaeffler, J. (2004, February 2). The real satellite radio boom begins. Satellite News, 27 (5). Retrieved from Lexis-Nexis.
Sirius XM Radio Poised for Growth, Finally. (2011, May 10). Newsmax.
Sirius XM Radio. (2016, February 2). SiriusXM Reports Fourth Quarter and Full-Year 2015 Results [Press release]. Retrieved from http://s2.q4cdn.com/835250846/files/doc_financials/annual2015/SiriusXM-Reports-Fourth-Quarter-and-Full-Year-2015-Results.pdf.
Sirius XM Radio. (2018, January 10). SiriusXM Beats 2017 Subscriber Guidance; Issues 2018 Subscriber and Financial Guidance [Press release]. Retrieved from http://investor.siriusxm.com/investor-overview/press-releases/press-release-details/2018/SiriusXM-Beats-2017-Subscriber-Guidance-Issues-2018-Subscriber-and-Financial-Guidance/default.aspx.
State Administration of Press, Publication, Radio, Film and Television of The People’s Republic of China. (2016, January 3). China Box Office Surpassed 44 Billion Yuan in 2015. Retrieved from http://www.sarft.gov.cn/art/2016/1/3/art_160_29536.html.
Statista. (2016). Average daily TV viewing time per person in selected countries worldwide in 2014 (in minutes). Retrieved from http://www.statista.com/statistics/276748/average-daily-tv-viewing-time-per-person-in-selected-countries/.
U.S. Bureau of the Census. (2006). Statistical abstract of the United States: 2006 (125th Ed.). Washington, DC: U.S. Government Printing Office.
U.S. Bureau of the Census. (2008). Statistical abstract of the United States: 2008 (127th Ed.). Washington, DC: U.S. Government Printing Office. Retrieved from http://www.census.gov/compendia/statab/.
U.S. Bureau of the Census. (2010). Statistical abstract of the United States: 2008 (129th Ed.). Washington, DC: U.S. Government Printing Office. Retrieved from http://www.census.gov/compendia/statab/.
US Census Bureau. (2016). 2015 Annual Services Report. Retrieved January 15, 2018, from http://www2.census.gov/services/sas/data/Historical/sas-15.xls.
US Census Bureau. (2017). 2016 Annual Services Report. Retrieved January 15, 2018, from http://www2.census.gov/services/sas/data/table4.xls.
U.S. Copyright Office. (2003). 106th Annual report of the Register of Copyrights for the fiscal year ending September 30, 2003. Washington, DC: Library of Congress.
U.S. Department of Commerce/International Trade Association. (2000). U.S. industry and trade outlook 2000. New York: McGraw-Hill.
Wallenstein, A. (2011, September 16). Tube squeeze: economy, tech spur drop in TV homes. Daily Variety, 3.
White, L. (1971). The American radio. New York: Arno Press.
Willens, M. (2015, January 7). Home Entertainment 2014: US DVD Sales and Rentals Crater, Digital Subscriptions Soar. International Business Times. Retrieved from http://www.ibtimes.com/home-entertainment-2014-us-dvd-sales-rentals-crater-digital-subscriptions-soar-1776440.
Zhu, Y. & Brown, D. (2016). A history of communication technology. In A. E. Grant & J. H. Meadows (Eds.), Communication technology update and fundamentals. Taylor & Francis. 9-24.
_______________
* Doctoral Candidate in the School of Journalism and Mass Communications at the University of South Carolina (Columbia, Sc).
(Zhu and the Editors Acknowledge the Contributions of the Late Dan Brown, Ph.D., who Created the First Versions of this Chapter and the Related Figures and Tables).