CHAPTER 11
Visualizations/Metering
There is a story about Mitch Miller, a figure in American music, who once became frustrated with an engineer paying too much attention to the meters, so he placed tape over all the meters in the studio. As you do your mastering work, you must rely on your ears, not your eyes. For novices, this is a real challenge because it takes time to develop a sense for mastering. This leads many who are just starting out to try to find systematic, often visual ways of working. For instance, they might try a curve-matching equalizer or maybe some metering system that promises better results. There won’t be such a visual approach to mastering any sooner than there will be such an approach to other aspects of creating music, such as songwriting or production. With that said, there are a few benefits visualizations can provide, but they are mostly for details that do not involve tonality.
FFT/Fourier
Every visualization that shows frequency content is based on a mathematical operation called a Fourier transform. It all starts with a waveform/signal. Using it as an input, the Fourier transform is calculated, allowing for the frequency spectrum to be visualized. It would be impossible to make such a calculation instantaneously because it takes some time for frequencies to oscillate. This means that Fourier transform visualizations are only an approximation.
You see Fourier transform visualizations rendered in many different ways, some that look more impressive than others, but essentially they are based on the same concept. Fast Fourier transforms (FFTs) are Fourier transforms that have an optimized algorithm so that they can be calculated much faster than a Fourier transform normally would take to process. An example of the FFT and its formula is shown in Figure 11-1. As of January 2012, there is a new, even faster Fourier transform called the sparse fast Fourier transform (sFFT) that has yet to be widely implemented.
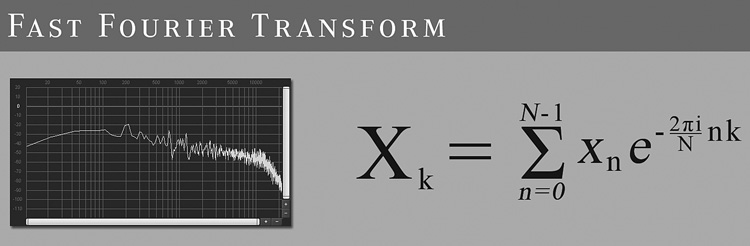
FIGURE 11-1 The fast Fourier transform (FFT) is familiar to most people as a display of the frequency energy of a recording, as shown here.
Using Spectral Analyzers
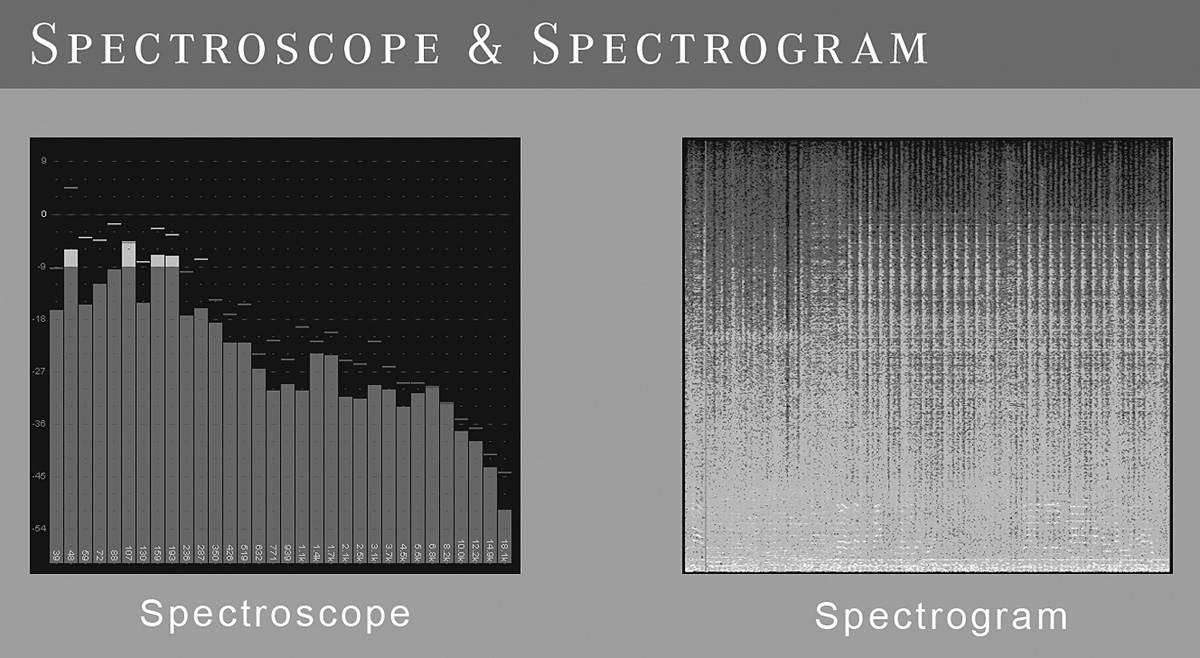
There are two types of spectral analyzers common in mastering: spectrograms and spectroscopes. Such analyzers can help to locate a frequency heard with the ear and can be an alternative to the technique of sweeping with an equalizer and listening. Typically, a spectroscope will show a downward-sloping trend for most masters. Spectrograms often show the frequency energy represented with colors. Some use the frequency spectrum of light (ROYGBIV) to display frequency intensity. Others use their own unique color palettes. Because bass frequencies use the most energy, audio spectrograms for most recordings have a gradient fade from most intense to least intense. Some novice engineers will recommend making adjustments in a way to make the visualizations display have a smooth slope or gradient. It must be reiterated that you must work according to your ears, not your eyes. Examples of the spectroscope and spectrogram are shown in Figure 11-2.
Bit Meters
These meters display the bit rate of a recording. Sometimes, when you think that you may be working at 24 or 32 bits, you actually may be working at 16 bits—accidents can happen. Bit meters keep you apprised of the current bit depth. It is similar to a car overheating light; you may not need it often, but it can be helpful when something goes wrong.
Correlation Meters
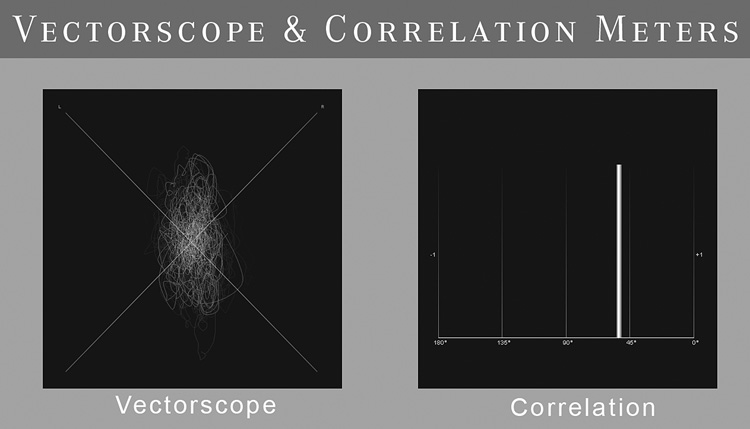
Correlation meters show the similarity of the left and right channels. When the left and right channels are the same (mono), then a correlation meter will show +1. When the left and right channels are exactly out of phase, the meter shows –1. Typically, most recordings are between 0 and +1 and most often are between +0.5 and +1. Most mastering engineers work without using correlation meters. In mastering, it is normally the ears that are relied on for making any adjustment to stereo width. Typically, listening in mono is a better approach than using a correlation meter for detecting phase problems, except in lacquer cutting where a phase correlation meter can be useful. An example of a correlation meter is shown in Figure 11-3.
Vectorscope
Vectorscopes are a type of oscilloscope used with stereo recordings. They are similar to correlation meters, although they show more about the stereo field. When they are completely vertical, it indicates that the source is mono. While a circular shape is sometimes said to be the ideal stereo shape, there is actually no ideal shape. An oval shape that is horizontal could possibly indicate a width that is too wide or a phasing issue. A horizontal shape indicates that the left and right channels are out of phase with each other. An example of a vectorscope is shown in Figure 11-3.
Reconstruction Meters
Reconstruction meters display the levels of a waveform after it is converted to analog. Their primary use is for the detection of intersample peaks. Most mastering engineers take steps (previously discussed in this book) to guard against intersample peaks, making this type of metering unneeded. Solid State Logic (SSL) offers a free reconstruction meter called X-ISM for detection of intersample peaks.
Meter Action/Speed
There are various kinds of meters that can be found in both hardware and digital audio workstations (DAWs), each with different operation. Almost everyone is familiar with VU meters (volume-unit meters), which are fairly slow in an attempt to mimic the way that humans perceive loudness. There are also peak program meters (PPMs), which show audio peaks and are much faster than the human ear. Because of this, PPMs provide very little insight into perceived loudness. VU meters only vaguely represent perceived loudness but are closer than PPMs. Today, LUFS meters are the closest representation we have of loudness using a meter. As always, the ear is the best tool for the job.