
Chapter 7
Cooling Crystallization
Crystallization by cooling is commonly practiced for solutions in which solubility is a strong function of temperature. Cooling alone can achieve the desired degree of crystallization when solubility is sufficiently low at the termination of the cooling operation. In some cases, additional reduction in solubility is necessary to achieve the desired yield. This reduction can be accomplished by either evaporation or anti‐solvent addition, as discussed in Chapters 8 and 9.
Crystallization by cooling can be carried out in a batch or continuous operation. The reader is referred to Chapter 1 for a discussion of the advantages of each. In this chapter, a description of crystallization by batch cooling will be followed by a description of the continuous operation. As discussed in the introduction, a semi‐batch operation is one carried out with changes taking place (in volume, composition, etc.) which affect the critical parameters. An operation, or part of an operation, is considered semicontinuous if, during the operation, conditions in the processing unit being considered are unchanging.
7.1 BATCH OPERATION
A typical cooling operation, as described by Griffiths (1925), is shown in Figure 7.1. Solubility versus temperature is shown by A–B and the width of the metastable region is bounded by A–B and C–D. A solution at point E which is below the equilibrium saturation solubility is cooled until the temperature reaches the equilibrium solubility at E′, at which point crystallization could start. In most cases—depending on a variety of factors including the rate of temperature reduction, ability of the compound to sustain supersaturation, the presence or absence of seed, and the presence of impurities—crystallization will not start at this point but will require some degree of supersaturation before being initiated. This could occur within the metastable region, point F, in which case the concentration could follow along F–G. On the other hand, crystallization may not begin until the temperature reaches point H and could then follow H–G.
Curves F–G and H–G represent two different modes of carrying out crystallization by cooling and would be expected to result in two very different results in terms of physical properties—mean particle size, particle size distribution (PSD), surface area, and bulk density, as well as possible differences in rejection of impurities and occlusion of solvent. Other differences can include a change of morphology and a potential for changes in polymorph formation. These differences result from the supersaturation and surface area histories during the cooling operation, which in turn impact the degree of nucleation and growth.
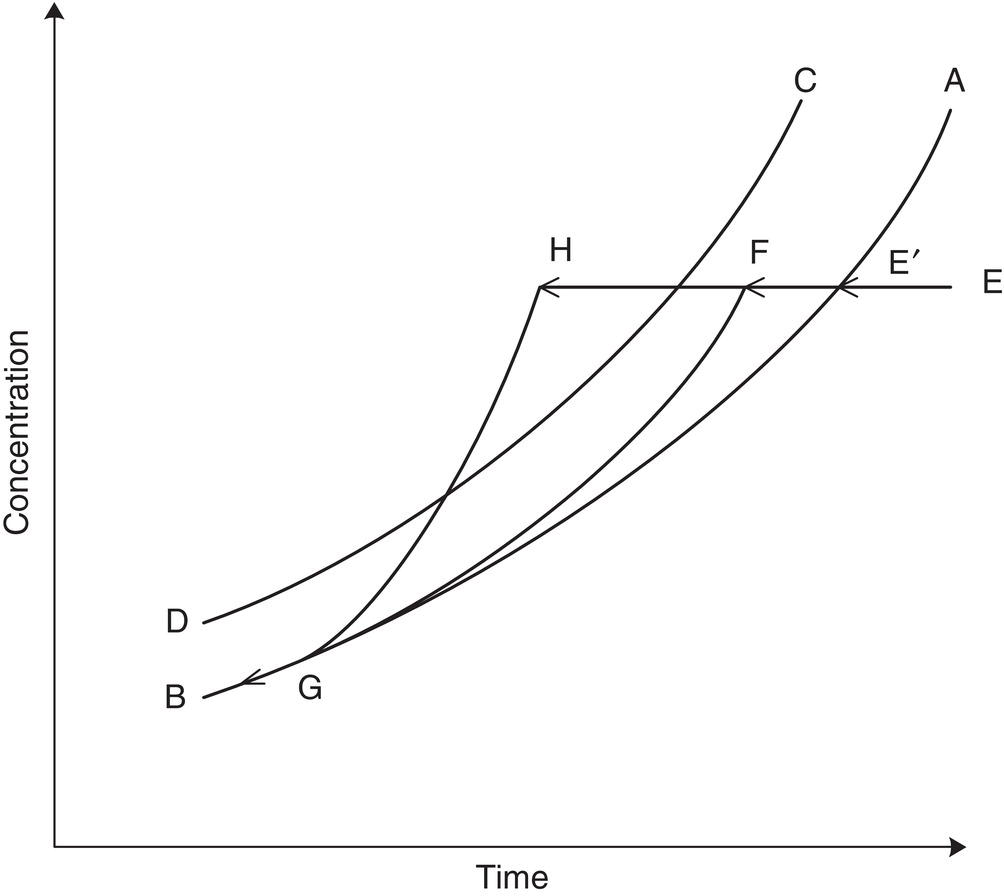
Figure 7.1 Solution concentration time profile.
For crystallization by cooling, the following factors can affect the supersaturation profile either locally or globally:
- rate of cooling and wall temperature
- width of the metastable region
- inherent nucleation and crystal growth rates
- presence or absence of seed and seed quantity
- mixing and mass transfer
- solvent system
- impurities (dissolved and undissolved)
A high slope of solubility versus temperature may require tailored process conditions to avoid localized regions of excessive supersaturation, which can, in turn, cause undesired nucleation and fines in the product. See Example 7.1, which illustrates one solution to this problem.
7.1.1 Rate of Cooling
The rate of cooling can be critical in several ways. Referring again to Figure 7.1, the rate of temperature change, as the saturation curve at point E′ is approached, will influence how far into the metastable region the temperature will be before nucleation sets in. In the case of rapid cooling, the temperature can reach point H before nucleation is induced at this high degree of supersaturation.

Figure 7.2 Nucleation versus supersaturation.
Figure 7.2 shows the well‐known relationship between nucleation rate and supersaturation and illustrates that the number of nuclei that can be generated by a high cooling rate increases exponentially with increasing supersaturation. This number of nuclei, in turn, influences the rest of the crystallization operation for the following reasons:
- A high degree of supersaturation can also cause oiling out and/or enhance agglomeration/aggregation of the developing nuclei, as well as cause occlusion of impurities and/or solvent in the crystals. Control and scale‐up of those processes that pass through stages should be avoided or minimized if possible by the cooling strategies discussed below (see Section 6.4.2).
- A high number at the outset limits growth potential because the ultimate size of the particles is determined by their number. See the discussion of this issue in Section 6.4.3.
- The rate of cooling is one key variable. Applying a fixed‐temperature coolant to the jacket or cooling coils results in “natural” cooling, as illustrated in Figure 7.3. This results in a high rate of cooling with the resulting risk of high supersaturation and nucleation. The other consequence of natural cooling can be exaggerated wall growth resulting from local high supersaturation at the cooling surface.
- Linear cooling is one means of reducing the initial cooling rate, but ideally, temperature‐cooling strategies can be utilized to match the cooling rate with the increasing surface area. These rates were derived by Mullin and Nyvlt (1971) and Nyvlt et al. (1973). Data‐based cooling curves for maximization of final particle size were derived by Jones and Mullin (1974) and further refined by Jones (1974). Wey and Karpinski [in Myerson 2002, pp. 244–245] provide a good discussion of the current status of the effort in this area, which has been very useful for industrial practitioners.
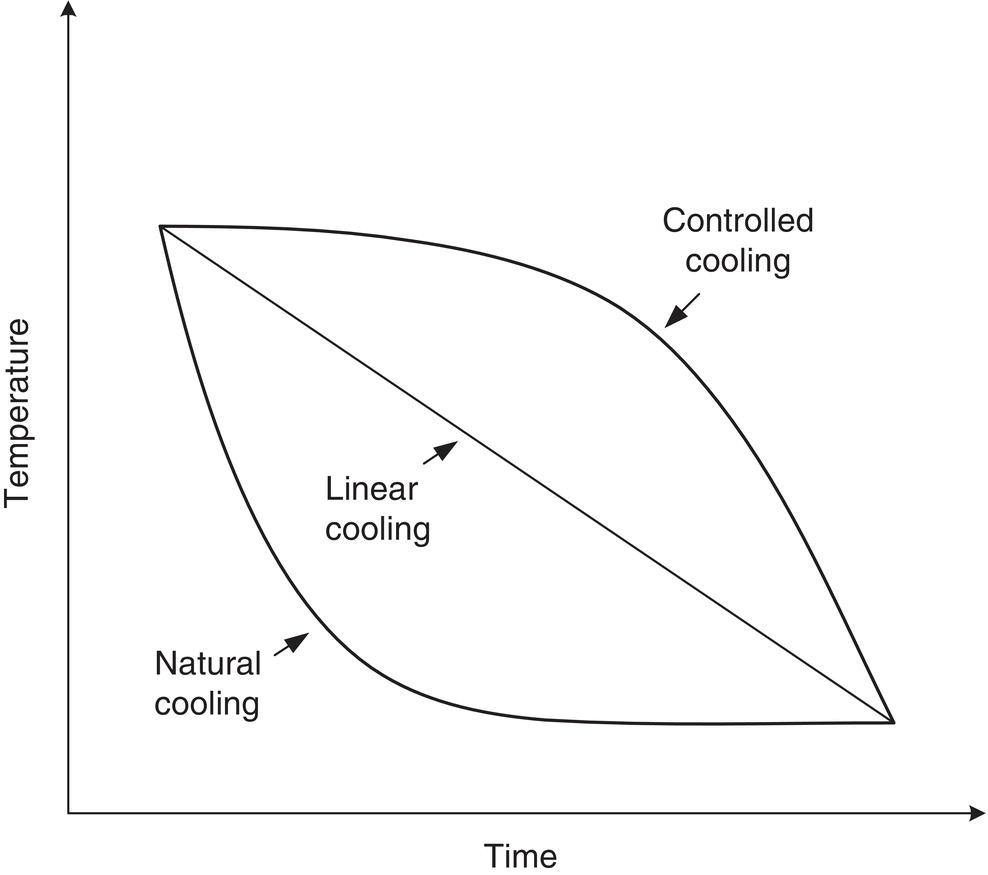
Figure 7.3 Natural cooling versus linear and controlled cooling.
As shown in Figure 7.3, the prescribed cooling rates are much slower at the outset than the natural cooling rate. This is necessary to maintain supersaturation in or close to the growth region when the surface area for growth is low. The cooling rate can be increased as the surface area increases. An added benefit of this method is the potential to reduce scaling by limiting temperature differences across the jacket.
In initiating a cooling operation, the cooling rate should be reduced as the saturation temperature is approached. After seeding or initial nucleation, the temperature can be held constant for a period of time to allow the seed to develop, as discussed by Jones and Mullin (1974) prior to controlled cooling for the remainder of the cycle.
7.1.2 Metastable Region
The lower concentration limit of the metastable region (A–B in Figure 7.1) is the equilibrium solubility of the compound in the solvent system. The upper limit (C–D) represents a supersaturation ratio below which nucleation is relatively slow but above which nucleation will be spontaneous. Chapter 2 gives a more detailed discussion on the metastable region.
Unlike the lower limit, the upper limit is not a result of thermodynamic equilibrium because it is a function of kinetic factors such as rate of cooling. However, it provides a very useful guide in the design of a crystallization process. The width of this region, in terms of the temperature difference between the limits, is a qualitative indication of the ability of the compound to remain supersaturated when the concentration exceeds saturation. Extreme differences have been observed for this temperature range for different compounds or for the same compound at different temperatures, in different solvent systems, and with different levels of dissolved impurities.
In general, to minimize nucleation and to achieve growth, it is desirable to avoid operation above the upper limit, C–D. The possibility of maximizing growth can be realized by operating as close to the saturation curve, A–B, as possible while still maintaining a supersaturation ratio that will give a satisfactory growth rate. This applies to both local and global supersaturation ratios. Methods of achieving this growth regime are discussed later in this chapter and specifically in Example 7.1.
Another factor in the crystallization of organic compounds is the tendency of some to oil out. This tendency increases rapidly in the nucleation regime and provides a further incentive to control the supersaturation with appropriate cooling strategies. The reader is referred to Section 6.4 for a discussion of this phenomenon.
7.1.3 Seeding Versus Spontaneous Nucleation
As noted in previous chapters, the influence of seeding on crystallization is often critical to control of a process, and its importance cannot be overemphasized. Many or most organic solutes in crystallizations driven by cooling will nucleate spontaneously if the cooling is sufficiently rapid. However, control of a process, especially on scale‐up, that depends primarily on spontaneous nucleation can be subject to extreme process variation.
Several factors can be responsible for this unpredictability, including the following:
- Cooling rates are generally reduced at larger scale, primarily because of lower heat transfer surface‐to‐volume ratios.
- For those systems which maintain the same cooling rate on scale‐up, there are generally greater localized differences in supersaturation within the larger vessel because of higher wall film temperature gradients (a lower‐temperature coolant may be utilized or required on the large scale).
- There are differences in bulk mixing which are inherent on scale‐up.
- There is possible batch‐to‐batch variation in dissolved and/or undissolved impurities, which can influence the nucleation rate.
These issues can cause large differences in the number of nuclei generated, which in turn can cause differences in final PSD and other chemical and physical attributes, as discussed above. Therefore, scale‐up can fail both because the laboratory or pilot scale results cannot be achieved on the large scale or simply because of severe batch‐to‐batch variation. Both can affect downstream processing or, in the case of a final product, the physical attributes that may be critical to the end use of the product.
A typical seeded batch cooling crystallization is illustrated in Example 7.2. Also, see Example 7.3 for another instance of seeding from a different perspective.
7.1.4 Mixing and Mass Transfer
Mixing may affect crystallization by cooling in all of the ways outlined in Chapter 5. In particular, wall film thickness and the resultant heat transfer rate are most affected, along with local supersaturation profiles at the cooling surface.
7.1.5 Solvent
Crystallization by cooling is normally carried out in a single solvent—one of the advantages of this method of generating supersaturation. In many cases, however, the substrate may be in a solvent mixture to start out, or a second solvent may be added to reduce the ultimate solubility to increase the yield.
The choice of solvent depends primarily on the dependence of solubility on the temperature that determines both the maximum concentration that can be achieved at the initial temperature and the yield at the final temperature. In addition, the solvent can have a very significant effect on several of the factors discussed above, including width of the metastable region, nucleation, growth rate, and crystal shape. These effects must be determined experimentally, although generalizations can be made regarding some physical and chemical factors, such as hydrogen bonding capability, polarity, and dielectric constant. In addition, the ability of the solvent to form solvates and to affect the crystal form and morphology can be critical. The science of these complex interactions is addressed in Chapter 2 and comprehensively discussed in several texts, including Mullin (2001) and the chapter of Meenan et al. in Myerson (2002).
7.1.6 Impurities (Dissolved and Undissolved)
The importance of the effects of dissolved impurities on nucleation and growth rates cannot be overemphasized. They are extremely system dependent, since the magnitude of their influence depends primarily on molecular structure similarities and dissimilarities between the substrate and the impurities. These structural parameters determine, in turn, the amounts (concentrations) of impurities that will exert significant effects. In most cases, therefore, some experimental data must be obtained on the specific system being considered.
It is important to recognize the importance of these factors in the design of a crystallization process. If significant effects are observed or inferred, control of upstream processing to maintain consistent feed is critical.
Figure 7.4 illustrates the effects of impurities on the formation of different crystal form of one drug substance. For this particular compound, the data show that conversion from the less stable form to a more stable form is much slower or undetected in the actual mother liquor that contains dissolved impurities (upper curve) than it is in pure solvent (lower curve).

Figure 7.4 Effect of impurities on conversion of crystal forms.
Undissolved impurities can influence a process primarily by acting as seed. In some cases, this can be beneficial if seeding is not being used as part of the process. However, dependence on foreign particles as seed is generally not satisfactory.
7.2 CONTINUOUS OPERATIONS
The difference between batch, semi‐batch, continuous, and semicontinuous processing was discussed in Chapter 1. Continuous processes are characterized by parameters which may be geographically distributed within the system but are unchanging with time. Continuous crystallizers are in common use throughout the chemical process industries, but are less so in the pharmaceutical and fine chemical industries because of the typically smaller amounts to be processed. This section on continuous cooling crystallization will discuss continuous operation and point out the differences from batch/semi‐batch operation described above. It will also illustrate some strategies and equipment types used for these operations.
7.2.1 The Attraction of Continuous Processing
The chemical industry has long understood the advantages of continuous processing for many unit operations, including crystallization. First, control of critical parameters in a process is much more easily obtained in time‐invariant, steady‐state operation than in trying to optimize an entire batch’s trajectory. Second, continuous operation ensures, at least in theory, that every molecule in a container of product was treated the same way as every other. In practice, differences caused by residence time distribution effects may significantly influence product quality attributes and must be taken into account in the design of these operations (Paul et al. 2003, chapter 1). Variations due to time and global/local conditions that are inherent in batch/semibatch operation are also likely to be significant in continuous operation. Since continuous crystallizers do not require the time‐consuming (and sometimes difficult) development of a new seed bed for each batch in a growth crystallization process, they are generally able to produce the desired amount of material in smaller equipment. This can result in significant capital savings on both the equipment and its footprint space in the factory.
The above advantages of continuous, over batch operation can often be lost in the pharmaceutical industry, however, for the following reasons:
- Product requirements are often too small to justify the startup and shutdown effort and material required to establish steady‐state operation.
- Batch operation permits harvesting at equilibrium (saturation).
- Maintenance of batch integrity simplifies the quality control function.
- Batch operation allows frequent cleaning of the equipment without upset to the system.
Having noted above the merits of batch processing in some circumstances, it is important to remind the reader that there are crystallizations for which batch operation cannot achieve the desired separation in a practical process. Examples 7.4 and 7.6 illustrate this important point.
7.2.2 Operating Strategy for Continuous Cooling Crystallizers
Figure 7.5 shows a typical flow pattern for a continuous or semicontinuous cooling crystallizer. The system might or might not have a “fines trap,” which can take many forms (a cyclone, for example) but is most often a heated redissolution section somewhere within the apparatus. The entering feed stream and the product outlet stream are usually continuous rather than intermittent for better control. Intermittent product removal is sometimes used, however, for less critical control of slurry flow.
A generalized schematic diagram for feedforward/feedback control of particle size in a continuous or semicontinuous crystallizer, such as that in Figure 7.5, is shown in Figure 7.6. The measurement device can be most easily envisioned as an in‐line particle size analyzer such as a Lasentec focused beam reflectance measurement (FBRM), but it could also be a sampler/offline device combination (even a plain microscope). The most common variant on this control schematic would be elimination of feedforward control, and perhaps of the fines trap as well.
In Figure 7.6, mi is the ith moment of the PSD (i = 0 [number], 1 [diameter or length], 2 [area], or 3 [mass or volume]), whichever makes the most sense from the point of view of the particular process being carried out.
Figure 7.7 illustrates three common flow patterns for operation of a mixed suspension crystallizer. In each, M is the magma (slurry) outlet and O is the overflow.
The first flow pattern in Figure 7.7a, shows the usual mixed suspension, mixed product removal (MSMPR) pattern. The most common example of this is a well‐mixed continuous stirred tank reactor (CSTR).
The second, Figure 7.7b, shows clear liquid overflow, as in a well‐behaved fluidized bed crystallizer or in the semicontinuous stirred tank (SCST) operation illustrated in Example 7.5. The SCST has proven to be a versatile and practical method of maintaining control in critical separation and polymorph control, and can be operated in small and large configurations.
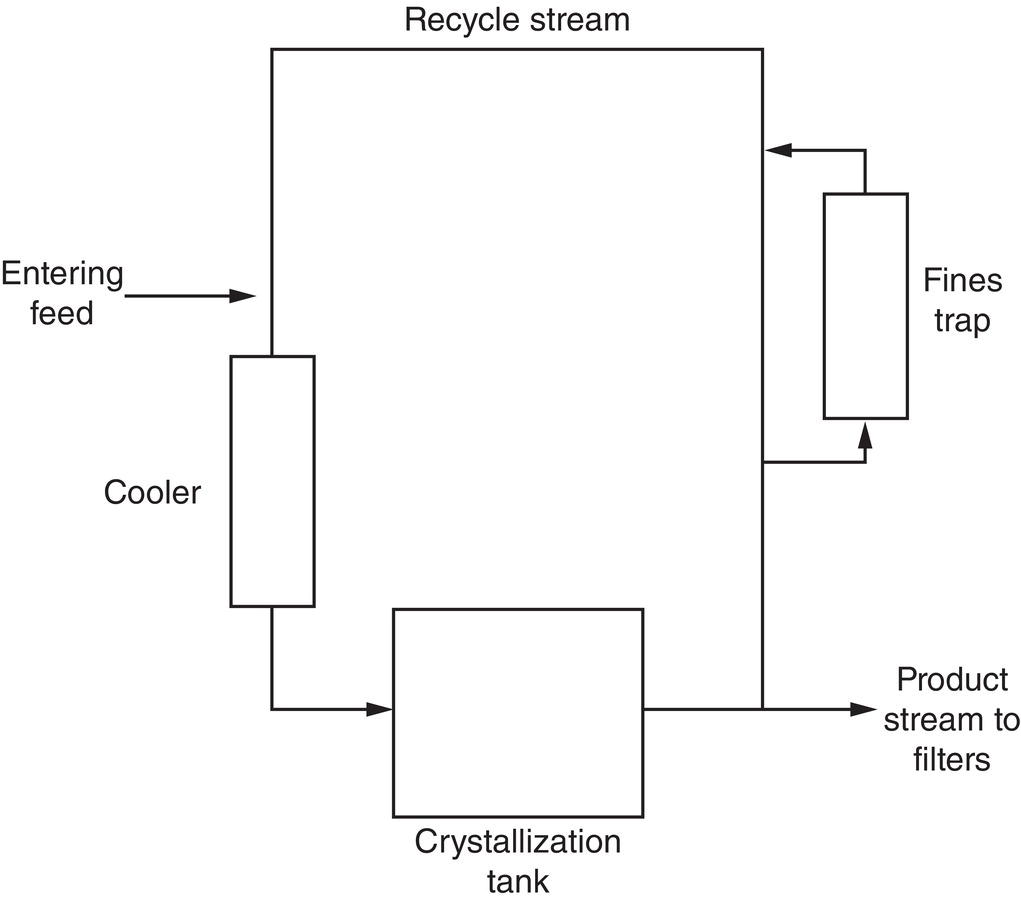
Figure 7.5 Typical flow pattern for a continuous crystallizer.

Figure 7.6 Feedforward/feedback crystallizer control.
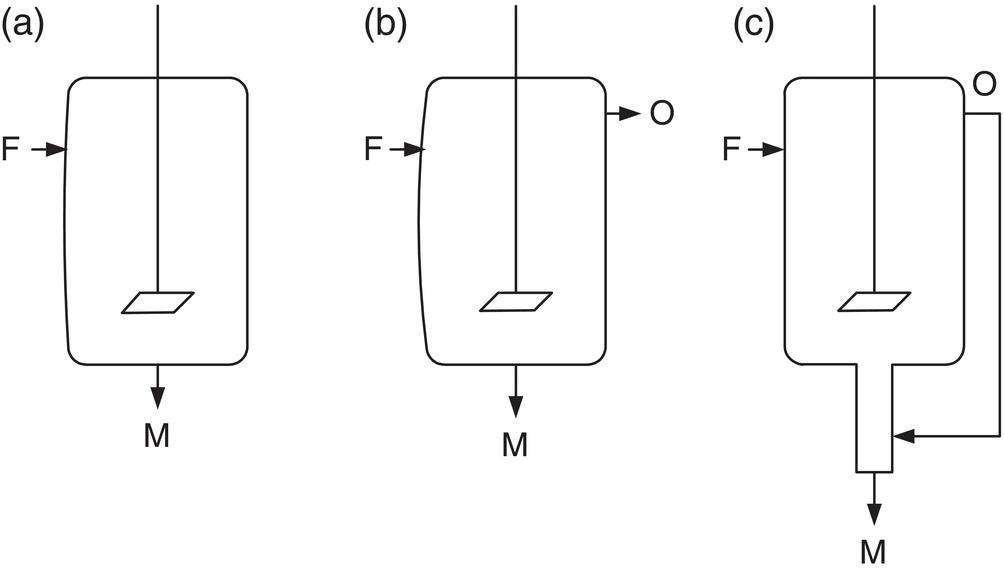
Figure 7.7 (a–c) Flow patterns in mixed suspension crystallizers.
The third, Figure 7.7c, is clear liquid overflow recycling to an elutriating leg which prevents undersized particles from escaping prematurely. Draft tube baffle (DTB) crystallizers contain elutriation legs, but DTB units are more commonly evaporative rather than cooling crystallizers.
Figure 7.8 shows a simplified information flow diagram for a continuous MSMPR crystallizer. Population balance equations (see Chapter 4) can be used to separate nucleation and growth effects. For particles keeping geometric similarity, the surface area of the particles for a given resident mass is reduced linearly with increased linear dimension of the crystals. This reduced surface area is less capable of removing supersaturation in the crystallizer, so the supersaturation increases. Operating at steady state, a well‐run continuous crystallizer maintains these factors in balance while producing product crystals with satisfactory PSD.
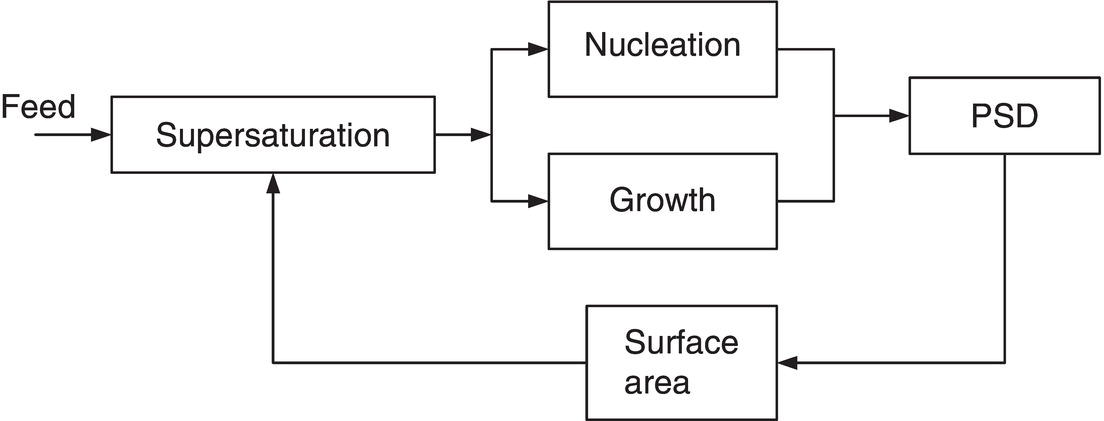
Figure 7.8 Simplified information flow for an MSMPR crystallizer.
7.2.3 Plug Flow and Cascade Operation
In order to increase the driving force for crystallization or increase the yield per pass through the system, a continuous crystallization system can be intentionally operated as a cascade, as shown in Figure 7.9. A significant number of these crystallizers in series become, in effect, a plug flow reactor.
Fluidized bed crystallizers operated in particulate mode (usually the case with liquids) can also come very close to plug flow operation. An example of such crystallizers will be shown in Example 7.6.
7.2.4 Fluidized Bed Continuous Cooling Crystallizer Designs
The pure fluidized bed crystallizers described later in Example 7.6, while designed for a particular purpose, have many similarities with the Oslo commercial surface‐cooled crystallizer shown in Figure 7.10. A fluidized magma in the crystallizer body (E) carries out the crystallization. Feed enters the clear overflow stream (at G), is cooled within the metastable supersaturation region in the cooler (H), and then enters as a fluidizing stream at the bottom of (E).

Figure 7.9 Cascade operation.

Figure 7.10 Flow in an Oslo cooling crystallizer.
Fluidized bed designs have a number of advantages, including the capability for fines removal from the main crystallizer by elutriation (carrying out with the fluidizing liquid) and low shear mixing by fluidization without the need for mechanical agitation.
Resolution of optical isomers via preferential crystallization is outlined in Example 7.6 as an example of the use of tightly controlled supersaturation in a cooling crystallization. This process is discussed in greater detail in Example 13.6.
Example 7.6 illustrates the applicability of good crystallization practice to achieve continuous production of large‐volume pharmaceutical compounds. It also illustrates a crystallization process that is inherently unfeasible by any method other than continuous operation. When carried out using fluidized bed crystallizers, ultrasonic crystal disruption is used, even at factory scale, to maintain a steady‐state population of seed particles in this all‐growth system.
7.3 PROCESS DESIGN—EXAMPLES
Design of a crystallization process requires consideration of the impact of many of the above factors on the resultant chemical purification and physical properties. Process intermediates and final bulk products often require very different crystallization operations in order to achieve specific process outcomes. The following examples illustrate both types of process issues and solution as well as different process designs to achieve specific physical and/or chemical properties.