
Chapter 6 Methodology and approach for DW 2.0
To be successful with DW 2.0, organizations need to adopt a spiral development approach in which numerous small iterations of data warehouse development are accomplished frequently. There should be a period of no longer than 3 months for each iteration of development. The spiral development approach to the building of a data warehouse is a standard practice that has proven its worth around the world as people build data warehouses.
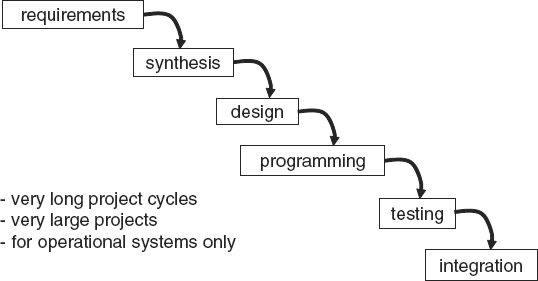
So what is the spiral methodology all about? To describe the spiral methodology, it is necessary first to have a look at its exact opposite, the waterfall development methodology. The diagram in Figure 6.1 illustrates the typical waterfall development methodology life cycle.
The waterfall methodology has also been called “SDLC,” which is short for “systems development life cycle.” Waterfall methods have historically been very successful in delivering online transaction processing systems. These operational systems normally have very long project cycles. They are very large projects, and all the requirements are typically documented up front. During the early days of data warehousing, DW 1.0, it was mistakenly thought that waterfall methodology could be applied to data warehouse projects.
SPIRAL METHODOLOGY—A SUMMARY OF KEY FEATURES
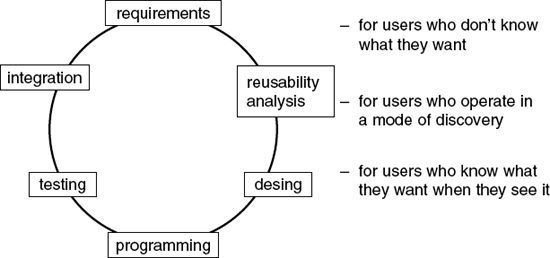
In contrast to the above, the spiral methodology, illustrated in Figure 6.2, is ideally suited to users who do not know what they want. Most of the time when a data warehouse project is undertaken, it is impossible to gather all the business requirements up front. This is not due to anyone’s fault—it is not because the business cannot make up its mind, and it is not because the information technology group is too out of touch to be able to understand the business’s needs. It is simply the nature of the beast. Business intelligence capability is normally developed in a mode of discovery. The members of the business community will ultimately know what they want when they see it—and as soon as they get what they want, they understand that they want and need something else.
The BI requirements goal posts are constantly changing, and it is understandable that this should be the case, because the business is constantly changing. In the development of an operational system, if the business asks for changes to be made to the system after it is deployed, it is seen as a mark of failure. In contrast, change is seen as a very good thing with data warehouse/business intelligence systems. A change request is a sign of success—it means the business is using the warehouse; it means the warehouse has stimulated thought, which has now resulted in a request for more or different information. If no requests for change occur, then the data warehousing initiative is a failure. In short, change is bad in a transaction processing system and change is good in a data warehouse environment.
Many people confuse the spiral methodology with the iterative approach that has its roots in the object-oriented disciplines. Although there are some similarities, the two methodologies are actually quite different.
Some of the hallmarks of the spiral development methodology are as follows:
During the first generation of data warehousing, one voice consistently called for the use of spiral methodologies. Larissa Moss has written several books and given numerous public classes on using spiral methodology for building data warehouses. Organizations that have taken heed have benefited from her guidance. Organizations that have disregarded spiral methodology continue to struggle. As the era of DW 2.0 begins, it is imperative that the lessons of past mistakes be heeded.
Figure 6.3 illustrates Larissa Moss’s “Business Intelligence Road Map” methodology.
At first glance, the major segments of work listed down the left-hand side of Figure 6.3 appear to be just like any waterfall methodology. Indeed, many of the same things that people do on waterfall projects are equally applicable in spiral methodology. The diagram highlights, however, that there is a lot of concurrency happening in the analysis, design, and construction work segments. Put this together with the fact that work can begin at any point in the spiral development life cycle (e.g., it is common to start with construction and then work upward) and one can begin to see how vastly different this methodology is from conventional IT development methodologies.
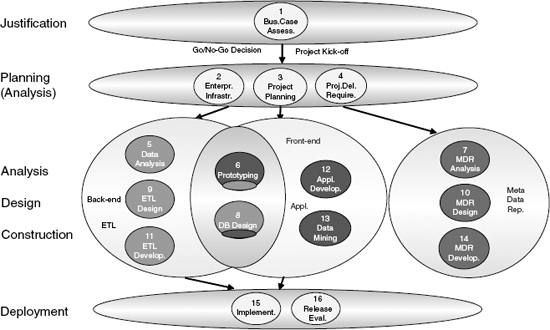
![]() FIGURE 6.3 Larissa’s three spiral parallel development tracks. Courtesy of Larissa T. Moss, Method Focus, Inc.
FIGURE 6.3 Larissa’s three spiral parallel development tracks. Courtesy of Larissa T. Moss, Method Focus, Inc.
Careful consideration must be given to team organization to achieve the concurrent tasks. The diagram in Figure 6.3 highlights three natural groupings of work: back-end work, front-end work, and metadata work. It shows the overlap of back-end and front-end work around prototyping and data base design. The metadata work, although shown off to the right-hand side, is in fact also highly interdependent on the other parallel work. It would probably be more accurate, but less readable, in the diagram to show the metadata work superimposed over the top of the back-end and front-end work. Project management must be able to recognize and manage these interdependencies.
It is important to note that although a data warehouse application iteration can start with construction, the iteration will not be complete unless and until justification, planning, analysis, design, construction, and deployment have all been done. To build an application, it may take several passes through the three spiral work tracks. Although it is true that for each application all steps need to be done, there is normally no need to revisit “Justification” or even some of the other steps in each pass.
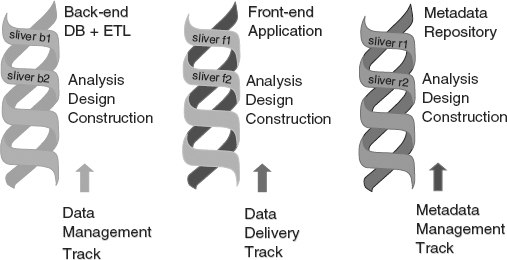
![]() FIGURE 6.4 Another illustration of Larissa’s three parallel development tracks of spiral methodology. After Larissa T. Moss, Method Focus, Inc.
FIGURE 6.4 Another illustration of Larissa’s three parallel development tracks of spiral methodology. After Larissa T. Moss, Method Focus, Inc.
Figure 6.4 provides further insight into the three parallel spiral development tracks.
A spiral methodology produces an application by means of several interim deliverables, or “slivers.” Note that each spiral sliver in Figure 6.4 addresses a very small, but meaningful, component of the overall application scope. The delivery is small and meaningful, but not completed all at once. The diagram shows two slivers per work track—in reality there may be several slivers per work track, and the back-end, front-end, and metadata repository work tracks seldom have equal numbers of slivers. Successive iterations, delivering successive slivers, ultimately deliver the working application.
The scope of each sliver must be kept extremely small. In addition, the scope must be managed very carefully so as to ensure no scope-creep occurs.
The goal of spiral methodology is to build an inventory of reusable assets. Larissa shows in Figure 6.5 how project constraints have to be reshuffled dramatically, with quality being maximized and scope being minimized.
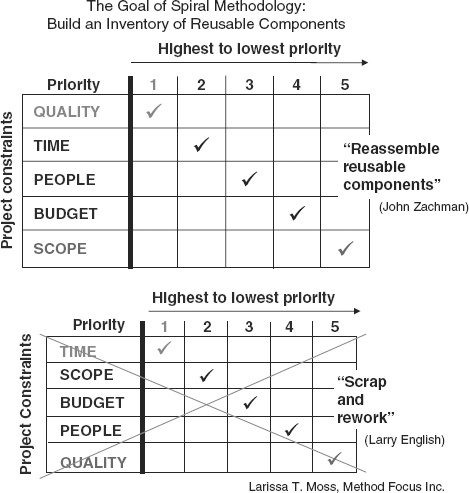
![]() FIGURE 6.5 Project constraint reshuffling and component reuse. Courtesy of Larissa T. Moss, Method Focus, Inc.
FIGURE 6.5 Project constraint reshuffling and component reuse. Courtesy of Larissa T. Moss, Method Focus, Inc.
Using the spiral methodology helps an organization move away from the death spiral of scrap and rework toward a culture based on a return on assets. This new way of thinking about things is designed to focus on reusable components that can be reassembled to meet the business’s demand that things be done cheaper, faster, and better.
Second-generation data warehousing needs to move away from the conventional return on investment (ROI) approach. The return on investment approach has led many organizations to build successive “point solutions” (or data marts), with little or no attention given to the reusability of anything that has been delivered. The ROI imperative says: “get it in as quickly as possible and get some return.” The fact that the initial success cannot be sustained, and the data structures prove to be brittle (not change-enabled), seems to escape the ROI mind-set.
In the world of DW 2.0, success is measured by ROA (return on assets). Has the data been reused? Has the metadata been reused? Have the structural business rules been reused? Is the ETL logic reusable and extensible? Are the components of the presentation layer reusable and flexible?
Introducing a spiral methodology is a critical step toward success in second-generation data warehousing. There are several things that an organization can and must do to make spiral development methodology a certain success. A whole new approach to enterprise data needs to be adopted. This approach is discussed in the remainder of this chapter, encapsulated in a tried and tested approach called the “seven streams approach.”
THE SEVEN STREAMS APPROACH—AN OVERVIEW
The basic premise is that business intelligence initiatives should be seen as programs, not projects. Such business intelligence initiatives should be ongoing, becoming more and more honed and sophisticated as business needs change. To achieve and sustain this in a changing business environment requires more than any “data warehouse in a box” or 30- to 90-day “wonder cure” solution can provide.
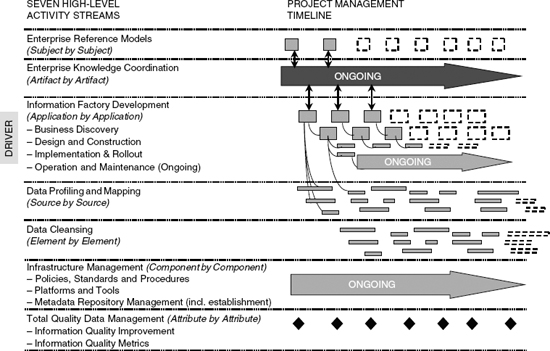
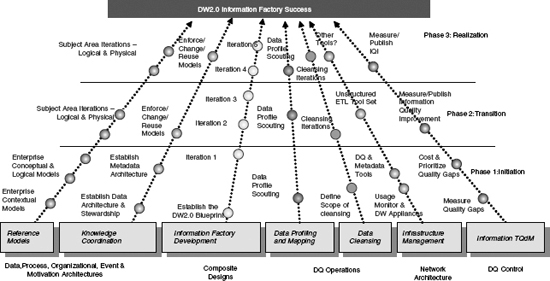
What then are the various factors one needs to take into consideration to achieve sustained success in a business intelligence/data warehousing program? A highly summarized answer to this question is given in the pages that follow, starting with Figure 6.6, which illustrates the seven streams approach—a proven business intelligence planning and delivery framework.
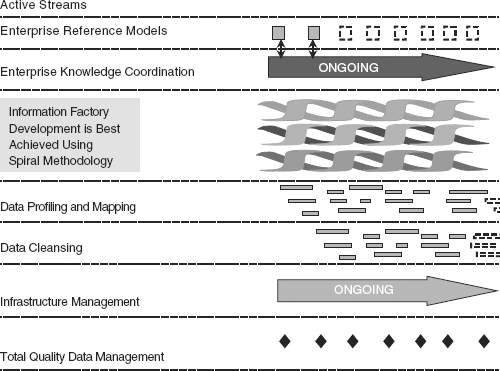
The key thing to note about the seven streams approach is the fact that each activity stream marches to the beat of a different drum. Each stream is simultaneously initiated, is concurrently driven, and needs to be coordinated and monitored. There is no implied sequence in the way the diagram is organized.
ENTERPRISE REFERENCE MODEL STREAM
The first activity stream addresses the creation and continued maintenance of a corporate data model (Figure 6.7). Of course, this is not done by saying, “stop the world while we build this great gargantuan corporate data model.” This is a corporate data model that is built incrementally, subject area by subject area (e.g., customer, product, etc.).
ENTERPRISE KNOWLEDGE COORDINATION STREAM
The next activity stream, knowledge coordination, entails taking the various artifacts that come out of the three data discovery streams (i.e., the corporate data modeling, information factory development, and data profiling streams) and making sense out of those findings, as follows:
The above three sources of data discovery obviously all need to be tied together and resolved in some way, and that is what happens in the corporate knowledge coordination stream. Artifact by artifact, the output from the three data discovery streams is reconciled. A steady-state model is created that provides reusable knowledge about the organization’s data and reliable information that can be delivered to stakeholders at the appropriate time.
It is best practice for knowledge coordinators to make use of the Zachman framework as a classification schema for the reusable artifacts under their custodianship. Figure 6.8 illustrates how top-down and bottom-up knowledge is coordinated, using the backdrop of the Zachman framework as a “thinking tool.”
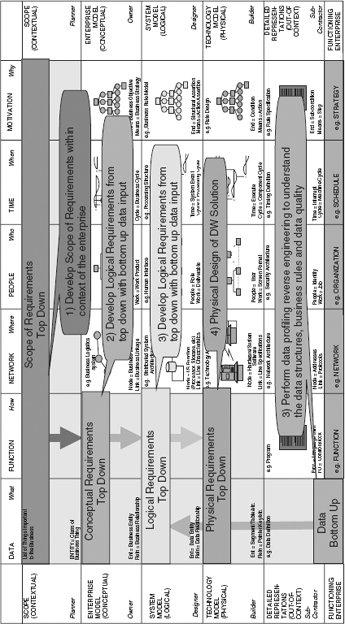
![]() FIGURE 6.8 The knowledge coordination stream makes use of the Zachman framework as a classification schema. Published with permission from John A. Zachman, www.zachmaninternational.com.
FIGURE 6.8 The knowledge coordination stream makes use of the Zachman framework as a classification schema. Published with permission from John A. Zachman, www.zachmaninternational.com.
INFORMATION FACTORY DEVELOPMENT STREAM
The next stream is the information factory development stream. It is here that building of the information factory takes place. The factory is usually built topic by topic. Each topic contains several burning questions. Of course a topic, such as growth, often spans multiple subject areas, such as customer and product. Topics are often grouped into applications, e.g., an agent scorecard. The information factory development stream is the domain of the spiral methodology. This stream is the “driver stream” in that it sets the priorities for the other six streams.
DATA PROFILING AND MAPPING STREAM
The next activity stream is the data profiling and mapping stream. This is where the online transaction processing source systems are examined to understand what the data in those systems looks like in terms of its quality and its completeness. The output of the data profiling exercise enables the data modeler to map the source data to the various targets in the information factory. The data profiling stream is discussed further in Chapter 18.
DATA CORRECTION STREAM (previously called the Data Cleansing Stream)
The next activity stream is the data correction stream. This stream involves going attribute by attribute through the pertinent source systems and determining what data needs to be corrected, completed, or purged and what data correction rules need to be applied. This stream is also discussed further in Chapter 18.
INFRASTRUCTURE STREAM
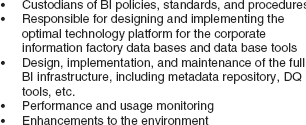
The next activity stream is the infrastructure stream. This stream of activities addresses the supporting infrastructure for the scalability of the information factory, including consideration of people, resources, platforms, tools, policies, standards, and procedures, as indicated in Figure 6.9. The infrastructure stream is undertaken component by component.
TOTAL INFORMATION QUALITY MANAGEMENT STREAM
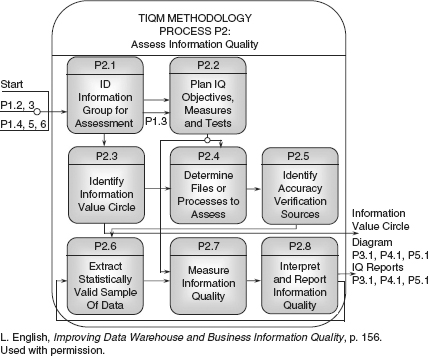
Last but not least, the total information quality management stream concerns data quality monitoring and process improvement, which is achieved process by process. Specific data elements in the environment are examined and their quality is monitored and reported over time. The most comprehensive and rigorous method for addressing total information quality management has been developed by Larry English. His total information quality management methodology (TIQM), formerly called total quality data management (TQdM), consists of several major processes. The “assess information quality” process is shown in Figure 6.10.
Notice that the process is ongoing—see the recursive loop between P2.8 and P2.6 in Figure 6.10. In the world of DW 2.0, the organization should measure the quality of information on a regular basis to assure the process stays in control. It is, after all, a truism that “you cannot manage what you cannot measure.”
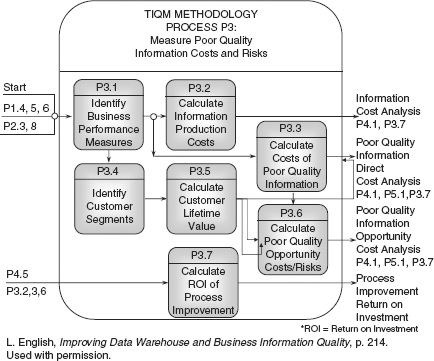
After measuring the extent of information quality problems, including accuracy, completeness, and non-duplication, you should measure and calculate the costs of the poor quality information on the downstream processes, including costs to business intelligence processes. This provides the business case for process improvement to identify and eliminate the root causes of defects at the source and through the information value chain. This process is TIQM Process 3, “measure poor quality information costs and risks,” illustrated in Figure 6.11.
At a minimum you should measure the direct costs of poor quality information following step P3.3. While the opportunity costs are considered “intangible,” they can be dramatic in the form of missed customer revenue and lost customer lifetime value. These are very real costs that come with poor quality information, such as misspelling names, wrong addresses, duplicate customer records, incorrect billing, sending the wrong item on an order.
![]() FIGURE 6.10 Information quality assessment in the total information quality management stream. Courtesy of Larry P. English.
FIGURE 6.10 Information quality assessment in the total information quality management stream. Courtesy of Larry P. English.
![]() FIGURE 6.11 Measurement of the costs of poor quality information and the ROI of information process improvements in TIQM. Courtesy of Larry P. English.
FIGURE 6.11 Measurement of the costs of poor quality information and the ROI of information process improvements in TIQM. Courtesy of Larry P. English.
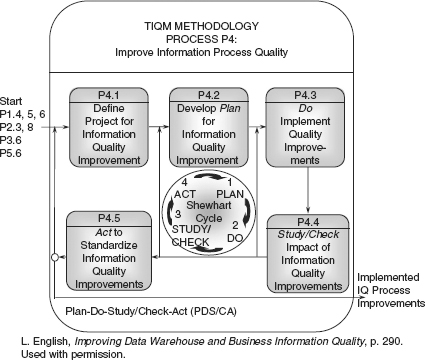
Understanding the costs of poor quality information enables you to focus on the high pay-off areas for process improvement, always taking a Pareto approach of most important to next-most important. The process “improvement cycle of plan-do-check/study-act” is illustrated in TIQM P4, “improve information process quality,” illustrated in Figure 6.12.
Process 4 is the core competency process in TIQM, required to use the name “quality” in the “information quality management” label. For this is the process that eliminates the defects which cause business process failure and information scrap and rework. When this process becomes a habit within an organization, it puts that organization on the path to world-class status. Step P4.1 establishes an initiative for a process improvement based on the organization’s project management guidelines. Step P4.2 first analyzes and identifies the root cause or causes of a broken process causing defective information. This step then defines process improvements that will eliminate the root causes and prevent or significantly reduce the information defects. Step P4.3 implements the improvements to study and assure they have achieved the improvement goals. Step P4.4 analyzes the results to assure the improvements worked and documents the lessons learned. Step P4.5 acts to roll out the improvements to all places where the process is performed, and puts the process in control.
For more information about these TIQM processes, see Larry English’s Improving Data Warehouse and Business Information Quality, Chapters 6, 7, and 9, respectively. Please note that TIQM Process P4 “improving information process quality” is numbered P5. Mr. English is changing it to precede the process for data correction.
SUMMARY
Each of the seven streams in the DW/BI project approach focuses on a different aspect of the corporation’s data architecture and is undertaken using a different and correspondingly appropriate work approach:
Stream 1—Enterprise reference modeling is done subject by subject.
Stream 2—Enterprise knowledge coordination is done artifact by artifact.
Stream 3—Information factory development is done topic by topic.
Stream 4—Data profiling and mapping are done source by source.
Stream 5—Data correction is done attribute by attribute.
Stream 6—Infrastructure management is done component by component.
Stream 7—Total information quality management is done process by process to improve and error-proof processes.
Each stream produces deliverables at different rates. The astute DW/BI program manager will recognize what these different rates and rhythms are, will synchronize the work priorities in each of these concurrent streams, and will use this information to define meaningful releases for the organization. DW/BI program management will produce an overall project road map such as the example shown in Figure 6.13.
The seven streams approach is a framework and tool for designing a DW/BI program that lends itself well to rapid spiral development. The interaction of the seven streams approach and spiral development methodology is graphically depicted in the next few diagrams.
Figure 6.14 illustrates the position of the spiral development methodology in the information factory development stream.
![]() FIGURE 6.14 Spiral development methodology in the seven stream DW/BI approach. How do the spiral methodology and the seven streams approach fit together?
FIGURE 6.14 Spiral development methodology in the seven stream DW/BI approach. How do the spiral methodology and the seven streams approach fit together?
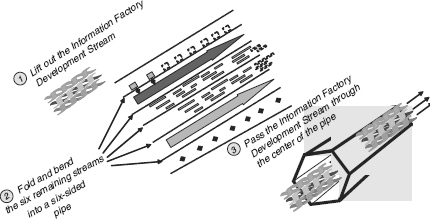
Figure 6.15 illustrates the relationship between the seven streams approach and the spiral methodology.
The spiral methodology has proven most effective for data warehouse projects. The spiral methodology is further enhanced by implementing the seven streams DW/BI approach. Spiral DW/BI development iterations can be expedited if the correct level of attention is given to building the corporate data model, coordinating knowledge about the enterprise, doing proactive data profiling and mapping, doing proactive data cleansing, managing the infrastructure proactively, and establishing the correct culture for total quality data management. The combined impact of the method and the approach means that the development team will not hit as many roadblocks—data models, rules, and definitions will be there waiting for them, data quality anomalies will be known way ahead of time, and the appropriate infrastructure will be in place.
The benefit of spiral development and the seven streams approach is a regular cadence of delivery to the business based on quarterly releases. The challenge is the culture change required from both the IT and the business communities. The most successful organizations manage this culture change through a combination of training in spiral methodology and the seven streams approach, plus mentorship by people with deep skills and experience in both approaches. The combined DW/BI program method and approach must also be supported by the correct governance structure.