
Chapter 7 Statistical processing and DW 2.0
One of the most important functions of any data warehouse is the support of statistical analysis. If an organization has a data warehouse and there is no statistical analysis that is occurring, then a major function of the data warehouse environment is not being exploited. Traditionally, certain industries have made more of the capability of statistical analysis than other industries. While the insurance, manufacturing, and medical research industries have all made extensive use of statistical analysis, there is a place for statistical analysis in practically any industry.
From the end user’s perspective, the kind of data that is revealed by statistical analysis is fundamentally different from information determined in other manners. For one example, statistically generated data is almost always used strategically. There are very few cases in which statistically generated data is used tactically.
Another reason why statistical analysis is different from other forms of analysis is that statistical analysis of necessity looks across broad vistas of data. Other forms of analysis look at much smaller sets of data.
And a third difference between analysis of statistical data and that of other data is that the vista of information examined by statistics is much longer than other forms of analysis. It is normal when doing statistical analysis to look across 5 years, 10 years, or even more.
DW 2.0 supports statistical analysis and processing just as it supports other forms of analysis. Depending on the type and frequency of statistical analysis, DW 2.0 can be used either directly or indirectly.
TWO TYPES OF TRANSACTIONS
The nature of the statistical analysis transaction lies at the heart of the DW 2.0 support of statistical analysis. Figure 7.1 illustrates the two basic transaction types common in data warehousing—a standard query or a statistical analysis.
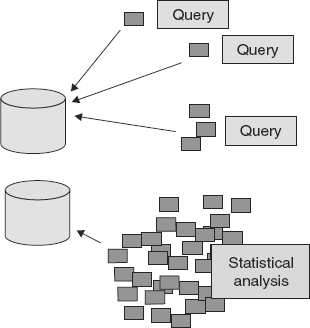
![]() FIGURE 7.1 The resources used by statistical analysis far exceed those used by other styles of transactions.
FIGURE 7.1 The resources used by statistical analysis far exceed those used by other styles of transactions.
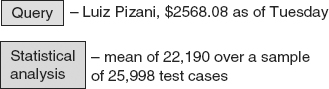
Figure 7.1 shows that standard queries typically use only a few resources, because only a few units of data (i.e., records of data) are required. In contrast, statistical analysis typically requires many, many resources to satisfy the statistical query, and many, many records of data are required.
Another way of looking at this fundamental difference between query and statistical analyses is to compare the output of a typical query transaction and a typical statistical analysis, as shown in Figure 7.2.
Figure 7.2 represents a query that looks for a small amount of data and reports a small amount of data. In this example, the query has retrieved the record for Luiz Pizani and has found his bank balance. To satisfy the query, only one or two records of data were required for analysis.
In a statistical analysis, however, many records are required. In Figure 7.2 is it seen that the results of the query entailed computation of a statistical mean or an average, and to calculate that mean, nearly 26,000 records had to be accessed. Furthermore, the records accessed by the statistical query had to be accessed all at once. The mean value could not be calculated until all the records were available.
USING STATISTICAL ANALYSIS
There are many things that can be done with statistical analysis. One of the simplest statistical analyses that can be done is the creation of a profile of data. A profile of data is a statistical summary of the contents of a body of data. Typical questions answered by a statistical profile of data include: How many records are there? What values are the highest, the lowest? What is the mean, the median, and the mode? Are there values that are out of domain? Are there values that are in domain and appear to be outliers? What is the distribution of data values?
All these questions and more contribute to the creation of a profile of a body of data. The profile of the body of data allows the analyst to look at an overview of the data set—to examine the forest, not just the individual trees.
However, there are many other uses for the statistical analysis of data. One such use is the comparison of corporate data to external data. The development of corporate data is the first step in the comparison of corporate data to external data. Then, the external data is captured and put on a similar footing. Then a comparison is made.
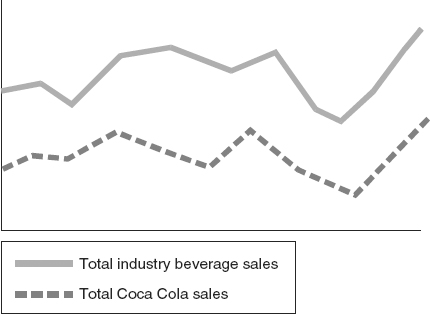
To illustrate a typical comparison of corporate data to external data, Figure 7.3 depicts what might be shown when Coca Cola data is compared to industry-wide beverage sales.
Comparisons of the statistical peaks and valleys may be of particular interest to the beverage business analyst who wants to know, Are Coca Cola sales rising while general industry trends are falling? Are Coca Cola sales falling while industry trends are rising? Is there a general correlative pattern between the two beverage sales curves?
The ability to compare and contrast corporate information to external information can lead to truly valuable business insight.
THE INTEGRITY OF THE COMPARISON
The validity of data is one of the key issues in comparative statistical analysis. Conscientious statisticians routinely want to know if they are comparing the same thing—comparing apples with apples, or apples with oranges. Returning to Figure 7.3, for example, when industry beverage sales are compared to sales of Coca Cola, is the comparison valid? After all, if beverage sales include beer and wine coolers, is it fair and meaningful to compare Coca Cola sales to the sales of these beverages? What if Coca Cola includes such drinks as Minute Maid? Is it fair (or even smart) to compare sales of Minute Maid to sales of Pepsi Cola?
The comparison of external data to internal data introduces issues to be resolved before the statistical comparison can be considered a valid one.
There are, however, many important uses for statistical analysis other than the comparison of external to internal data. Another such usage for statistical analysis is to determine trends and patterns in data.
The business case for data warehouse support of statistical analysis is a strong one.
Even the act of analysis must be considered when pondering statistical analysis. When simple queries are made, the intent is to find data that satisfies an immediate need for information. But, when statistical analysis is done, it typically takes the very different analytical form known as heuristic analysis.

Heuristic analysis is the kind of analysis that is done as a part of discovery. A thing is characterized as heuristic if it involves or serves as an aid to learning, discovery, or problem-solving. In an act of discovery, the analyst does not know what secrets the data holds. The analyst sets out to find or learn what the data contains or means, without knowing what the data contains or what the analyst is looking for ahead of time.
HEURISTIC ANALYSIS
The heuristic analyst has the attitude, “I don’t know what I want, but I will know it when I see it.” In heuristic analysis, the next iteration of analysis is determined by the results obtained from the current analysis. In a true heuristic analysis, it is not possible to plan how many iterations of analysis there will be or where the analysis will lead.
The heuristic analytical attitude is found everywhere in business. It usually is only the clerks who know exactly what they want.
Figure 7.4 depicts the general flow of analysis in a heuristic environment.
Statistical processing is associated with heuristic analysis. One of the unusual aspects of heuristic analysis is the need occasionally to “freeze” data. When data is frozen, no new data is ingested into the system. The reason for occasionally freezing data when doing heuristic statistical processing is the need to see if the results obtained by the analysis were caused by a change in algorithms or a change in data.
For example, an analyst runs a transaction against a body of data and finds that the data returns an average of 67 units. The analyst then changes the algorithm and reruns the analysis, yielding a new average of 98 units. The question then becomes, Is the change in results a function of the change in the algorithm or a change in the data? If the second analysis was run against a different set of data, the different results may be a function of operating against different data, rather than the result of changing the algorithm used in calculation.
FREEZING DATA
When fine distinctions like this are important, it is necessary to be able to freeze the data that has been used in a calculation. Freezing the data means that any change in results can definitely be attributed to algorithmic change and nothing else.
Figure 7.5 depicts data frozen to support heuristic processing and results analysis.
EXPLORATION PROCESSING
One of the essences of statistical processing is that it is often an exercise in exploration. In many forms of information processing, analysis is done on data whose content, form, and structure are well known. However, in other forms of information processing, analysis is done when the content, form, and structure of the data are not well known. It is this style of processing—exploration processing—to which statistical analysis is particularly well suited.
Figure 7.6 depicts exploration processing.
The challenge for the DW 2.0 data warehouse environment is how best to support statistical processing. Certainly DW 2.0 holds data that can be very useful in statistical processing. In fact, the DW 2.0 architecture includes the key ingredient for statistical analysis. However, there remain some issues relating to the usage of the data found in the DW 2.0 environment.

THE FREQUENCY OF ANALYSIS
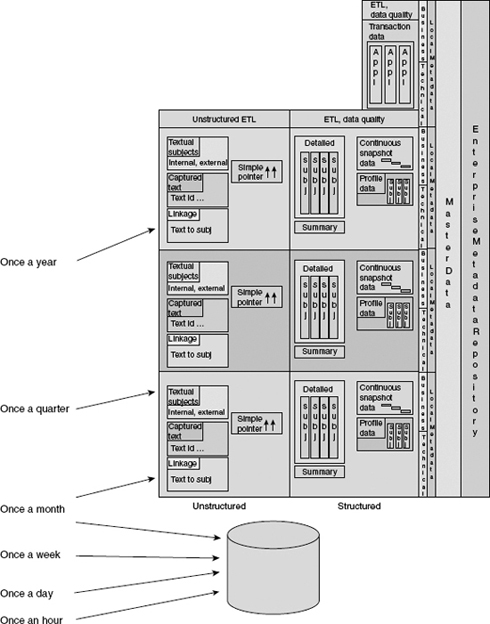
The frequency of statistical analysis is germane to the support of statistical processing by DW 2.0. Figure 7.7 shows that as the frequency of statistical analysis changes, the supporting DW 2.0 infrastructure also changes.
Figure 7.7 suggests that as the frequency of statistical analysis grows, the need for a separate exploration facility increases. If only one statistical analysis is done per year, the basic DW 2.0 infrastructure alone is able to support that level of processing. If statistical analysis is done once a quarter, then the DW 2.0 infrastructure can probably support that level of processing. If statistical analysis is to be done once a month, then maybe the DW 2.0 infrastructure can support that level of processing. But anything more frequent than once a month is unlikely to be able to be supported by the DW 2.0 infrastructure without some addition or enhancement. And certainly in organizations in which statistical analysis is done once an hour, a separate exploration facility needs to be included in the data warehouse environment.
THE EXPLORATION FACILITY
The exploration facility is a place where statistical processing can be done with no performance impact on the central DW 2.0 infrastructure. The exploration facility is located in a place that is physically apart from the DW 2.0 environment. They are physically separate places.
The exploration facility can be frozen for periods of time if necessary. It can include external data if warranted. The exploration facility typically contains subsets of data taken from the DW 2.0 environment. Only rarely is it a direct copy of the DW 2.0 environment, or even parts of the DW 2.0 environment.
The exploration facility takes in data at its lowest level of granularity. In addition, it typically takes in huge amounts of historical data. Both detail and history are needed to satisfy the requirements of the exploration analyst.
The data structure of the exploration facility is mixed. Some data is put in tables on disk storage. Still other data is flattened into a file. The flattened file is often optimal for doing statistical analysis.
Exploration facilities usually contain a large volume of fairly homogeneous data. There is often a low degree of data diversity and a large number of data records found in an exploration facility.
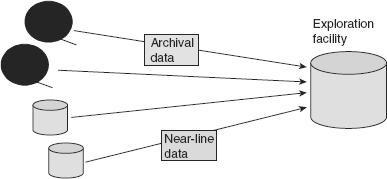
THE SOURCES FOR EXPLORATION PROCESSING
The exploration facility can draw from many sources of data—from the Integrated Sector, the Archival Sector, and the Near Line Sector. Figure 7.8 shows that the exploration facility can draw from the Archival and Near Line Sectors. However, the DW 2.0 Integrated Sector is generally the primary source of data for the exploration facility.
On occasion the exploration facility can draw data from the Interactive Sector. However, if it does draw data from that sector, then there are several cautions, the first being the disruption of service in the Interactive Sector. If exploration data is to be drawn from the Interactive Sector, it must be taken with great attention to the performance levels in that sector. The second caution is that if data is taken from the Interactive Sector into the exploration facility, it must be understood that the data is not auditable. For example, a unit of data taken from the Interactive Sector at 10:31 AM may not exist at 10:32 AM. If these cautions are considered, then the Interactive Sector can be used to provide data to the exploration facility.
REFRESHING EXPLORATION DATA
Figure 7.9 depicts the refreshment of exploration facility data with data from the DW 2.0 environment.
The refreshment cycle of data into the exploration facility is deliberate. In other parts of DW 2.0 data flows as rapidly as it is available. Data flows into the exploration facility only when the exploration analyst wants the data to flow. This may be daily, weekly, or monthly, depending on the needs of the exploration analyst.
PROJECT-BASED DATA
Exploration facilities are project based as a rule. This usually means that a particular issue needs to be studied by management. Data relevant to the issue is gathered, an analysis is made, and then the results are sent to management. Once the results are sent to management and the study is finished, the data is either discarded or mothballed. The project-based exploration facility is not a permanent structure.
However, some organizations elect to have a permanent exploration facility. When this is the case, the exploration facility is available any time an analysis needs to be done. The detailed data is often changed inside the permanent exploration facility.
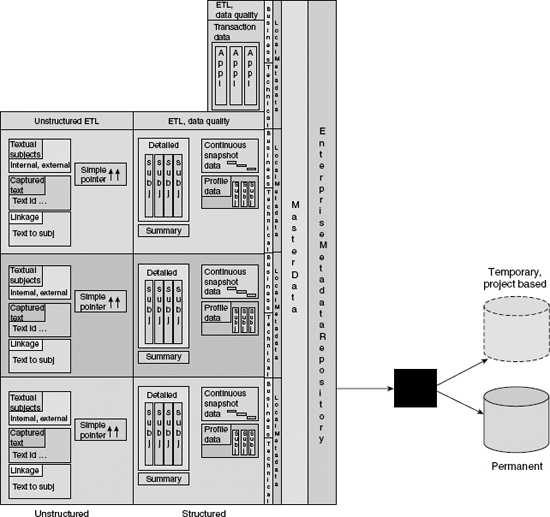
Figure 7.10 illustrates that the data in an exploration facility can be permanent or temporary.
DATA MARTS AND THE EXPLORATION FACILITY
Analysts often think that the exploration facility is the same as or very similar to a data mart. In fact, a data mart and an exploration facility are very different. Some of the major differences between a data mart and an exploration facility are:
These are only the primary differences between an exploration facility and a data mart.
Figure 7.11 suggests that an exploration facility and a data mart are very different components of the architecture.
A BACKFLOW OF DATA
Another interesting issue is that of whether it is wise to let data flow from the exploration facility back into the DW 2.0 environment. Indeed it is permissible for data to flow from the exploration facility into the DW 2.0 environment, but there are certain conditions that must be met beforehand.
Some of the conditions are:
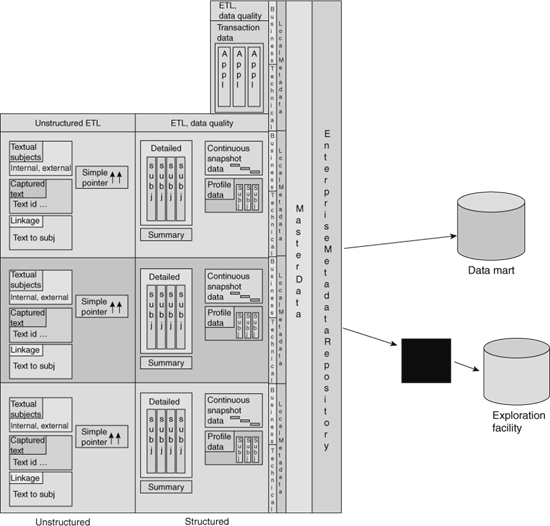
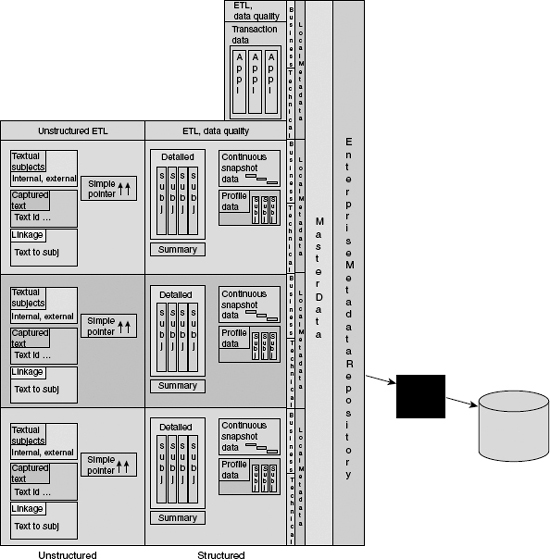
Figure 7.12 depicts the potential feedback of data from the exploration facility to the DW 2.0 data warehouse, under the right circumstances.

![]() FIGURE 7.12 It is possible to have data flow from the exploration facility into DW 2.0.
FIGURE 7.12 It is possible to have data flow from the exploration facility into DW 2.0.
USING EXPLORATION DATA INTERNALLY
A word of caution about exploration facilities. In most cases, exploration facilities are used to produce analysis for internal consumption only. This is because the data that goes into the exploration facility normally is not subjected to the same rigorous ETL processing as the data flowing into and through the DW 2.0 environment. Therefore, when it comes to providing reports and data to auditors and examiners, it just does not make sense to use data from the exploration facility. Instead, only “official” data should be used as the basis for official reports. It is well worth remembering that information on reports often ends up also appearing in financial statements or even in the press. It is very unwise to allow reports based on exploration facility data to be used in a public manner, because these reports may not be calculated properly and may contain misleading data.
FROM THE PERSPECTIVE OF THE BUSINESS ANALYST
Many businesses do not take advantage of the statistical processing of the data that they own. As such they are not taking full advantage of their information resources. But there are some businesses that have long recognized the value of information and the statistical processing that can be done with the data. Typical of these businesses are insurance actuaries and research engineers.
The truth of the matter is that, in insurance and in engineering product development, statistical processing plays a very important role. Furthermore that role is recognized by the businesses that employ these types of people.
For a company that traditionally has not used statistical analysis widely to start to do so, there needs to be some obvious successes. These successes do not happen magically. Usually these statistical analyses happen as the result of “skunk-work” projects. Because there has been no past success, the business is loath to fund a statistical analysis. So one or two interested and experimental workers get together and do a “see what happens” project. These projects are almost always small because they are not formally funded.
Assuming that the analysts find something interesting and useful, the skunk-work project then makes its way into the corporate mainstream. Once established, the statistical analysis function grows thereafter.
The type of individual who conducts these types of projects must have some sort of mathematical background. The background may be formal or informal, but to do statistical analysis properly requires a way of thinking that entails an understanding of mathematics.
SUMMARY
There are two types of queries—analytical queries and exploration queries. Exploration queries access large amounts of data and can take a long time. Exploration queries require granular and historical data. Exploration processing typically makes use of statistical techniques.
Occasionally exploration data needs to be frozen. The freezing of exploration data occurs when heuristic processing is being done. In heuristic processing, the next step of analysis depends entirely on the results obtained from the most current level of analysis.
An exploration facility can be built exclusively for the purpose of supporting exploration processing. Whether or not there is a need for an exploration facility depends entirely on the frequency of statistical analysis. If only infrequent statistical analysis is occurring, then there is no need for a separate exploration facility. If there is frequent statistical analysis that occurs, then there may be a need for a separate exploration facility.
Exploration facilities are built on a project-by-project basis. There is no need to keep the exploration facility after the project that required it is completed.