
Chapter 9 Monitoring the DW 2.0 environment
The DW 2.0 environment is complex and dynamic. There are many complex interactions between the various components. Data flows from one component to another, transactions are executed, and transformations of data are done.
In many ways the DW 2.0 environment is like a black box. Data is put in one place and taken out of another, and mysterious things happen in between. Unfortunately, if the DW 2.0 environment is treated like an opaque black box, it is a good bet that over time, things will happen inside the black box that are untoward—data starts to collect where it shouldn’t, transaction response time turns bad, data is not placed where it ought to be placed, or worse.
The DW 2.0 environment should not be like a black box. There needs to be periodic “checks underneath the hood” to ensure that the DW 2.0 environment is operating as it should be.
MONITORING THE DW 2.0 ENVIRONMENT
To that end it is strongly recommended that regular monitoring of the DW 2.0 environment be conducted. At the very least, a stethoscope should be inserted into the black box to find out what is going on. When adjustments need to be made to the DW 2.0 environment or any of its components, those adjustments can be made proactively rather than reactively.
THE TRANSACTION MONITOR
There are at least three types of monitoring that need to occur in the DW 2.0 environment. The first is monitoring of the transactions that are run in the Interactive Sector of DW 2.0. A transaction monitor ensures that there is good and consistent response time.
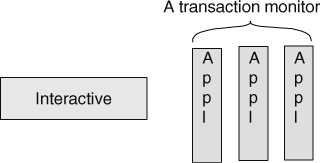
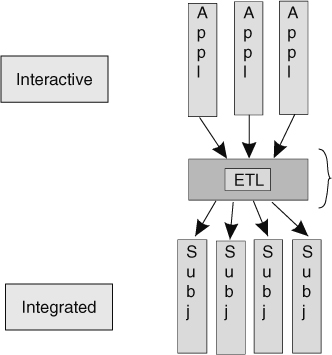
Figure 9.1 depicts a transaction monitor.
MONITORING DATA QUALITY
The second type of monitoring that needs to occur in the DW 2.0 environment is ETL monitoring for data quality. There needs to be a monitor that is dedicated to verifying the quality of data passing through the transformation components of DW 2.0. If low-quality data is being passed into DW 2.0, then the data analyst needs to be alerted, at the very least.
Figure 9.2 depicts a data quality monitor.
A DATA WAREHOUSE MONITOR
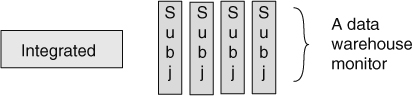
The third type of monitor that needs to be a part of the DW 2.0 environment is a data warehouse monitor. This monitor looks at the data in the data warehouse. While the data warehouse monitor serves many different purposes, its main purpose is to measure the usage frequency of data. From the usage frequency of data, it can be determined if any data has gone dormant. The management of dormant data is one of the most important aspects of the management of the DW 2.0 environment. Figure 9.3 illustrates the data warehouse monitor.
Each of these types of monitors for the DW 2.0 environment will be addressed in greater depth.
THE TRANSACTION MONITOR—RESPONSE TIME
The primary purpose of the transaction monitor is to ensure that there is good, consistent response time. Unfortunately, there are many aspects to system processing that have an effect on system performance.
When system performance is mentioned, it is usually a reference to response time. Response time in the 2- to 3-second range is normally considered acceptable. There may be a few periods during the course of the day when response time starts to drift higher, but as long as those periods are short and infrequent, and as long as the response times do not drift too high, then the system will be deemed to be running in a satisfactory manner.
Usually acceptable response time parameters are defined in a Service Level Agreement.
Some of the characteristics and features of a transaction monitor include:
There are other measurements of performance, but these measurements are the most important.
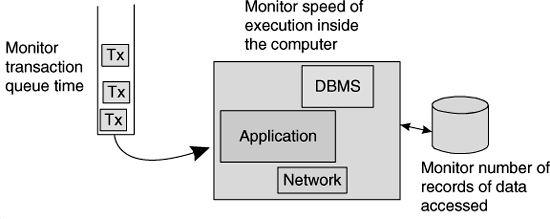
Figure 9.4 illustrates some of the components to which transaction monitors can be applied for maximum benefit.
There are many outcomes of transaction monitoring. Some of the more salient outcomes of transaction monitoring are discussed next.
PEAK-PERIOD PROCESSING
One important metric that comes from the monitoring of transactions is the measurement of how close the system comes to having all of its resources consumed during peak-period processing.
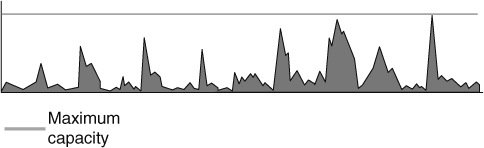
![]() FIGURE 9.5 The burning question—When will capacity used reach maximum capacity and what will happen when that point is reached?
FIGURE 9.5 The burning question—When will capacity used reach maximum capacity and what will happen when that point is reached?
There are periods of low activity and periods of high activity in every transaction processing environment. The periods of high activity are called the “peak periods.”
The system operates smoothly as long as there is capacity for all processing. But during peak periods, if the system’s demand for resources starts to exceed the resources that are available, then the system starts to slow down, in most cases dramatically. Therefore, it behooves every organization to monitor how closely peak-period processing comes to exhausting the available system resources. If the resources used in peak periods are steady, then there is no need to add capacity. If or when there is a steady increase in the resources needed for peak-period processing, that is a warning sign that more system resources are needed, or a different allocation of resources is called for.
Figure 9.5 shows the tracking of peak-period resources.
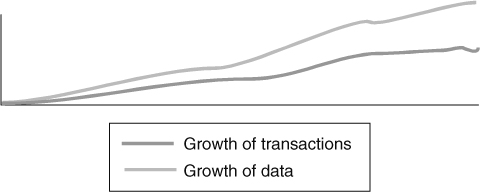
Another important parameter typically tracked by the transaction monitor is the rate of growth of the system. Typical indicators of system growth that can be tracked over time are the number of transactions and the volume of data in the system.
The number of transactions is a good indicator of the rate at which a system is growing and its capacity is being consumed. By extrapolating and projecting the number of transactions a system processes, the systems analyst can determine when a hardware upgrade will be needed. The objective is to predict when an upgrade will be needed and to enable the organization to respond in a proactive manner before performance problems begin. Operating in a reactive manner invariably means that the organization will suffer periodic “melt-downs.” Meltdowns cause an untold amount of grief due to their negative impact on the operations of the company.
Figure 9.6 illustrates the typical result of tracking transaction volume and data quantity growth over time.
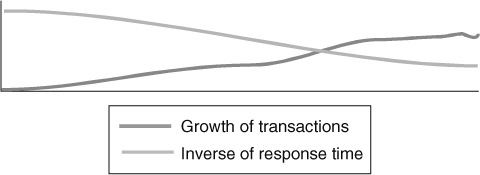
There are many other aspects of the operations of transaction processing that can be monitored. For example, the juxtaposition of transaction volume growth and associated response time degradation over time can reveal and forecast when it will become critical for the organization to increase its transaction processing capacity. Figure 9.7 depicts this kind of comparative performance measurement.
THE ETL DATA QUALITY MONITOR
The ETL data quality monitor examines data as it passes from one DW 2.0 sector to another or as the data initially enters the system. The purpose of the ETL data quality monitor is to evaluate the quality of data as it is being transformed.
The ETL data quality monitor looks at many aspects of data. Among other things, it examines
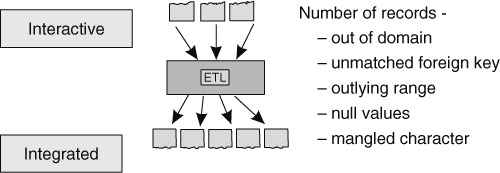
These are just a few examples of many data quality conditions that need to be detected and reported by an ETL data quality monitor.
One of the most interesting data quality questions is what to do once an error condition has been detected. One option is to reject the data, but this is generally a bad solution because
Another solution is to create default data. Although this works well, the data that has been determined to be incorrect is permanently lost to the system. Yet another solution is to let the bad data pass into the system and flag it as being incorrect. Flagging incorrect data warns the end user that there is a problem with the data.
Figure 9.8 depicts the place and role of an ETL data quality monitor.
THE DATA WAREHOUSE MONITOR
The data warehouse monitor is a software tool that monitors what data in the data warehouse is being used and what is not being used. If a unit of data goes long enough without being used, it is considered “dormant” data. Good data warehouse monitors are designed to detect and report dormant data.
The normal way that data warehouse data monitoring is done is through the interception of SQL code submitted to the data warehouse system. By gathering the SQL passed into the system, the analyst can determine what data is being accessed inside the data warehouse and what data is not being accessed. Usually the SQL is intercepted as a result of “sniffing” the lines of communications. One way to arrange a sniffer is by placing it outside the data warehouse computer. Figure 9.9 depicts a sniffer located outside the computer that manages the data warehouse.
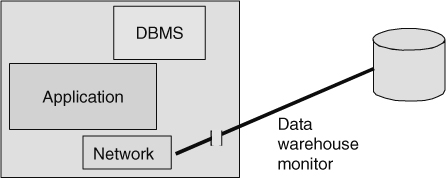
The other place the sniffer can be located is inside the computer where the data warehouse is being managed. Figure 9.10 depicts the placement of a sniffer inside the data warehouse computer.
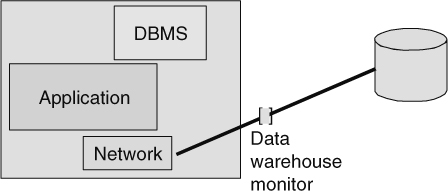
As a rule, it is much more efficient to sniff SQL code from outside the computer that hosts the data warehouse. The overhead of sniffing can become a large factor when the sniffer is allowed to be part of or interact directly with the data warehouse DBMS.
DORMANT DATA
There are lots of reasons for having a dormant data monitor in the data warehouse. The primary reason is that when data goes dormant, it needs to be moved to alternate storage. Alternate storage is much less expensive than high-performance disk storage. In addition, dormant data “clogs the arteries” of high-performance disk storage.
There are two good reasons that moving dormant data to an alternate form of storage makes sense:
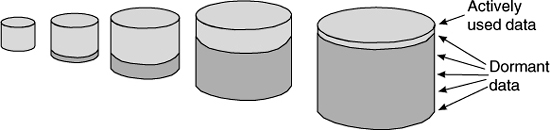
Dormant data creeps into a system silently. Figure 9.11 shows how dormant data grows inside a data warehouse.
Newly built and implemented data warehouses typically do not contain a lot of data and therefore do not contain much dormant data. As the volume of data grows in a data warehouse, the percentage of data that is dormant grows as well. When there is a significant amount of data in a data warehouse, there is almost always a significant amount of data that has gone dormant.
One alternative is simply to leave the dormant data in the data warehouse, but doing so is expensive and slows down the system considerably. The other alternative is to move the dormant data to either near-line storage or archival storage. Figure 9.12 depicts the periodic transfer of dormant data to near-line or archival storage.

The data warehouse monitor is used to tell when data has gone dormant.
FROM THE PERSPECTIVE OF THE BUSINESS USER
The monitoring of data is a technical exercise. As such the business user is not directly involved in monitoring. However, the business user definitely sees the results of monitoring.
To use an analogy, the business user sees that the oil light has gone on. He/she pulls over into a garage and half an hour later is on his/her way. This time when driving down the road the oil light is no longer flashing.
The same is true of monitoring the DW 2.0 environment. In the DW 2.0 environment the business user notices a slowdown in performance. Or the end user notices that upon making a query too much data is being returned. The business person goes and discusses the symptoms with the data architect. The data architect then employs a monitor and effects a cure.
It is noteworthy that using a monitor and effecting a cure is not a half-hour exercise. In the best of circumstances, there is a considerable period of time between the noticing of symptoms of a problem and the curing of that problem.
SUMMARY
Three types of monitors are needed in the DW 2.0 environment:
The transaction monitor addresses the Interactive Sector and is focused on transaction response time and capacity planning. The transaction monitor is especially concerned with data warehouse activity that occurs during peak processing periods. The transaction monitor examines workloads, queues, and resource utilization.
The data quality monitor looks at data domains and data ranges as data is moved from one part of the DW 2.0 data warehouse environment to another.
The data warehouse monitor is focused on the Integrated Sector of the DW 2.0 data warehouse and addresses dormant data. It looks at data and determines what data is being used and what is not being used.
The best data warehouse monitors are those that operate outside of the data warehouse DBMS. The use of SQL sniffers is the least obtrusive and the least time-consuming technology for monitoring the activity that goes on inside the data warehouse.