
Moving from a packet recorder to a packet sensor requires us to examine the differences between the activity that was observed during the recording period versus the active monitoring for aberrant behavior.
Turning the Packet Recorder into a Sensor
- 1.
Operate the recorder and sensor using the same interface.
- 2.Generate HTML reports that cover the following:
- a.
Overall master report
- b.
Observed MAC addresses/manufacturers
- c.
Observed country connections
- d.
Observed port usage
- e.
Observed possible IoT connections
- f.
Observed possible industrial control system (ICS) connections
- g.
Alerts generated during sensor mode
- a.
- 3.
Provide basic status information directly on the Raspberry Pi.
- 4.
Finally, produce the recorder/sensor as a single executable file.
Raspberry Pi Sensor/Recorder Design

Snapshot of the Raspberry Pi sensor/recorder GUI

Raspberry Pi configured with a PaPirus real-time display
Design Overview

Raspberry Pi sensor/recorder
The Pi sensor/recorder is set up to execute within an event-driven application loop supported by Python and TKinter.
The main code section is established as follows:
A quick overview of the initialization is defined here:

M2: Imports the TKinter Python library and instantiates a new TK object. This will be used as the main window object and event handler in the application.
M3: The main takeaway here is the highlighted call that initializes the application by passing in the root object instantiated from TK.
Next, we’ll look at this application handler and the list of methods that have been created to control the distinct aspects of the application.
Examining the main sections of the application class, we find three main sections:
A1: Establishes object attributes that will be associated with each instantiation of the application class. For example, variables that hold state information regarding the baseline and report selections are initialized here, along with dictionaries that will be used by the sensor during monitoring activities. For example, the baselineCC dictionary will hold countries that were observed during the recording phase. Then any new country observations that are observed during the sensor stage can be reported as anomalous.
A2: Creates the parent window frame that will be used by the application. Most importantly, the initUI() method is called; this establishes all the GUI widgets on the window, such as labels, buttons, text boxes, drop-down lists, progress bars, status displays, and menu options.
In the next section we will take a look at the list of methods that have been created and examine a couple of those in detail.
A3: Finally, if a PaPirus display was attached and detected, an object is instantiated to handle the interface with the display. We will see how this is done later in this chapter.

Application object methods
GUI method definitions
Method | Description |
|---|---|
initUI | Creates and initializes all the display widgets found on the application frame. Once all the widgets are created, the lookup tables used by the application are loaded and the status bar is updated. |
btnSelectFolder | Handles the button click to the right of the Report Folder selection and provides a folder browser for the user. The user must select an existing folder, or create a new folder to store the results of the record baseline or activate sensor selections. |
btnSelectBaseline | Handles the selection of an existing baseline that will be used in sensor mode to detect anomalies from the recorded baseline, for example, new connections, devices, port usage and countries contacted. |
btnPerformCapture | Begins the record baseline process. Based on the selected duration, this method will run to completion unless interrupted by the stop button. Note: this button will not be active until a report folder has been selected. |
btnActivateSensor | Utilizes the selected baseline and begins the process of monitoring network activity and comparing those results to the baseline. Like the btnPerformCapture method, it will run for the selected duration unless interrupted by the stop button. Note: this button will not be active until a report folder has been selected along with a valid baseline. |
btnStopCapture | Activated upon pressing the stop button during a baseline recording or sensor execution. It will interrupt the recording or sensor, but will store the intermediate results. Note: this button will only be activated during baseline recording or sensor monitoring activity. |
btnViewSelectedReport | Displays the report currently selected by the user in the Select Report drop-down menu. Possible reports include the following: Master report Manufacturer report (OUI device name) Country report Port usage report IoT report ICS report |
btnViewAlerts | Activated by the user pressing the view alerts button. This button is only active after a sensor execution has been completed. The method will display the current alert report generated by the last sensor operation. |
The next set of methods perform operations upon completing the recording of a baseline. The method uses the unique dictionary created during the baseline recording process. | |
SaveOB | Saves the baseline as a serialized Python pickle object. The baseline is saved in the baseline directory that is created under the selected report folder. |
GenCSV | Generates a comma-separated value (CSV) file in the reports folder. The CSV contains all the unique observations during the record baseline process. |
GenHTML | Generates the master HTML report |
GenCountry | Generates the country HTML report |
GenICS | Generates the possible ICS observed activity HTML report |
GenIoT | Generates the possible IoT observed activity HTML report |
GenMFG | Generates the observed manufacturers HTML report |
GenPortUsage | Generates the PortUsage HTML report |
translateAlertCodes | Converts alert codes generated by the Pi sensor into meaningful messages |
GenAlerts | Generates the alerts HTML report generated by the sensor operation |
btnStopCapture | Allows the user to stop the recording or sensor, but still generate the reports |
MenuAbout | Displays the application about box |
MenuToolsExit | Handles the exiting of the MenuTools |
Method Details
Next, we will take a deeper look at some of the key methods defined here.
Note
A complete listing of the completed Python solutions is available in the Appedix A, provides instructions on accessing the source code.
Initializing the GUI (initUI)
Defining a GUI in Python can be accomplished with many different third-party libraries. However, here we have chosen to utilize the built-in Python TKinter Library, TK for short. Tk/Tcl is an integral component of standard Python. It provides a robust and platform independent windowing toolkit that is readily available to Python programmers using the TKinter module, and its extensions. The extensions include the Tix and ttk modules. Additional details regarding TKinter can be found in the Python Standard Library at https://docs.python.org/2/library/tk.html .
The TKinter module is a thin object-oriented layer on top of Tcl/Tk, which provides a set of wrappers that implement the Tk widgets as Python classes. In addition, the internal module _TKinter provides a threadsafe mechanism which allows Python and Tcl to interact.
Using TKinter requires us to make specific declarations and configurations for each of the onscreen widgets along with any event handlers (for example button clicks) for each widget.
Configuring TK can be done using one of two geometry-based methods, commonly referred to as Grid and Pack. We have chosen to use the Grid method. Using the Grid method organizes widgets in a table-like structure, where each widget (buttons, labels, combo boxes, progress bars, etc.) are then placed at a specific row and column location.
In addition to visual widgets, other objects such as menu-based objects like those declared in the U1 highlighted section are placed on the frames menu bar.
In order to better explain how this is done, we will walk through each code section U1 through U7.
U1-Menu Bar
- 1.
About
- 2.
A horizontal separator line
- 3.
Exit
In addition, the keyboard shortcut bindings for Ctrl-X and Ctrl-A are defined to allow keystroke menu selections.
Finally, specific command executions are associated with the About and Exit menu options. For example:
If you examine Table 4-1 you will see the declarations for these two methods as part of the application object. We will examine those methods later in this chapter.

Menu bar illustration
U2-Folder and File Selection
- 1.
A label widget that indicates the name of the field
- 2.
A sunken label that will hold the resulting user selection
- 3.
A button to launch the requisite folder and file selection dialogs
Taking a close look at the first folder selection, we first define the label widget with the text Report Folder and place that label at row 1, column 0 on the parent frame and we anchor the frame to the westmost position in the column.
Next, we specify another label widget at row 1, column 1 and specify the label to be sunken to represent data that is specified.
Finally, we add a button widget at row 1, column 2 that will launch a dialog box for the user to select the folder where reports, baseline, and alerts will be stored. Notice this widget has a command associated with self.btnSelectFolder. This method is also defined in Table 4-1, and again, we will examine the details of this method. The method source code is shown here.
U3-Duration Selection

Duration selection
U4-Action Buttons
The action buttons, activate sensor, record baseline, stop and view Alerts are defined here. They are all defined to be placed in row 8, column 1. However, each contains a different padx value (padding from the westmost position of the row) allowing the buttons to be separated. Without the padding, they would be displayed on top of each other.
In addition, each button has a defined command associated with it that will be executed when pressed.
Also, notice that each of the buttons is set to DISABLED. The rationale is that the buttons cannot activate the specific operations until the report folder and/or the baseline have been correctly selected.
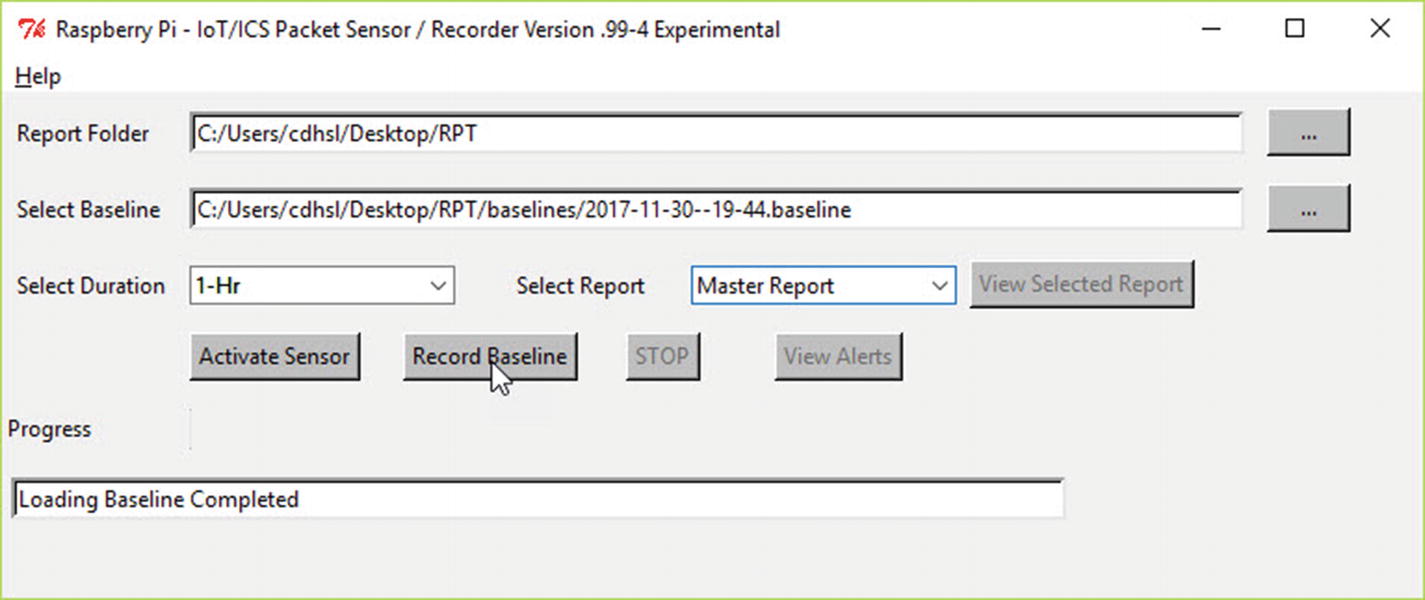
Report and baseline selections enable activate sensor and record baseline buttons
The source code for each button selection are covered in the GUI Source Code Selection.
U5-Progress Bar
When the activate sensor or record baseline process is underway, a progress bar will be displayed to depict the time remaining in the scan. For this widget we are using a label and a ttk progress bar widget.
U6-Report Selection

Select report section
U7-Status Bar

Application status bar
Exploring Other Application Methods
Now that we have initialized the application interface, let’s look at the underlying functions that perform operations based on the user interactions described in Figure 4-3. We will start with selection of the report folder and baseline. The application will write newly generated reports to the selected report folder. In addition, the subfolders Baselines and Alerts will be created to hold any recorded baselines and alerts generated during active sensor operation.
Selecting the Report Folder (btnSelectFolder)
Start with the btnSelectFolder method (depicted in code segment F1), which is activated upon the button click action defined in “U2 Folder and File Selection.” This section is straightforward; we are using the built-in tkFileDialog.askdirectory function, which displays a directory selection dialog as shown in Figure 4-10. As you can see, the baselines and alerts folders have also been created.

Selection of the report folder
Source Code Methods for GUI Elements
When we examine the btnSelectBaseLine method depicted in F2, we see that this function is a bit more complicated. First, this method uses the built-in tkFileDialog.askopenfilename to select the baseline. Since the user can select any file with the .baseline extension, we need to verify that this is a valid baseline generated by the record baseline method. Once this is verified, we create a set of local dictionaries to hold extracted values from the baseline, including previously observed countries and MAC addresses; these will be used during the monitoring process to generate alerts from unknown countries and new observed MAC addresses.

Properly selected and verified report folder and baseline
Record Baseline Method (btnPerformCapture)
Duration (determine how long to run the recording)
Report folder (where to record the results)
The method first performs some setup tasks (section R1) to disable the other action buttons and to enable the Stop button, allowing the user to interrupt the recording. In addition, a packet processor object is instantiated, which in turn loads the necessary lookups for manufacturer OUI identification, port and protocol translations, and country lookups. If the PaPirus display is detected and available, it will be initialized to display details of the ongoing recording.
Finally, the network adapter is set to promiscuous mode to collect all traffic presented at Eth0.
Moving to section R2, the main loop is established and processes each packet observed over the network. The loop continues until either the duration time expires or the user presses the stop button. Every 2 seconds, the packet count is updated in the status bar and the progress bar is updated marking the progress toward the time expiration.
Once R2 completes (either by the user interrupting the process or through time expiration), a new baseline is created and stored in the baseline directory, and all the HTML and CSV reports are generated and stored in the selected report folder. The code in the R3 section calls each report generation function. Let’s take a deeper look at one of the report generation functions to examine how the resulting HTML reports are generated in the next section.
Master Report Generation (GenHTML)
The report generators all work basically the same, but they filter and sort data based on the specific reports being created. The method is a unique method of autogenerating an HTML file. One could use XML (eXtensible Markup Language) and style sheets as an alternative.
Examining M1, we start by updating the status bar of our progress. The current date and time are obtained in order to generate a unique file name for the desired report. Each report name is prepended with the date-time in order to provide easy sorting of the report results. For this example, the report name would be in the following format:
Next, the html file is built from a template stored in the rpt.py file. Each report has a separate template that is used. Basically, the template contains an HTML_START section, HTML_HEADER section, (multiple) HTML_BODY sections, and HTML_END section.
Examining the code in section M2, the Python dictionary object d contains all the unique observations collected during this recording. A loop is created to iterate over each unique observation, and the values extracted from the key/value pairs of the dictionary are stored in local variable prefaced with fld (for example, fldAlert, fldSrcIP, etc.). Once they are collected we use the format method available for strings, as shown here, to replace the placeholders defined in the template HTML.
The template HTML placeholders highlighted here are then replaced by the corresponding local variables to generate the final HTML code.
Once all the HTML code has been generated, the code in section M3 writes out the complete htmlContents to the report filename created in section M1.
Saving the Baseline (SaveOb)
In addition to generating the various reports associated with the record baseline process, the actual baseline is also created. This is a straightforward process in Python, as we are serializing the Python dictionary object d using the pickle standard library module.
Note
What is pickling? Pickling “serializes” Python objects prior to writing them to a file. Pickling converts Python objects (list, dict, etc.) into a character stream. The idea is that this character stream contains all the information necessary to reconstruct the object in another Python script. This is done by using the pickle.load(filename) method. This method was utilized in section F-2 when the baseline file was selected by the user.
In Section S1, the SaveOb method uses the same naming convention used when creating report files, but adds the file extension “.baseline” to the file. Then with only two lines of code, the baseline file is created.
Activate Sensor (btnActivateSensor, PacketMonitor)
The final method to examine in this chapter is the btnActivateSensor method. The front end of this method mimics that of the packer recorder. The difference is in the processing of each received packet. The PacketMonitor method examines the received packet and determines if “the same packet construction” exists in the current baseline. If not, then an alert report item is generated to indicate a “New Observation”. In addition, the key elements of the packet, such as IP country location, MAC address, packet size, and time of the observation, are compared to known or expected values. If anomalies are discovered, additional report items are recorded. The following code snippet includes the btnActivateSensor, PacketMonitor, and supporting methods.
def PacketMonitor (self, packet, alertDict, baseCC, baseMAC):
Packet Monitor Supporting Methods
Summary
Design overview
Examination of the GUI approach
Integration of the PaPirus ePaper display
Details of the baseline recording method
Details of the sensor methods
Details of the report generation methods
Finally, the use of the Python pickle method to store and load the resulting recorded baselines
In Chapter 5, the focus will be on applying the Pi recorder/sensor to create baselines that are used to train and then activate the sensor. Finally, both the recorder-generated reports and the reports generated by the sensor will be examined to expose IoT-based operations within our test network.