How can design principles and Flash techniques be integrated and synthesized in an instructional application?
Why is one technique chosen to fit the needs of the learning objectives?
This chapter illustrates how many of the techniques presented in the Flash guides can be applied to solve instructional challenges. The content follows from the design that was begun in the Chapter 2, which ended with the development of objectives and test items.
Once learning objectives have been established and those objectives have been assigned to a learning domain, then appropriate strategies can be selected.
Table 12.1 summarizes the strategies that have been introduced in this text. The strategies in Table 12.1 are divided into three types (attention management, cognitive load management, and structural management). Recall that these types align with sensory, working, and long-term memory systems. By selecting strategies that target each primary memory system, learning should be enhanced.
Table 12.1. Summary of Instructional Strategies.
Attention Management | Cognitive Load Management | Structural Management | |
|---|---|---|---|
Facts | Clarity/Figure/ground separation/Layout | Learning domain knowledge/Highlight goals/Graphic organizer (table)/Unit size | Elaboration/Mnemonics/Repetition |
Concepts | Clarity/Figure/ground separation/Layout | Learning domain knowledge/Highlight goals/Co-presentation (definitions and attributes) | Hierarchies/Examples and non-examples/Prototypes |
Principles | Clarity/Figure/ground separation/Layout | Learning domain knowledge/Highlight goals/Co-presentation (rule, explanation, and example) | Simulation/Analogy/Examples and non-examples |
Procedures | Clarity/Figure/ground separation/Layout/Demonstration | Learning domain knowledge/Highlight goals/Flow chart/Co-presentation (flow chart and example)/Unit size | Optimal path/Analogy/Examples |
Practice Sequences | Modality | Scope/Learner actions | Support |
The Tasks section is meant to provide you with some ideas. You may want to refer back to the specific Flash guides to understand how to implement a Flash technique.
In the section below each of the objectives is addressed in detail, to demonstrate instructional strategies from each learning domain. These examples are primarily for the purpose of demonstration. Rarely, if ever, will any one particular objective require the application of all of these strategies; doing so could easily be considered overkill.
You should select the objectives that you believe to be the most critical and the ones on which learners have the most difficulty. It is important to implement strategies in number and in scope that allow the learners to master the objective in the most efficient manner possible. You should strive to provide the learners with no less than they need and no more then is helpful.
User tests are particularly important (discussed in Chapter 14) because they can give you a good feel as to whether you have provided a sufficient number of presentations and practice sequences to help the majority of your learners learn.
Clarity. Enhancing clarity in the instructional materials is critical. To achieve this objective, a text description should be provided to the learners. For example, the text should address why it is important for the learners to master the parts of a supply-and-demand graph. The text should also describe why this type of graph is useful, as well as provide some background information for context. This text description should use clear and easily understandable language appropriate for the target audience. The Flash guides Static Text, Dynamic Text, and Working with Variables all provide useful methods for implementing any sort of text communication with the learners. Static text is useful when content requires unique formatting (e.g., font, font size, bold, etc.) but does not have to be updated or edited often. Dynamic text allows you to assign text to a variable and be automatically assigned to an area on the screen; the text will change any time the variable is reassigned. Dynamic text is useful any time a Flash screen is designed to be used as a template. For example, if one has text that requires four pages to display it all, the content should be split up into four roughly equivalent sections. Each section can be assigned to a variable and then dynamically sent to the screen as the user moves from screen to screen (to build this type of navigation, refer to the Flash guide Button Symbol). The big advantage with this method is that the content can be changed instantly without worrying about the layout of the page and the attributes of the text (e.g., font, font size, bold, etc.).
For example, Figure 12.1 demonstrates how these methods could be used to present text to the learners.
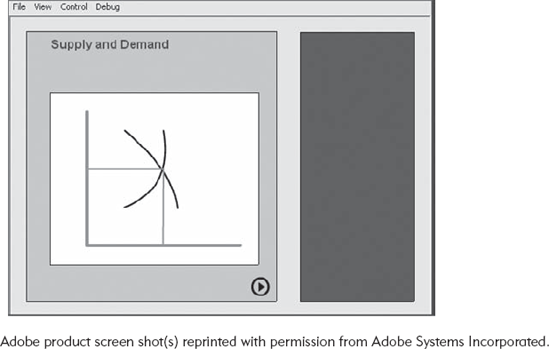
Additionally, support graphics should be made available that strengthen the text. Obviously, to meet this objective the learners will have to be presented with an image illustrating a supply-and-demand graph. To draw this graph, refer to the Flash guide Drawing Tools. Flash's drawing tools create vector graphics that can be resized and reused without losing resolution. In other words, if a lesson requires the same representation in multiple places, images drawn in Flash do not have to be re-created. The Flash guide on Graphic Symbols can be of great assistance in repurposing graphics.
Figure 12.2 demonstrates the use of graphics.
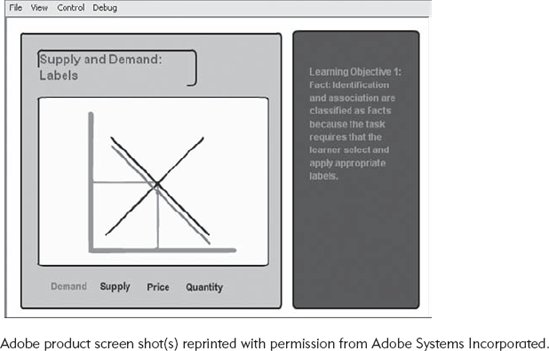
Figure/Ground Separation. This strategy is central to the objective. In order for the learners to be able to identify the different structures in the graph they must be able to determine which structure a label is referring to. A supply-and-demand graph has numerous components so, to avoid confusion, each element must be isolated from the others. The "figure" must be separated from the "ground." One way to create this connection is to use arrows; however, that technique has some drawbacks. The more complicated the figure, the more cluttered the image. However, with the use of Flash, you have the ability to demonstrate one connection at a time. The easiest way of doing this is to use a Flash button with the rollover effect. For example, each element in Figure 12.3 has been connected to its own button. Each time the user's cursor is above a particular button, the image changes. Recall that with a button rollover you can make not only the button image change but also you can have an image(s) appear anywhere on the screen. These images can cover images on other layers. In this example, when a learner places the cursor on a label, the label turns color and an image of a part of the graph is overlaid with the same graphic but a different color.
Layout. Headings help inform the learners as to what is important. Headings focus the learners' attention on the task at hand. For example, for this objective, the learners should be informed of what the learning goal is. At all times, the learners should have access to the objective itself. This can be accomplished by inserting headings that describe the topic as well as headings that describe the objective. It is also a good idea for these headings to be placed on the screen in a consistent manner, so that for every topic the learners can instantly identify the purpose they are engaged in. This can be accomplished easily with Dynamic Text, which allows the layout and style to be maintained while changing the content. Figure 12.1 illustrates this method.
Graphic Organizer. One of the challenges with mastering this objective is consistently associating the labels with the shapes of the curves. By providing a graphic organizer, we can help the learner associate the slopes with the logic behind the shape. If we can provide them with a table that connects this information, we allow the learner to make this connection all at once, which reduces the cognitive load imposed by switching from screen to screen.
Elaboration. Often by providing the learner with some additional information, that goes beyond the immediate objective, can be helpful in connecting the new content with past experience and prior knowledge. In this case, the learner might be informed that, "The price is viewed as the variable that determines quantity supplied and quantity demanded, and we usually put the dependent variable (which here is quantity) on the vertical axis." (http://gregmankiw.blogspot.com/2006/09/who-invented-supply-and-demand.html). This may help them recall the illogic of the axis for this type of graph. This can be implemented with the Dynamic Text tool.
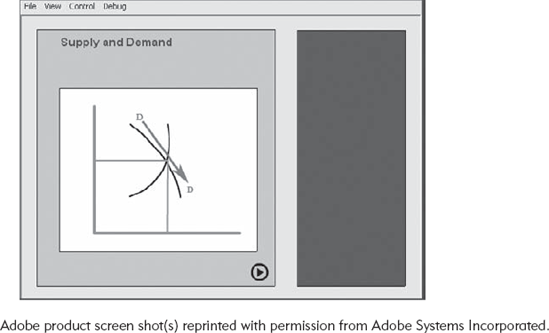
Mnemonics. It also may be helpful to provide the learners with a mnemonic. For example, the demand curve slopes downward. The D in demand can be associated with the D in down. This instructional message can be emphasized by reusing the graph of the supply and demand graph (using the Flash guide Drawing Tools) and by animating the letter D from left to right (using the Flash guide Motion Tween). The mnemonic will have to be explained with text (using the Flash guide Dynamic Text). Figure 12.4 illustrates this method.
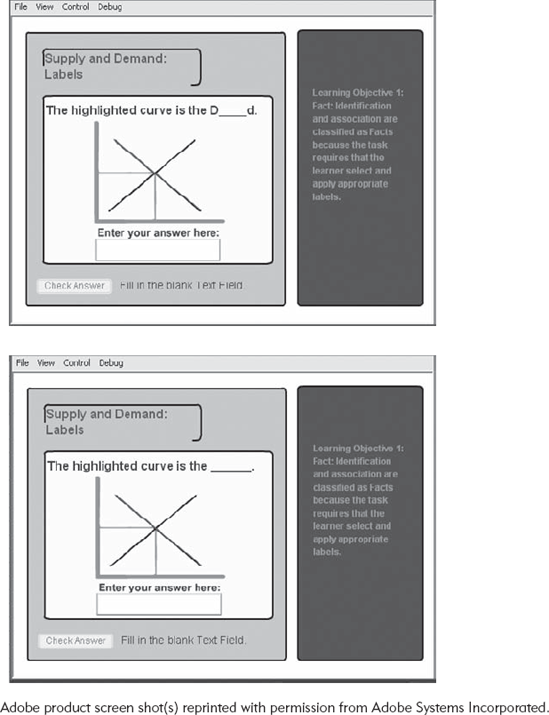
Since this objective is to match labels with parts, it is a good idea to select a practice sequence that emphasizes the naming. The scope sequence is appropriate because it could provide hints as to the naming the parts. Recall that the scope sequence entails removing certain words and letters and replacing them with various degrees of hinting.
A scope practice sequence can be implemented with the Flash guide's Short Answer Learning Component. When using this method, you will have to reuse the supply-and-demand graph that was created with the Flash guides Drawing Tools and Graphic Symbol Tools. The graph will have to be manipulated a number of times to highlight each component. Those manipulated graphs will then have to be presented on the same screen as the Fill in the Blank Learning Component.
Be sure to modify the background of the learning component so that it integrates with the rest of the interface. You will need to create a number of versions for each label that includes various stages of hinting. In Figure 12.5 you can see how a scope sequence might be displayed.
You may also need to create a scope sequence that requires the learner to select the appropriate part of the graph based on the same type of hinting mentioned above, but instead of typing in letters and words the users select portions of the supply-and-demand graph to indicate their response. This can be accomplished following the Flash guide Hot Spot Learning Component in tandem with the Drawing Tools and Graphic Symbol Tools.
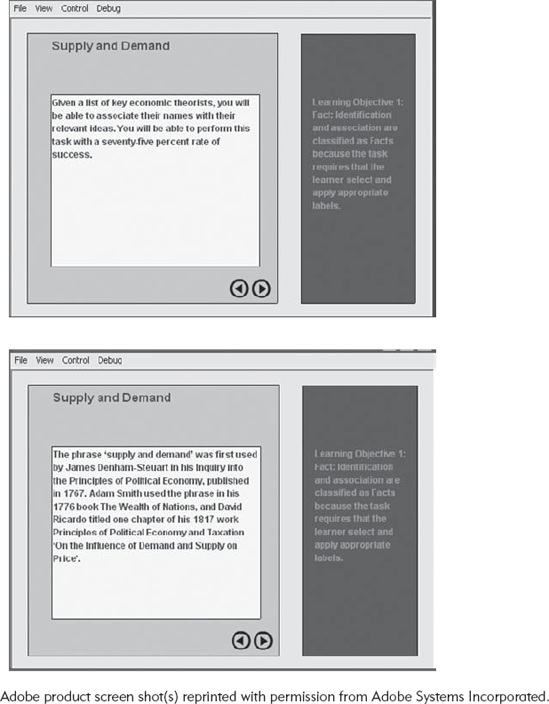
Clarity. This objective involves comprehending verbal discourse and is entirely a text-based activity. Special attention should be made to writing clear, easily understandable content. The content should be displayed on a background that separates the elements on the screen. To make the background interface, you will need to follow the Flash guide Drawing Tools. Since the background interface is likely to be used repeatedly, it should be combined into a Graphic Symbol. The text, title, and objectives should be presented on the screen by following the Flash guide Dynamic Text. Pages will have to be navigated by implementing the procedures on the Flash guides Button Symbol and Navigation Code.
This type of online learning application is often called a of "page turner." Some applications consist entirely of "page turning," which can be dull and use little of the power of Flash. However, they are appropriate when you need to present text information to the learners.
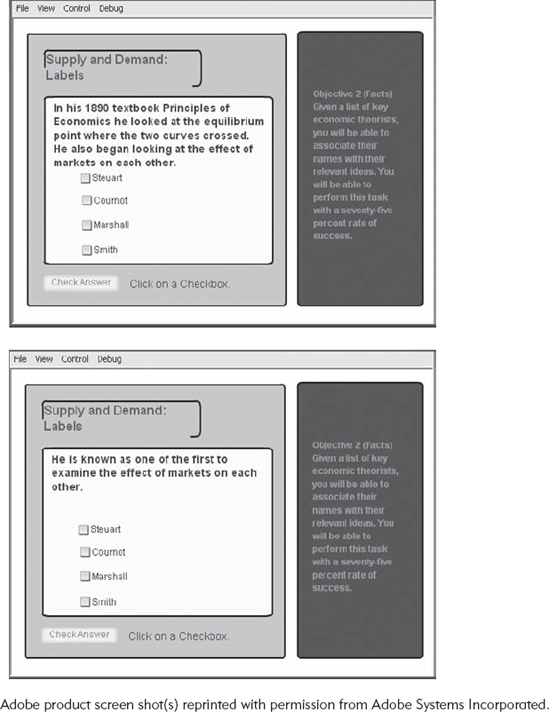
This objective requires the learners to match verbal discourse with labels. Verbal discourse is a type of Fact that requires comprehension as well as matching. The Structural Management Strategy provides enough support so that all the steps connecting discourse to labels is relatively small. Recall that the Support practice sequence begins by providing lots of context and proceeds by removing that context. The Multiple Choice Learning Component is an appropriate selection because the labels fit nicely as distracters. Figure 12.6 demonstrates the implementation.
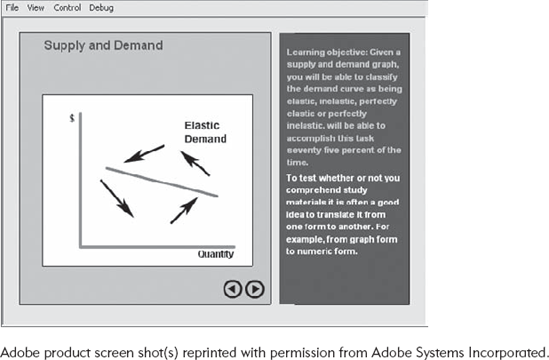
Co-Presentation. To understand the concept of elasticity requires knowing the verbal definition and the graphical definition. The co-presentation strategy indicates that both should be presented on the screen at the same time. However, the challenge is that the demand curve graph can take on a number of positions for each category (elastic, inelastic, perfectly inelastic).
The first step is to present the text on the screen using the Flash guides Static Text and Dynamic Text. The supply-and-demand graph frame can be drawn (see Flash guide Drawing Tools). The demand curve can be created with the Drawing Tools. This can be done by drawing a simple line. This line can then be turned into a Symbol (see Flash guide Symbols). Elasticity is classified according to the slope of the demand curve. Each category of Elasticity (elastic, inelastic, perfectly elastic, and perfectly inelastic) can be represented as a range of values, and thus a range of demand curve slopes. The symbol can then be animated to rotate upon itself to demonstrate this different values (see Flash guide Motion Tween). This lesson is demonstrated in Figure 12.7. The arrows demonstrate the direction of motion.
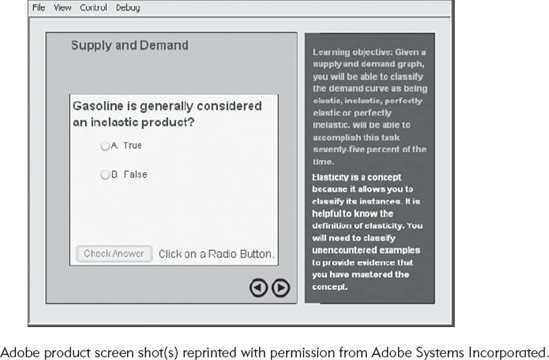
Modality. For this objective, learners ultimately need to be able to appropriately classify un-encountered examples of the concepts elastic and inelastic. However, practice items at the beginning of the sequence may have items that are familiar to the learner. For that reason, the Modality will be manipulated in the practice sequence. Familiar and concrete examples will be presented initially and, as the learner is successful, those examples will change to ones that are unfamiliar and abstract. For example, gasoline is a product that learners will have experience with that is elastic (purchases generally are not affected by the price in the short term). Learners understand the logic of their demand for gasoline. Later in the practice sequence, they may be asked to consider examples for which they have less familiarity. Since the learners are primarily being asked to identify examples as being a member of one of two classes the True/False Learning Component will be used to build the practice sequences. Figure 12.8 demonstrates this type of sequence.
Demonstration. This objective requires learners to be able to calculate price elasticity. Calculation requires learners to be able to recall the formula and apply the procedure for manipulating it. This can best be accomplished by using the demonstration presentation strategy. The steps involved in the calculation can be put on the screen with the Drawing Tools. It also may help to make different variables of the equation Flash to draw attention to them. Variables that fade in or change color can be accomplished with a combination the Separate Text and Motion Tween functions (see Flash guides). When demonstrating equations, it is often a good idea to have the steps emerge sequentially on the screen. This emergence can be controlled by placing each step on its own layer and revealing more content on successive frames by allowing the learner to navigate to them through a button (see Symbols Flash guide).
A number of these demonstrations may be useful if they demonstrate working with different values. A number of examples can help solidify the procedure in the learner's long-term memory. Last, the procedure should be presented in a flow chart so that the learners can see all of the steps at once instead of seeing them over time. Flow charts display information that occurs over time simultaneously and thus can reduce cognitive load. Flow charts can be constructed with Flash's native Drawing tools. However, it is often more efficient to create a flow chart using a tool like Inspiration or Visio (see Importing Flash guide).
The terminal goal for this objective is to be able to calculate elasticity. However, the first step is to be able to identify the procedures for manipulating the equation. In this case, it would assist the learner by have two separate practice sequences; one for fading support for the steps involved in the procedures and another to fade support for completing the calculation. These practice sequences can be implemented with the learning components Drag and Drop and Fill in the Blank (see Flash guides).
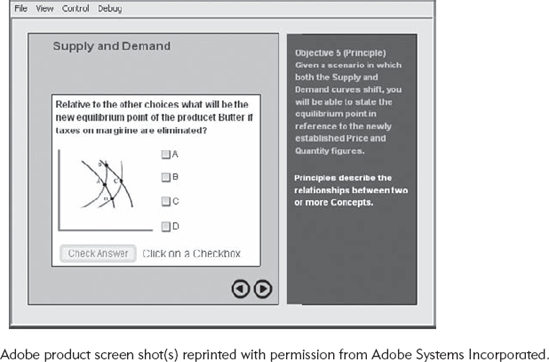
Simulation. The shifting of the supply and demand curves needs to be demonstrated graphically. The graphs will have to be drawn (see the Drawing Tools Flash guide). Perhaps the best way to demonstrate how the relationships change relative to one another is to independently animate both curves (see the Motion Tween Flash guide). The animation can be designed to be controlled by the user to create a simulation (see the Flash guides Movie Clip Control and Variable Simulation).
A practice sequence involving prediction needs to be implemented. Manipulating the Modality may be a good choice. The learners can be provided with support examples that are familiar and, as the sequence progresses, they can be introduced to more abstract scenarios. This type of sequence can be implemented with the Multiple Choice Learning Component (see Multiple Choice Flash guide). Figure 12.9, illustrates the implementation of this component.