
10
Troubleshooting Solutions by Using Metrics and Log Data
This chapter introduces the main services of instrumentation, monitoring, and troubleshooting solutions hosted in Azure. You will learn how to use Application Insights and Azure Monitor to detect performance bottlenecks and handle errors. This chapter will also explain the alerting capabilities of the Azure platform. You will also learn how to instrument your code to get maximum insights from your application. You will learn about advanced techniques for monitoring performance metrics and diagnostics issues on PaaS and IaaS platforms.
In this chapter, you will deploy web apps to Azure App Service and learn how to monitor performance metrics and investigate logs with Application Insights and Azure Monitor. You will also learn how to track communication and monitor dependency performance. You will then learn how to investigate logs and metrics by using Kusto Query Language (KQL).
In this chapter, we will cover the following main topics:
- Monitoring and logging solutions in Azure
- Analyzing performance issues with Azure Monitor
- Exploring Application Insights
- Using KQL for Log Analytics queries
- Discovering Monitor workbooks
Technical requirements
The scripts provided in the chapter can be run in Azure Cloud Shell or be executed locally. The Azure CLI and Visual Studio Code are ideal tools to execute the code and commands provided in the following repository:
https://github.com/PacktPublishing/Developing-Solutions-for-Microsoft-Azure-AZ-204-Exam-Guide/tree/main/Chapter10
The code and scripts in the repository will provide you with examples of provisioning and developing applications for Azure Web Apps and using Application Insights to troubleshoot issues.
Code in Action videos for this chapter: https://bit.ly/3R25zLH
Monitoring and logging solutions in Azure
Azure Monitor is a well-known free monitoring tool that is commonly used to monitor infrastructure services but can also be successfully used for essential monitoring services and security activities. Azure Monitor is a highly extensible tool and can be used for analytics queries running on the Log Analytics platform. The Log Analytics platform includes multiple extensions for specific services, platforms, and databases. Moreover, Azure Monitor can persist data for free only for a limited time. Data persisting limits can be exceeded by leveraging the Log Analytics service. Furthermore, in this chapter, we will learn about Application Insights – a powerful monitoring framework available in Azure.
For services deployed in Azure, Azure Monitor functions as a monitoring hub and collects lots of performance data and logs in its internal database. The idea behind the monitoring hub is to allow the individual Azure product groups to decide what would be best to monitor and report. For example, Azure virtual machines (VMs) report their CPU usage, networking, and disk activities. Meanwhile, Azure Web Apps services report their request rate, memory usage, and exception rate. All services in Azure report their metrics to a single location in Azure. This consolidation has lots of benefits, including allowing running analytics queries across different services’ metrics to find out the real cause of a problem.
Performance metrics are collected from most computer and database services automatically, but by default are persisted for only 30 days. These metrics are usually available as a chart that can be observed on the Monitoring page of the resource. The metrics can be queried by Log Analytics and exported in files. Collected performance metrics, including default and customized charts, can be added to a dashboard. You can share dashboards with users of your organization and monitor multiple services at the same time with live metrics. Performance data and logs can also be persisted in the storage account. For example, Azure VMs can automatically export the collected performance metrics to Azure Table Storage. Azure Web Apps can be configured to export HTTP request logs to Azure Blob Storage.
Azure Monitor collects logs for 90 days. It starts overwriting old logs after 90 days, and at any time, the most recent 90 days of information is captured. With the activity logs, you can find out who provisioned resources, who restarted VMs, and who modified the resource settings. This information also includes health monitoring of the global Azure platform, which is helpful when you perform troubleshooting. The logs of the VM, for example, the application event logs in Windows or system logs in Linux, can also be forwarded to an Azure Storage account. The logs can persist for years to meet compliance requirements. Then, the storage account can be pulled by the Log Analytics workspace to be indexed and queried with analytics requests.
Azure Monitor exposes a RESTful interface to connect to third-party services such as Datadog and Grafana. In the same way, it can be used by first-party Microsoft tools, for example, Power BI. The Azure CLI and PowerShell under the hood can call the services to export data in the files and parse them later with tools such as Performance Analysis of Logs (PAL).
Azure Monitor is one of the many monitoring tools we can use in Azure to diagnose and troubleshoot applications. We mentioned several other services previously that will also help you monitor and troubleshoot applications running in Azure. Let’s look at a quick overview of the main features of Azure monitoring services.
The Azure Log Analytics service requires an Azure Log Analytics workspace to be provisioned to install monitoring tools to monitor the state of VM updates, security baselines, the performance of the server, web requests and app crashes, database size, and load. You can also develop analytics queries with KQL with the collected data and metrics collected in the tables. A request’s result can also be provided as a chart to the monitoring dashboard and can be used as a source of Azure alerts. You will see some KQL examples at the end of this chapter.
Application Insights is another well-known brilliant telemetry service commonly used for web applications that can be used for online monitoring and troubleshooting. Application Insights is a web API service running in Azure. Moreover, Application Insights can perform event tracking and performance tracing in real time. The tracking technology is implemented by the client-side application, reporting the loading and rendering time, and the server-side SDKs, reporting the performance of the server. As a result, Application Insights provides developers with a 360-degree view of the application’s performance and user activities. Application Insights includes sophisticated services to track performance on the dependent services (such as storage account and database), produce custom events and metrics, and collect dumps for application crashes.
Azure Monitor workbooks are a combination of telemetry charts and graphs, widgets, and Markdown text areas with descriptions. You can build your workbooks to monitor all aspects of the application’s performance collected from multiple data sources across Azure. You can print and export the workbook as a report.
In the next sections of the chapter, you will learn details about the services to help you choose the appropriate platform for monitoring and troubleshooting your application and configure performance metrics and log collection.
Analyzing performance issues with Azure Monitor
To better understand monitoring and troubleshooting tools in Azure, we need to deploy Azure Web Apps first, then configure its diagnostic settings and provision an Application Insights instance. After completing this task, from the Azure CLI, you will be able to collect and analyze the web application performance metrics.
Provisioning cloud solutions to explore monitoring features
The following script will help you deploy web app, a storage account, and Azure SQL Database: https://github.com/PacktPublishing/Developing-Solutions-for-Microsoft-Azure-AZ-204-Exam-Guide/blob/main/Chapter10/2%20-%20ai%20config/demo.azcli
The solution will be used in the next parts of the chapter to demonstrate monitoring and diagnostic features. To run the provisioning script, you should install the Azure CLI locally (https://docs.microsoft.com/en-us/cli/azure/?view=azure-cli-latest). Later, Visual Studio Code (https://code.visualstudio.com/Download) will be involved in observing and deploying the code to Azure App Services.
Once you finish provisioning services from the preceding demo script, you can find the web application in the portal and open its Overview page. At the top of the page, you can find the URL to observe the application’s content. Follow that link to open the website in a separate browser window. You can refresh the website page several times to generate some activities and observe the requests with Azure Monitor in the Monitoring section of the App Service blade.
Exploring Azure App Service diagnostic settings
Let’s observe the Monitoring section of the newly deployed App Service. You can configure monitoring features in the Diagnostic settings section.
In Diagnostic settings, we recommend you select all categories of logs and all categories of metrics. There are several options to persist the logs: with a storage account, a Log Analytics workspace, and Event Hubs. You can also configure the partner solutions: Elasticsearch, Kafka, and Datadog. Choose a storage account because it is the simplest way to set and observe the collected output. Note down the storage account’s name to observe its content later.
Let’s now look at the App Service Logs option in the Monitoring section. This feature will let you collect some valuable information for diagnostics: Application logging, Web server logging, Detailed error messages, and Failed requests tracing. Enable those settings and keep collection parameters by default. Those logs will provide you with additional information in the event of application crashes. You can pull client settings, request settings, and exception stack traces. You can also collect the tracing of the application if your web application is built with the diagnostics flag enabled. These logs are extremely helpful if you do not have access to the application code and must deploy a prebuilt solution. You will also notice that logs are available for download by using the internal FTP server running with the application. Do not forget to save the settings when you leave the page.
After you have enabled App Service logs collection, let’s explore another monitoring feature, named Log Stream. You can find this feature in the Monitoring section of your application. When you open Log Stream and refresh the page of your web application, you will see the activities show up on the console. You can see the updates in real time. These settings will help you troubleshoot the exception in combination with logs you persisted in the storage account.
Let’s open the storage account you set up in the Diagnostics settings section previously. In the storage account, you can navigate to Containers and find the containers whose names start with log or insights. In the containers, you can find collected files. Performance metrics will be collected in Azure Table Storage. Observing the results is no trivial task. You can download them by using a query for a specific time frame and build charts in Excel. If the files are too big to open in Excel, you can use BI analytics tools such as Power BI.
Important Note
There is a significant delay, of several minutes, before the logged data shows up in the files and tables.
Azure Monitor for Azure Web Apps
The next task is observing the Monitoring section of the Azure web app. If you return to the Overview page, you will discover five charts: HTTP 5xx, Data In, Data Out, Request, and Response Time. These charts are available to zoom in by clicking on the chart and selecting the time frame. For example, on the Request chart, you can find several requests from the previous page load. You can refresh the website page to display more requests.
You can observe several metrics by adding new metrics or filtering the metric values and combining them on the same chart to get the root cause of the issue. For example, you can combine Response Time and Http Server Errors to study the effect of the error handling on request processing. You can also combine Response Time and Memory working set to study whether the memory pressure affects the performance of your application.
The following chart is a good example of how monitoring helps with detecting performance issues in the production service. The symptom is a random small spike in Average Response Time (orange) followed by a significant spike in CPU Time (light blue). By adding these charts together and also adding Data In calls (dark blue) you can observe that the CPU spike matches the data load spike generated almost at the same time. Upon investigating the weird correlation further with logs, the data transfer activities were recognized to be large SQL queries executed during the first small spike, then a minute of awaiting the database response, and then high CPU usage due to the return of a large dataset requiring processing:

Figure 10.1 – Azure Monitor metrics demonstrating CPU spike issue
The errors and downtime of your solution could be related to issues in the Azure infrastructure. In the next section, you will learn how an Azure outage can affect your solution.
Azure Service Health
Another useful metric of many IaaS and PaaS services is Resource health. This metric is also available for Azure Web Apps and can be found below the Support + Troubleshooting section. Resource health consists of an indicator with traffic light colors. Most of the time, it shows Available (green), which means that the service is available and functioning well. Sometimes, the indicator can indicate an Unknown state, but this is a rare situation. Sometimes, it shows an Unavailable (red) status, which means that the service has health issues and the Azure team is likely working on a solution. During that time, your service might experience delays or not respond at all. The time frame of issues should not exceed the SLA provided for the service.
When you design your solution in Azure, remember the whole solution’s SLA can be lower than the SLA of its services. For example, the total SLA of an Azure Web Apps (Basic tier) and Azure SQL Database should be calculated with the following formula:
The total SLA of the solution will be 99.94%. This means about 1 minute a day and 7 minutes a week of possible downtime when service health issues affect the application.
On the Service Health page, you can also observe the history of status changes and find information about affected services and downtime.
Configuring Azure alerts
The best way to be notified of a specific type of event or changes in metrics is by setting up an Azure alert. Alerts, for example, can be configured from the Azure portal in the Monitoring section on the Azure App Services page.
Configuring alerts includes three steps that need to be completed in sequence: Scope, Condition, and Actions. You need to determine the Scope first. The default scope is the website you want to be monitored. Depending on the resource type, the monitoring metrics and events can vary. Next, you need to select Condition. For example, for App Service, you can monitor the count of Http Server Errors or Requests in Application Queue. For logs, we can use the Restart Web App event to monitor whether the web application has been restarted by enterprise admins.
Next are determinate conditions. You can configure one or more conditions with thresholds determined by OR logic. For each condition, you need to select performance metrics or events. Then, you need to provide the operation for comparing the metric with a threshold (less than, equal to, or greater than), then the aggregation type (sum, count, or average), and threshold values with units of measurement. You can also configure very important metrics for aggregation granularity and frequency of evaluation.
The aggregation granularity is the interval over which data is measured by the aggregation type function. The default 5-minute interval is optimal. If you decrease the interval, your alerts will be affected by spikes in metrics more often. If you increase the interval, alerts can miss some significant changes and be late with notifications.
The frequency of evaluation allows you to configure the period when the conditions are not evaluated. This setting is valuable for an automated response. For example, say you set up a scaling script with an automation account and trigger that with an Azure alert webhook. In this case, after triggering the scaling changes, the alerts should pause until the scaling is complete and load has been properly shared between scaled instances.
The last step to configure Azure alerts is setting up Actions. By the way, there might be no action provided at all, so there will be no notification. Actions lets you set a preferred notification action. SMS, a call to a cell phone, and email are available options for individuals or groups of individuals. An action can also trigger Azure services, such as Azure Functions, Logic Apps, and Automation account scripts, as well as a general webhook available for third-party integration. Then, you need to provide the name of the alert, a description, and the severity to complete the process of setting up alerts.
Important Note
Monitoring Requests in Application Queue will be better than monitoring CPU Time to identify the website’s loading performance. Be aware that CPU activities might be a result of the activation of background processes.
Azure Monitor is the greatest tool to monitor infrastructure performance and collect activity logs. It is quite easy to monitor the application and service health with Azure Monitor diagrams and build a dashboard with the charts provided by Azure Monitor. Meanwhile, Azure Monitor has a few important limitations, such as being unable to create custom metrics, search and parse custom logs, profile application code, and persist performance metrics for more than a month. Those gaps are covered by Application Insights, the powerful and customizable telemetry framework hosted in Azure. In the next part of the chapter, you will learn how to use Application Insights for your application.
Exploring Application Insights
Back in the day, it was always difficult to collect user activity and performance information about a classic web application hosted on-premises or with a hosting provider. Large enterprises developed their own frameworks, which were difficult to adapt and connect. Implementing new monitoring and reporting activities also required significant support effort. Now, the monitoring and telemetry challenge has been successfully solved by connecting to a lightweight service hosted in Azure. The service is easy to adapt and extend and is available for multiple platforms and languages. This service is named Application Insights, which accurately describes what the service provides to developers. Application Insights collects all possible insights about application performance and user activity.
Application Insights is a well-known telemetry framework that collects data from instrumented application code and tracks application activities, performance, custom metrics, and exceptions. Application Insights provides a 360-degree view of the performance of web applications by tracking the client code with JavaScript objects executed in the browser and tracing requests and their metrics from the server side with the SDK. If the code is unviable for instrumentation, Application Insights provides an installer for the server with limited capabilities for handling request metrics and collecting trace and fatal errors. Moreover, Application Insights can be used by not only web applications but also desktop and mobile applications, as well as by add-ons for Microsoft Office applications. Application Insights’ SDK supports multiple languages, including C#, Python, Java, and Node.js, as well as working in browsers running JavaScript. The Application Insights SDK library is already integrated into the C# MVC scaffolding template.
Tracking telemetry is implemented as an async web request to the Application Insights endpoint located in Azure. The endpoint tracks the request without affecting the performance of the corresponding application. Later, the telemetry can be analyzed with Azure Log Analytics, monitored by Azure alerts, and viewed directly from Visual Studio and the Azure portal.
In the following subsections, you will learn how to provision and configure an Application Insights instance and how to connect a website to the telemetry service to monitor activity, troubleshoot crashes, and profile application performance.
Provisioning and configuration
The provisioning of Application Insights is usually completed as part of provisioning Azure App Service. It is also provisioned for Azure Functions and is automatically configured to collect telemetry. Application Insights should be provisioned in the same region as the website to minimize traffic charges and latency. The latest changes are required to use a workspace-based instance connected to an existing Log Analytics workspace. The workspace will be used for persisting telemetry data and running Kusto queries for deep analysis. The location of the workspace should be the same as the Application Insights instance.
Provisioning Application Insights with the Azure CLI
In the previous deployment script, you already provisioned a web application and a SQL database. In the following script, you will provision and configure the Application Insights instance and connect it to your web application:
Notice that the connection string with the Instrumentation key value will be retrieved and Azure Web Apps configuration records will be created with the value.
Once you finish provisioning and linking Azure Web Apps to Application Insights, we need to check whether Applicant Insights is configured properly. You can open the Azure portal and then the web application, and you will find the Application Insights section in Settings. If the Enable… button exists, you should click on the button and configure the settings for the .NET Core application. The following settings should be enabled for .NET Core: Profiler, Snapshot debugger, and SQL commands. The settings should be switched on. In the next tasks, you will deploy a website to use the profiling and debugging options.
Discovering security settings
There are two aspects of security of Application Insights that need to be configured: the networking isolation and authentication for accessing reports.
Networking isolation can be implemented by enabling firewall rules to accept or not accept ingesting telemetry data and query requests from public networks. The firewall rules allow all or nothing from public traffic. For services running in Azure, such as the web app you deployed previously, you can enable Private Link to allow only Azure services such as Azure Web Apps or Azure Virtual Network. Private Link will use only the Microsoft backend network.
To configure the application to send telemetry, Application Insights provides a connection string with the instrumentation key. There is no other authentication required to send the insights to the service. Meanwhile, accessing collected telemetry requires authentication with your Microsoft or Azure AD account. Alternately, the application can obtain API keys to get access to the Application Insights reports from outside of the Azure portal.
Integration with DevOps
Integration with DevOps services is valuable when you analyze insights and detect exceptions. Application Insights supports integration with Azure DevOps and GitHub. You can build a work item (bug) template to submit collated insights to the DevOps service for further processing and fixing. For example, from the Application Insights UI, you can find the crash record and submit the work item with all the information about exceptions added automatically. The integration is implemented as a template you can build in the DevOps solution and referenced as a URL in the Application Insights settings. Then, you need to provide additional fields in key-value format with collected insights.
In the following task, you will learn how to deploy web application code to an Azure instance and observe the performance, activities, dependencies, exceptions, and many other important metrics in real time. But first, let’s deploy the web application.
Instrumenting code to use Application Insights
We have developed the ASP.NET Core MVC website for you, which represents a small e-commerce application with order processing algorithms. From the website, you will be able to list, create, modify, and observe the details of ordered items. The web application uses Entity Framework connected to Azure SQL Database and Azure Blob Storage to demonstrate your ability to track dependency requests. When you deploy the application to Azure, you will be able to observe performance per page, user requests, dependencies, SQL queries, and so on. Execute the following script to build and publish your web application as a ZIP archive:
Before running the script, you need to pull the full project located in the same folder and update your web application’s name in the script with the name generated in the previous script execution.
Once the application is deployed, you can visit the application to generate some activity on the website. You should click on the Details link for some of the products to generate requests to Azure SQL and Azure Blob Storage. You should create a new order by selecting a customer from the list and providing the product’s name and description. You can also edit and delete random orders. To generate and track an error, visit the Privacy page. A few minutes later, Application Insights should have enough data to build a chart for observations. Let’s move on to the next section to learn more about available charts, metrics, and logs.
Charting and dashboards
In the following subsections, you will learn about the metrics and logs collected by Application Insights. You will also learn about services such as availability test and application map. You will learn about monitoring exceptions, profiling, and collecting snapshots for troubleshooting crashes.
Live metrics
Let’s start with the live metrics dashboard. Application Insights supports a live diagram dashboard located in the Live metrics section of the Application Insights instance. On this dashboard, you can monitor in real time the main performance parameters, including Request Rate, Committed Memory, CPU Total, and Dependency Call Duration. When you open Live metrics, open the website in another browser window and generate some requests to observe them on the dashboard:

Figure 10.2 – Live metrics dashboard for the web application deployed previously
Additional charts can be found in the Overview section of the Application Insights instance. The charts include Server Requests, Failed Requests, and Availability metrics.
Performance
Detailed request performance metrics are located in the Performance section of Application Insights. You can observe the Operations tab to learn about operation time per page and the total count of requests per page. This chart helps you identify the pages with a performance bottleneck, drill down to individual requests, pick one, and observe transaction details with a histogram of calls, including dependency calls. In the following screenshot, you can observe the performance graph and by-page metrics:
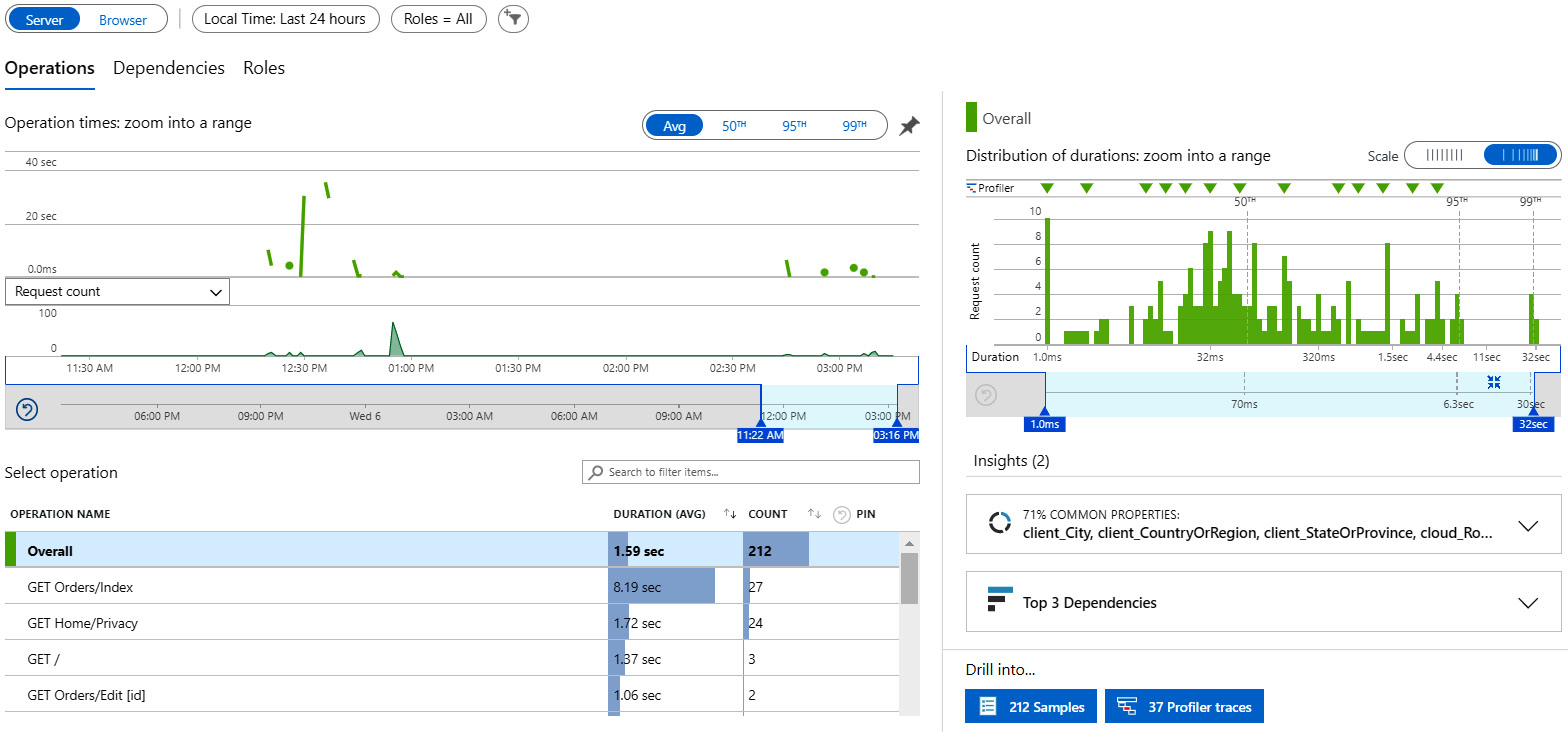
Figure 10.3 – Performance chart with page performance details
On the Dependencies tab in the Performance section, you can also monitor dependency calls, including the performance for each type of dependency, including Azure SQL and Azure Blob requests. Then, you can pick an individual request and analyze its performance over time.
Another tab, named Roles, will let you observe the services hosting your solutions. For website instances, it could be VMs and Azure App Service. The roles are configured in the code and can be assigned as architectural tiers (such as front and mid-tier or backend).
Profiler
The previous screenshot showed the performance details. You can dive deep into an exact request or observe collected profile information. You can also click on the blue Profiler traces button in the bottom right of the performance screen. The profile will demonstrate the performance trace collected from the application for each executed request. You can also observe the slowest requests to find out what your application is waiting for and where the bottlenecks are. For example, the following screenshot is taken from the application you deployed previously. You can observe the profile of the Index page performance. The process was retrieving the orders list from the database and waiting for 89% of the time to get the result in an asynchronous function:

Figure 10.4 – Profile of the loading orders call
The issue seems to be on the database side, which is taking 1.8 seconds in total. The trick is to use views and indexes to improve the performance of the database.
Usage
Another important part of web application monitoring is user behavior. This information could be interesting for the marketing department, which wants to measure the interest of users in products and pages on the website. Application Insights automatically collects user information, except for IP addresses. The rest of the information, about the platform, browser, home country, and city, is available for each request. To learn more about your users, you can observe a session summary. For instance, you can pull the exact session to see the path of the users on the website and visited pages. You can find the Users and Sessions sections under Usage on the Application Insights page.
If you set up client-side event collection with the JavaScript SDK for Application Insights for your website, you can monitor users’ events, such as navigation from the links and clicking on the page buttons. These client-side events are indexed and available for searching in the Events section of the Usage group. You can also build funnels with session parameters to filter out users with specific behaviors, for example, users who prefer to follow recommendations and read reviews on your website, or users who prefer to find an exact product by searching or browsing by category. The Funnels section can be found in the Usage group.
To better understand users’ behavior on the website, you can create a flow chart based on the events collected from users’ sessions:
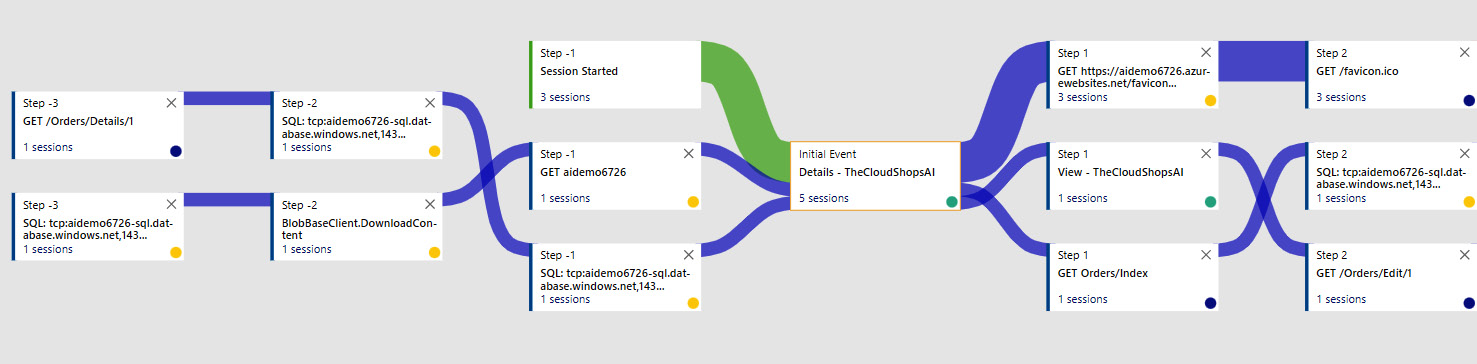
Figure 10.5 – User flow chart for Details page views
For example, most of the users (the thick blue lines) visit the website from the home page, then click on the ticket from the grid and follow to the page where the details about the ticket are located. Meanwhile, some of the users visit the page directly, probably from a search engine. This behavior can be tracked in the User Flows section of the Usage group. In the preceding screenshot, you can observe the graph built for the Details page and included dependency (Azure SQL and Azure Blob Storage) requests.
Exception troubleshooting
One of the brilliant functionalities of Application Insights is the tracking and diagnostics of crashes and exceptions. For properly instrumented code, non-fatal and fatal exception information could be collected, including a stack trace to the problematic function, request parameters from the browser, and even taking a snapshot with debugging information. You can find statistics of exceptions listed by web page, exception type, and timeline. The exception provides a function and activity flow chart to help you determine what other requests to the dependent services were sent. It can also find similar exceptions and help you find the correlation between exceptions and user activity.
If you would like to troubleshoot exceptions, you need to select exceptions from the available lists of exception types (such as HTTP exceptions and NullReference exceptions). Then, you need to pick the recommended or latest exception and observe its profiling output. In the following screenshot, you can observe the exception retrieved from the Privacy page. It is a System.NullReferenceException exception with a call stack retrieved from the code. You can also notice the SQL dependency call above the exception. From the Call Stack output, you can see that the exception happened in the HomeController class, in the Privacy method. The method corresponds to the Privacy page where the exception occurred.

Figure 10.6 – Troubleshooting a NullReference exception collected by Application Insights
Finally, a properly configured Application Insights instance can persist debug snapshots collected on the server side when an exception happened and let you download the dump file. The dump file can be opened in Visual Studio and give you the same debugging experience you have when debugging your code locally. Currently, only .NET Core is supported for snapshot collection. Alternatively, you can open a snapshot on the Application Insights UI and observe the function calls and input parameter values. Collected exceptions are located in the Failures section of the Application Insights instance.
Availability test
Availability is an important metric and can be calculated based on the Azure SLA, as explained previously. Real solution availability depends on many factors, including exceptions and outages on the servers. Application Insights can set up HTTP pings from the selected data centers to ping your application with the provided URL and record the latency. This option can be configured manually and represent a chart with available (green) and failed (red) requests. You can configure the availability test for your application by choosing Availability from the Investigate section, adding the tests from the menu at the top, and selecting the URL for testing and the test locations. After a few hours, you can observe the results of your application’s availability, which will look similar to the following:
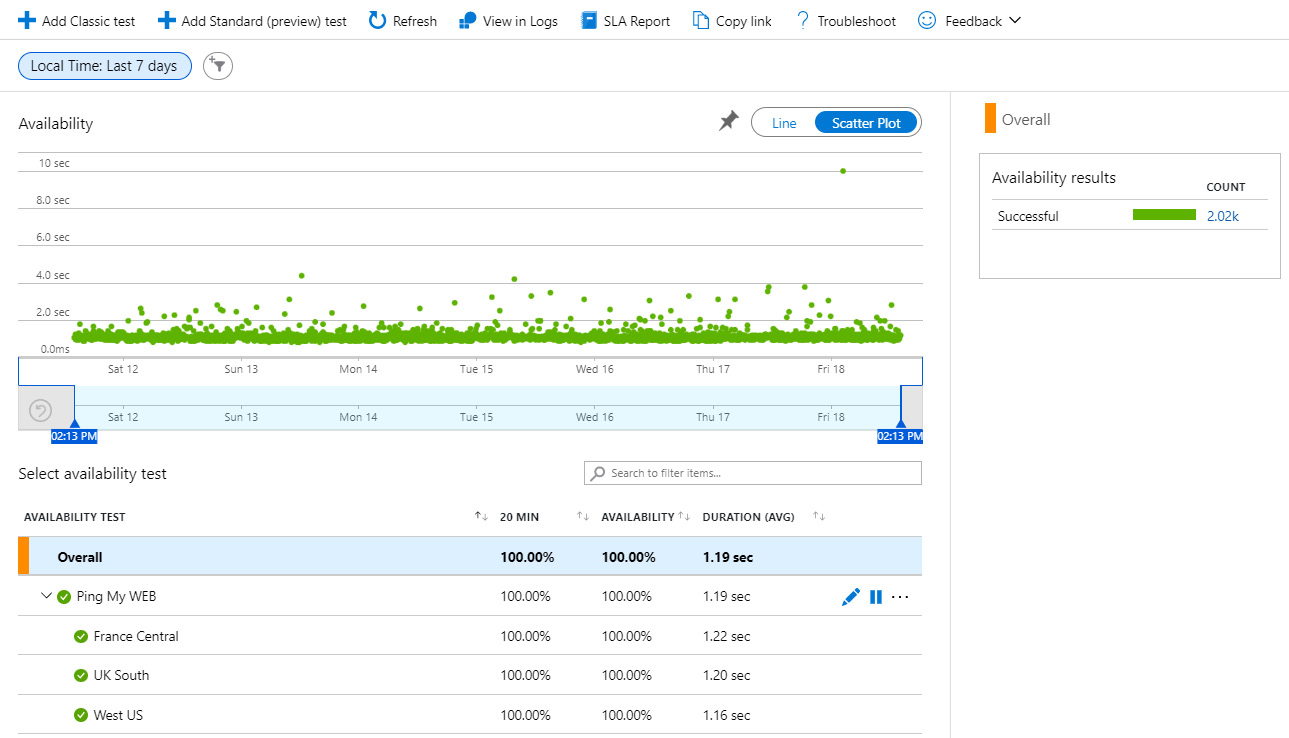
Figure 10.7 – Application Insights availability test results
Application map
The ability to track dependency calls is essential information for troubleshooting exceptions. The best chart of dependency calls made by the whole solution can be found under Application map in the Investigate section. Look at the following screenshot of the application map built as a result of monitoring the application as previously provisioned. The map consists of an instance of the web application (aidemo6726), Azure SQL (aidemo6726-db-SQL), Azure Blob (aidemo6726), the code profiling service (profiler), and calls to the Azure Storage containers (blobbase). The following chart shows the percentage of failed requests (16%). Most of those happened when the Privacy page was requested:
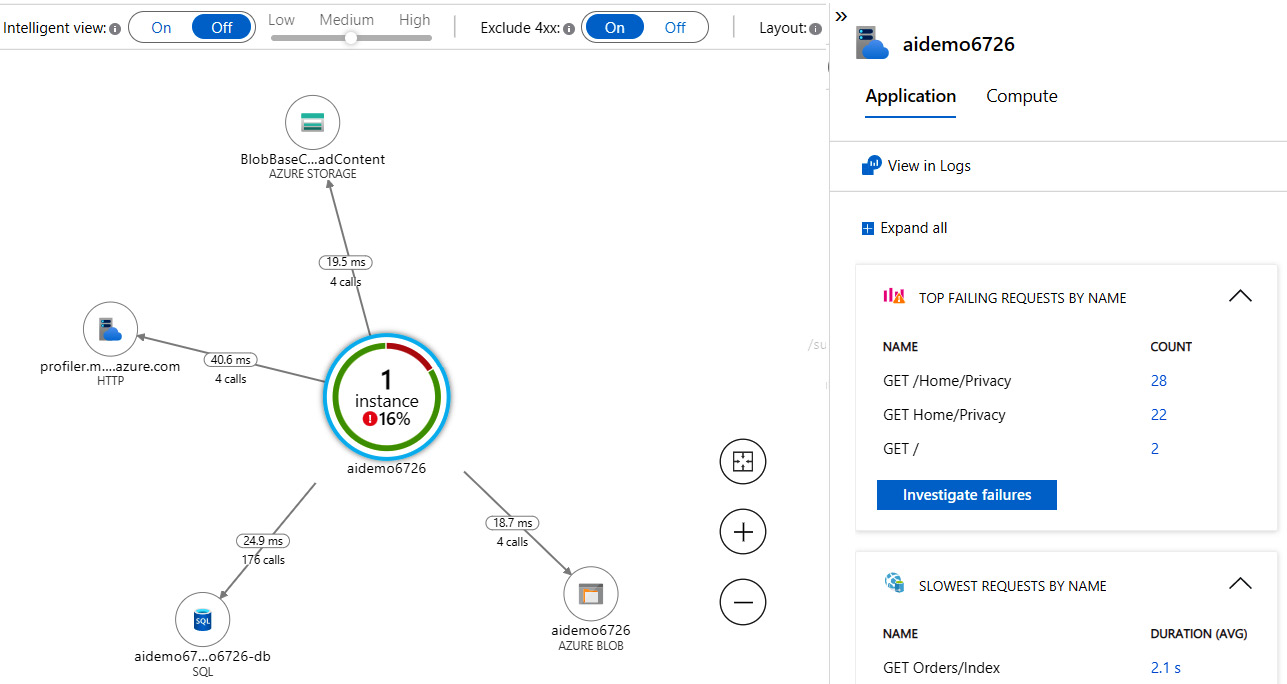
Figure 10.8 – Application map for the deployed application
The application map helps you understand the solution architecture and monitor the requests. It is interactive, and you can click on each of the circles to get details about operations, their performance, and exceptions. You can drill down into the metric to observe collected details. You can also troubleshoot the dependency problem. For instance, if the dependent database is not available for connections, you will see connection errors according to each dependent resource. In the next sections, we discuss how to configure the monitoring features from the code and how to get the most out of code instrumentations.
Instrumenting the code
In the following subsections, you will learn about code instrumentation features. Luckily, the minimum monitoring information can be collected without instrumentation code. This is good news for companies who do not have access to the code of the application they host. Meanwhile, the most valuable troubleshooting information you can get is the application code instrumented to track events with Application Insights. Let’s discuss how to use client-side telemetry for JavaScript, server-side telemetry, track traces, exceptions, and custom events, and observe collated insights on the Azure portal.
JavaScript – client
The general approach to client-side monitoring is enabling a JavaScript library for Application Insights. The following code snippet can be added to the master page of your application. You can install it by executing the following command or referring to the original GitHub snippet (https://github.com/Microsoft/ApplicationInsights-JS#snippet-setup-ignore-if-using-npm-setup):
npm i --save @microsoft/applicationinsights-web
Once you have added the required package to your web application page, you can track any client-side events, such as button clicks, text validation, AJAX calls, and also exceptions that happen in the user’s browser. The following code snippet will track a custom trace and create a custom event:
import { ApplicationInsights } from
           '@microsoft/applicationinsights-web'
const appInsights = new ApplicationInsights(...config...);
appInsights.loadAppInsights();
appInsights.trackTrace('Some debug trace info')
appInsights.trackEvent('User clicked on [check-out]')
Because the Application Insights library can track client-side requests (AJAX), the tracking info is quite useful for diagnostics and monitoring single-page applications (such as React).
C# – server
The server-side instrumentation is available for multiple languages, including Python, Java, Node.js, and C#. Many other languages provide community-based support for Application Insights. By default, Application Insights tracks common performance counters and performance of the client requests on the server side, as well as standard dependencies such as SQL, queues, and Azure Blob. All unhandled exceptions are also tracked by default. Meanwhile, the code instrumentation approach will allow you to track handled exceptions and trace information, custom metrics and custom events, and custom dependencies to the related services. This information will give you a 360-degree view of your application and help you troubleshoot delays and crashes.
The following code snippets will demonstrate to you how to use SDK functions to instrument the code:
- Debug trace: Tracing custom information can be implemented by calling the following function. You can set the severity of the message and provide information that helps with debugging:
telemetry.TrackTrace($"Order #{id} Deleted",
SeverityLevel.Warning);
- Custom events: Custom events help developers track specific events generated in the business logic, such as creating a new order. The following example demonstrates how to create custom events and events with parameters:
telemetry.TrackEvent("New Order added");
telemetry.TrackEvent("New Order",
new Dictionary<string, string>() {
{ "Product" , order.ProductName },
{ "Size" , order.Size.ToString() },
{ "Client" , order.Client.Name },
});
- Custom metrics: The requirement of tracking custom events is quite common for modern web applications. For example, you can track the application metrics, such as the number of received records in a recordset, or business metrics such as adding products to the cart before checking out. The following code describes how a custom metric can summarize the number of orders with additional details:
telemetry.TrackMetric("Orders", 1);
telemetry.TrackMetric("Orders", 1,
new Dictionary<string, string>() {
{ "Order #" , order.ID.ToString() }
});
- Error tracking: The default functionality can track the unhandled errors (crashes) without instrumentation of the code. Meanwhile, you can get more details if you instrument the code. The code guidelines always recommend not swallowing exceptions. You can always track error information for further debugging instead of swallowing it. The following code example tracks the exception if the updating client does not exist and creates a new one:
try {
_context.Clients.Update(theOrder.Client);
_context.SaveChanges();
}
catch (Exception ex) {
telemetry.TrackException(
new Exception("The Client does not exists",ex));
_context.Clients.Add(theOrder.Client);
_context.SaveChanges();
}
- Custom dependency: Appropriate tracking of a dependency enables telemetry to granularly collect insights and provide details about what dependency operation was executed. The following code example will track dependency calls to the web API:
using (HttpClient httpClient = new HttpClient()){
Stopwatch sp = Stopwatch.StartNew();
var result = httpClient.PostAsync(url, data).Result;
sp.Stop();
telemetry.TrackDependency("WebAPI",
"Create Product", data,
DateTime.Now.AddMilliseconds(-sp.ElapsedMilliseconds),
sp.Elapsed, result.IsSuccessStatusCode);
}
All operations mentioned before to track events and metrics, errors, and debug messages can be found by using Transaction search features on the Application Insights interface in the Azure portal. Transaction search is located in the Investigate section. The following example represents dependencies, custom events, and metrics collected from the application you deployed. It has a search field to help you find specific events or messages by keyword:

Figure 10.9 – Transaction search output
Transaction search helps you find the exact record and drill down to its parameters. Meanwhile, the search will not be able to represent results as a chart. The best approach, in this case, is to find a specific record of the metric you want to represent as a chart and copy parameters, then click on View in Logs and create a KQL query based on previously copied parameters. In the next section, you will learn how to use the Log Analytics workspace to build powerful queries to retrieve data from Application Insights. As a result, you can build custom charts for performance metrics, logs, and custom metrics and events and build interactive dashboards to monitor the health of the solution.
Using KQL for Log Analytics queries
Before we use KQL queries to build a custom chart, let’s get familiar with the syntax and architecture. The data you can query with KQL is stored in the internal database provisioned as part of the Log Analytics workspace. In the previous sections of this chapter, you provisioned a Log Analytics workspace. Then, you provisioned the Application Insights instance and provided the workspace as a reference. As a result, all collected logs and metrics are stored in the workspace’s database and are available for querying.
The Log Analytics services provide you with a rich UI to build and run queries. The UI supports navigation through the tables in the database and its fields. It also supports autofill to help you with KQL syntax. Let’s learn the main syntax structure of the queries. To start querying collected data, you open the Log Analytics workspace instance or open Logs in the Monitoring section of the Application Insights instance. Close the Pick Template window and proceed to the queries.
On the left, you will see tables such as pageViews, requests, and exceptions. You can click on a table to observe its columns. By double-clicking on a table or field, you can paste the name into the query window. You just need the name of the table to run your first query. Let’s say you double-click on requests and get the requests query. Click on the play button at the top. If you do not see any output, adjust the time range next to the play button. You should see the records from the requests table. Now, you can add a filter to find a query with an error. Let’s provide the following query with where on the line after the name of the table and add the success column, as follows, to get only fail requests:
requests
| where success == false
For comparison, you can use the more than (>), less than (<), equal to (==), and not equal to (!=) operators to filter records. Also, the contains operator can help with finding string values. Let’s modify the query and use contains to get only requests to the details page:
requests
| where success == true
| where url contains 'details'
One more modification we will add is to sort the output by duration values:
requests
| where success == true
| where url contains 'details'
| order by duration
In KQL, we can summarize the output equal to the GROUP BY behavior in T-SQL. Let’s summarize request count to get the column named hits with 100 hits step of bucketization :
requests
| where success == true
| where url contains 'details'
| summarize hits=count() by bin(duration,100)
| order by duration
The query should provide you with something similar to the following table results. The values might depend on the performance and size of your web applications:

Figure 10.10 – Executing KQL queries on the requests table
In the next example, let’s try a more sophisticated query:
- let will be used to create variables, including date and time variables, by providing your value in the datetime function with the format YYYY-MM-DDTHH:MM:SS.SSSZ
- Reuse the calculated dataset with a list of filtered records
- Summarize results by using the sumif function (summarization with conditions)
- Render results as a line chart with the graph of the Overall number of requests
The resulting KQL request is provided in the following snippet:
let start = datetime("2022-04-06T00:00:00.000Z");
let end = datetime("2022-04-07T23:59:00.000Z");
let timeGrain=1m;
let dataset=exceptions
    | where timestamp > start and timestamp < end
    | where type == "System.NullReferenceException"
;
dataset
| summarize failedCount=sumif(itemCount,severityLevel==3) by bin(timestamp, timeGrain)
| extend request='Overall'
| render timechart
Replace the start and end values with the values from your time range when you did the test. After executing the requests, it provides output similar to the following:

Figure 10.11 – KQL query execution interface showing the result as a chart
Of course, learning about KQL features is not enough to be proficient in the syntax. The documentation provided on the portal contains useful query examples that you can leverage to build charts on dashboards and workbooks. Furthermore, you can set up Azure alerts for the specific values received from queries and be notified when they hit the thresholds. In the following section, you will learn about a new monitoring interface named Azure Monitor workbooks.
Discovering Monitor workbooks
Workbooks are another great tool for reporting and monitoring in Azure. Let’s compare Azure workbooks with other monitoring tools and services, such as Azure dashboards and Power BI:
- Power BI is one of the reporting tools that can be used for monitoring. Power BI reports consume the telemetry data pulled from Azure Monitor and Azure Log Analytics through web APIs. Power BI reports can be printed and published on the server and can also be shared as part of the Power BI dashboard with users in the Azure AD tenant and anonymous users.
- An Azure dashboard represents live activities and includes metrics and logs. The dashboard supports different types of tiles, including charts, images, videos, and Markdown. Usually, a dashboard is a single-page view of the most important metrics of the application that automatically updates. Dashboards support KQL charts, Application Insights, and Azure Monitor metrics. They aren’t designed to be printed as a report or exported. A dashboard can only be shared with Azure AD tenant users.
- Azure workbooks can use sophisticated KQL queries, where you can combine different sources of data, support Markdown, and interact with charts, such as with filtering or ordering. Azure workbooks are based on reporting visuals for simplifying observation and printing reports. Notice that updates are not loaded automatically into a workbook. You need to refresh the workbook to observe the latest metric values. Meanwhile, some charts from the workbook do not exist on Azure dashboards and provide rich configuration settings to adjust the context and time interval. Moreover, Azure workbooks have a template you can use instead of starting from scratch.
Let’s build a simple workbook to monitor exceptions logged by the Application Insights instance of the Azure Web App you deployed previously in the chapter. You need to select Workbooks in the Monitoring section of your Application Insights resource. Workbooks is located under Logs in the same section. Alternatively, you can search for the Workbooks section in the portal. Then, you need to create a new workbook by choosing empty QuickStart templates.
You can add a new section by clicking on the Add link and choosing the Text item. Then, switch to Markdown text and add the following snippet:
## Null Reference Exceptions
The time chart of exception occurrences in the application for the **last day**
You can also add a diagram by selecting the Add Query item and providing the following KQL query. It is a modified version of the query you used previously. The start and end of the period should be hardcoded in the query and provided globally from drop-down filters at the top of the item:
let timeGrain=1m;
let dataset=exceptions
    | where type == "System.NullReferenceException"
;
dataset
| summarize failedCount=sumif(itemCount,severityLevel == 3 ) by bin(timestamp, timeGrain)
| extend request='Overall'
| render timechart
After you finish creating them, your workbooks should look as follows:

Figure 10.12 – Azure workbook created with Markdown and query items
You can keep going and investigate other quick-start templates available for Application Insights resources. For example, the Performance Counters, Dependency failures, Exceptions, and Active Users workbooks visualize the main metrics of the application and help with troubleshooting issues.
Summary
In this chapter, you have learned about a variety of monitoring tools available in Azure. You played around with Azure Monitor and were able to retrieve performance counters for your application, such as request rate, CPU usage, and failed requests. You learned about different options for persisting and analyzing logs by using Azure Blob Storage and Log Analytics workspaces. You also learned about Application Insights – the most powerful tool for monitoring and troubleshooting applications running on Azure platforms or on-premises. You got familiar with a variety of useful charts provided by Application Insights to monitor and detect bottlenecks in performance, investigate crashes, and collect dependency metrics of the solution’s components. You also learned how to instrument the code to collect custom metrics and custom events, and handled exceptions. We introduced essential skills of root cause analysis by using custom KQL queries and custom charts. You learned about various ways of representing collected metrics and logs, including Azure workbooks and Azure dashboards. You were also made aware of the availability test and Azure alerts as the best way to be informed of an application outage. All of these skills and knowledge will be verified through exam questions and also help you successfully monitor and troubleshoot your enterprise application running on the Azure platform.
In the next chapter, we will continue our journey through Azure platform services and learn about the implementation, hosting, and protection of mid-tier web API services with API management resources.
Questions
- What metrics are collected with Azure Monitor?
- What is the difference between an activity log and an application log?
- How do you collect dependency metrics for Application Insights?
- How do you set up tests to determine when the application does not work or produces errors?
- Does code instrumentation require collecting crash information?
Further reading
- The following link introduces best practices for logging and monitoring with Azure Monitor:
https://docs.microsoft.com/en-us/azure/azure-monitor/best-practices
- You can discover a recommended technique for troubleshooting metrics of web applications with Azure Monitor at the following link:
https://docs.microsoft.com/en-us/azure/azure-monitor/essentials/metrics-troubleshoot
- You can find recommendations about implementing Application Insights for ASP.NET Core websites at the following link:
https://docs.microsoft.com/en-us/azure/azure-monitor/app/asp-net-core
- You can learn more about tracking custom events and metrics in code at the following link:
https://docs.microsoft.com/en-us/azure/azure-monitor/app/api-custom-events-metrics
- The following link demonstrates how to debug crashes collected by Application Insights snapshot debugging:
https://docs.microsoft.com/en-us/azure/azure-monitor/app/snapshot-debugger
- The following article explains how to collect logs from a VM that runs websites:
https://learn.microsoft.com/en-us/azure/azure-monitor/agents/data-sources-iis-logs
- You can read more about setting up Application map at the following links: