
Chapter 13: Using Test and Monitor for Unit Tests
In today's digital world, we are all about speed and efficiency. With continuous integration (CI) and continuous deployment (CD), we can be developing our APIs and publishing them at a rapid pace, but we must also not lose sight of quality. Often, we are so concerned with time to market that we may loosen up on our testing efforts. This is why we must also have an efficient yet effective way to test as we progress through our development and publishing efforts. Many tools on the market let us send test requests, build Test Suites, and create assertions, but this same type of tool is already available within the API Connect product. This is the test and monitor tool, which must be installed as a separate add-on. This tool is included in, and integrates into, your API Connect API Manager, allowing you to test your APIs as you develop and publish them.
In this chapter, we will introduce you to the basic functionality of the test and monitor tool so that you will know how to utilize the capabilities within this pre-packaged toolset in API Connect.
In this chapter, we will cover the following topics:
- Configuring unit tests
- Working with environments
- Monitoring tests
Technical requirements
The examples presented in this chapter will require that you install API Connect, along with the test and monitor tool. You should also have at least one API developed and published that you can test within your test cases.
Configuring unit tests
As you develop and change your APIs, you should be unit testing them incrementally with specific unit test cases for the change you have just made or testing the API in general. The API Connect test and monitor tool allows you to quickly generate these unit tests by simply sending a request to the API URL and getting a response. This tool will provide some assertions that you can use as-is, alter, delete, or add to. Let's take a look at how to configure a simple unit test case for an API that you are working on.
Before you start to create your first unit test, you must ensure that you have the test and monitor tool add-on installed. To verify this, log into API Manager. The bottom right tile on the home screen should be labeled Test APIs, as shown in the following screenshot:
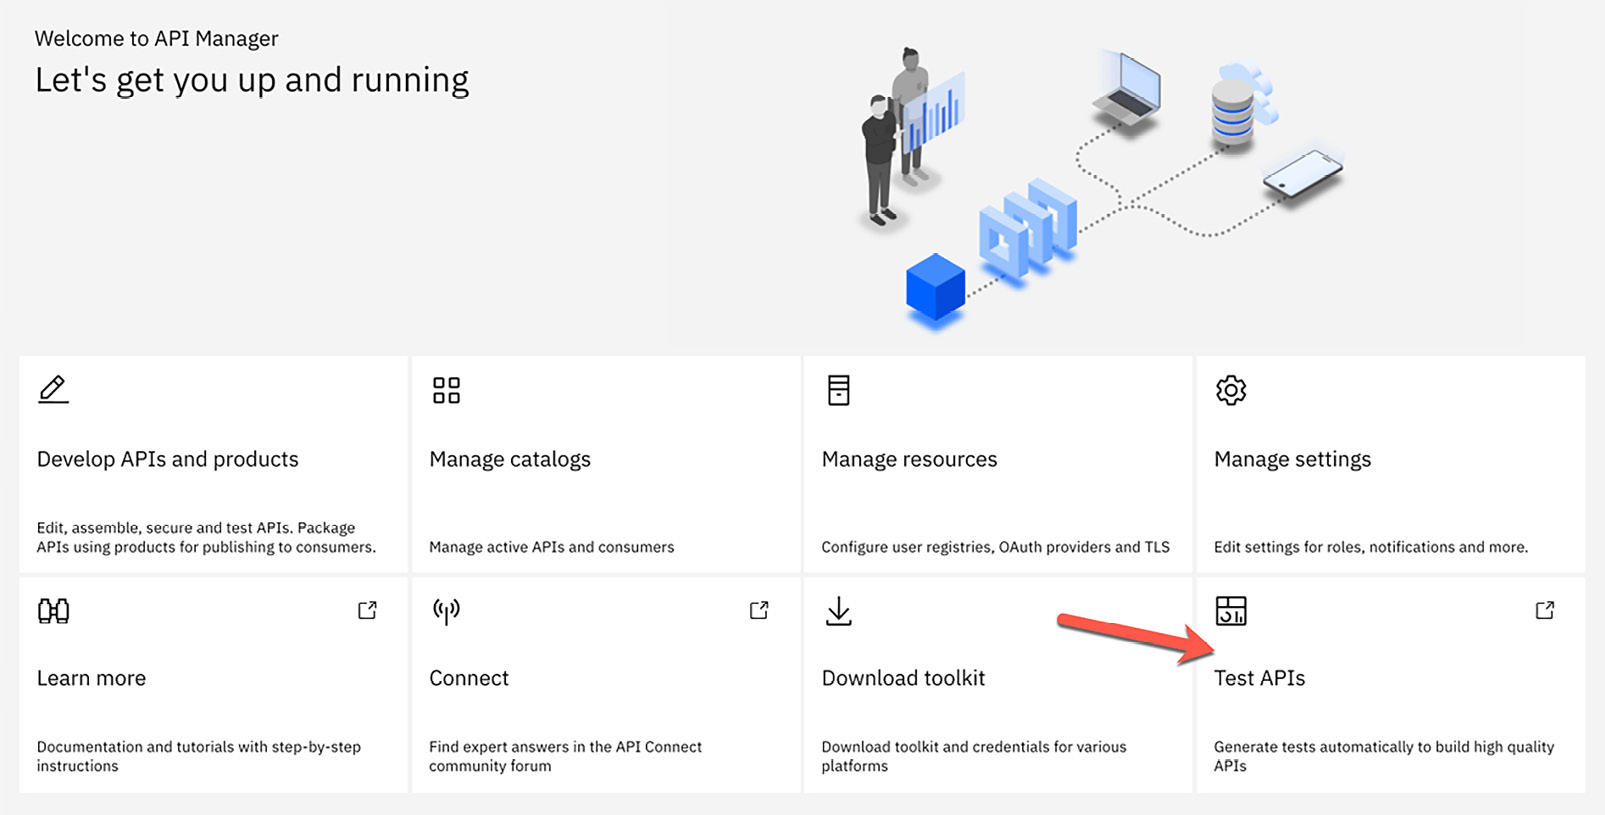
Figure 13.1 – Verifying that the test and monitor tool is installed
Once you have verified that you have the test and monitor tool installed and available, clicking this tile will open the tool in a new tab, where you will be looking at the tool's home screen, as shown here:

Figure 13.2 – The test and monitor tool's home screen
As you will notice when you open the tool for the first time, there will be a current summary of all of your Test Suites, test cases, and other data from past test case executions. Since this is your first time accessing this tool, all of these values will have a zero count.
Before we start configuring these Test Suites and test cases, let's take a look at the HTTP Client. To access this, you must click the HTTP Client link on the home screen. Once you click this link, you will be brought to the HTTP Client screen. This layout and functionality may look familiar to you as it is similar to other testing tools present on the market today. From this screen, you can submit an HTTP request to any URL using any of the available HTTP methods. The following screenshot shows this default screen as it is presented to you. Here, we have numbered each of the components of interest when you submit a simple request to your API:
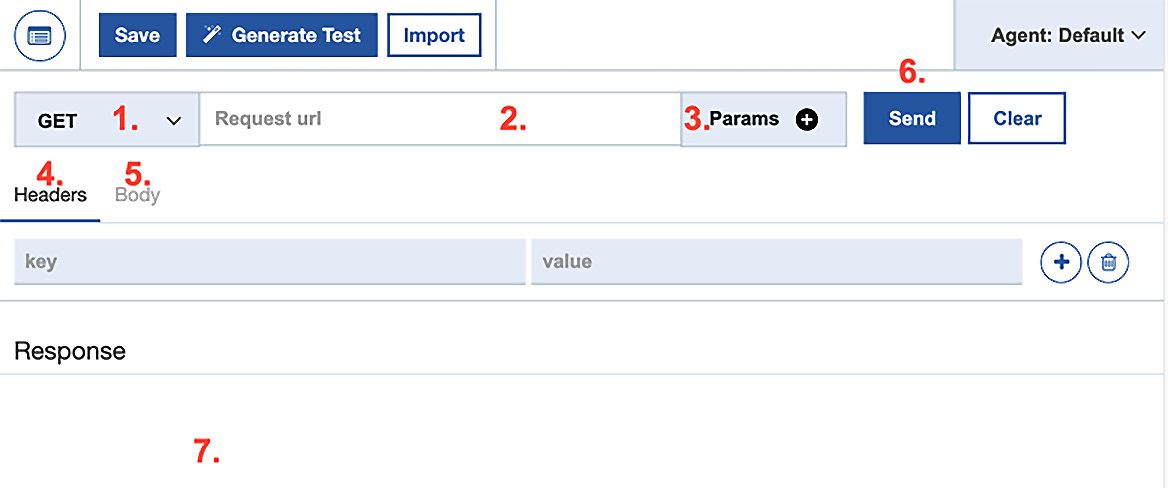
Figure 13.3 – HTTP Client
Let's take a look at each of the fields, options, and buttons that will be of interest to you when you're generating your HTTP request:
- HTTP method: Using the dropdown list in this field, you can select the HTTP method to use for your test request message. The available options are GET, POST, PUT, PATCH, and DELETE.
- Request url: This provides the request URL for your API to be tested. Do not add query parameters to this field.
- Params: Using this button, you can add query parameters to your request in key/value pairs. As you add these params, they will automatically populate in your request URL.
- Headers: Provide any HTTP headers to be sent in the request in key/value pairs. Using the + button, you can add additional HTTP headers to the list.
- Body: If applicable, this provides two options for adding a request body to your request. You can provide a raw request body that gives you a generic text area to add your request, or you can choose a URL that's been encoded where you can provide key/value pairs for your request body.
- Send: Use this button to send your request message once all the request fields have been entered.
- Response: The response to your request will be shown here once sent.
As you can see, there are more options available on this screen that we will cover later in this chapter. The fields we've described already will be the ones you need to generate your first HTTP test message for.
Let's take one of our fictitious healthcare APIs, called Member API, and send a test request to it. This API has a path for getPatient that accepts an HTTP GET method and requires a query parameter named memberID. This API is secured by a client ID and client secret, so we will need to add these as our request headers. The following screenshot shows our test request containing all of the required information, as well as the response that's received from the API. Since this is an HTTP GET request, there will be no body to send:

Figure 13.4 – Test request for Member API
Taking a closer look at the preceding screenshot, you can see that we have chosen the HTTP GET request and provided the request URL. We added the memberId query parameter to our Params list, which automatically added it to the request URL as expected. Finally, we added X-IBM-Client-id and X-IBM-Client-Secret and their corresponding values to the Headers list and clicked on the Send button.
After submitting this request, the response body message is displayed in the Response area. Let's take a closer look at what is provided here. After all, the response is what you are interested in when testing. What should be clear right away is the response body that is returned from the API. This can be seen as raw text or parsed for better readability. Of course, you would be interested in the response body, but there is more information that you would likely be interested in when testing your APIs. If you look at the top right of the Response area, you will notice some critical pieces of information. There, you can see the HTTP response code, Latency time, Fetch time, and Total Time taken in milliseconds.
In addition to the response body, HTTP response code, and latency details, you can view all of the response headers by clicking the tab to the left of Body in the Response area.
As we mentioned earlier, you can also submit a request using other HTTP methods. For example, you could submit an HTTP POST that would require a message body. The following screenshot shows an example of this by submitting an HTTP POST request to our Member API using the addPatient path, which would expect a POST request and message body. As you can see, you have the same type of response data available as you did for the GET request:
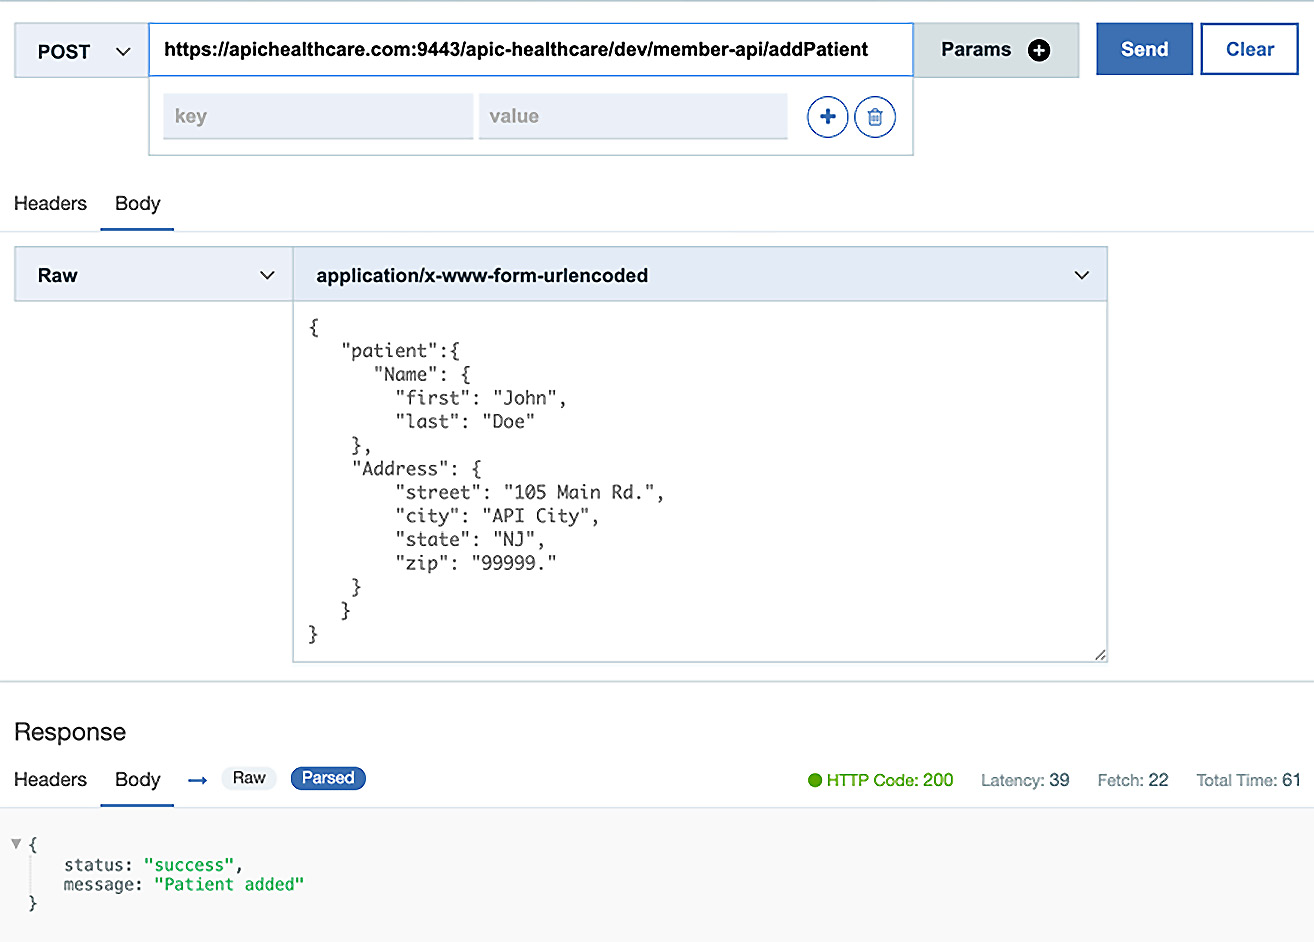
Figure 13.5 – Member API POST request
As you have seen, the API Connect test and monitoring tool lets you send a test request to your APIs and display some useful information about the response. Although this could be useful for some one-off tests, it isn't much more than you could do with some command-line tools you might already have, such as cURL. Let's face it – having to manually enter your test case and visually inspect the response is time-consuming and prone to errors. To be useful and show some value in our rapid development and delivery model, you would need some more repeatable test cases that can automatically check the response data via assertions that you could build on as you develop. Let's dive a little deeper into the test and monitor tool to see how it can accomplish these tasks as well.
Before you start creating test cases, you will need to create a Test Suite to save the test cases in. This project could be a grouping of test cases for one API, one product, or any other way you wish to organize your test cases.
To create a Test Suite, you will need to navigate to the home screen by clicking the API Management Test APIs link in the top-left corner of your screen. Once you are back on the home screen, you can click the + or Create Test Suite button to create a new Test Suite, as shown here:

Figure 13.6 – Create Test Suite
Providing a name for your new Test Suite and an optional description, and then clicking the check symbol in the top-right corner, completes the process of creating your new Test Suite. The following screenshot shows us creating a new Test Suite for our Member API:

Figure 13.7 – Add new Test Suite
Once you have created your new Test Suite, you will see all of the details for it, such as test cases, events, and failures. Of course, these will all be set to zero when you first create the Test Suite until you add some test cases to it. Now, let's learn how you can take your test case, add some assertions, and save it to your newly created Test Suite.
You can create a new test case in several different ways within the test and monitor tool. You can click the Create Test button on the home screen or you can create a new test case from within your Test Suite configuration. There is also one more way to create your test case, which will build upon what you have learned so far in this chapter. You can take the tests you create within the HTTP Client and simply add them to a Test Suite. Let's explore this option as we already have some experience here. Besides, this is a good way to fine-tune your test cases and add assertions before adding them to your suite. To do this, navigate back to the HTTP Client screen by clicking the HTTP Client link at the top right of the screen.
In Figure 13.4 and Figure 13.5, we showed how easy it is to submit a request to your API. This would include the request URL, query parameters, request body, and HTTP request headers. Once you submit your test requests to your APIs, you will also get the response data, which should prove whether your test is a success or a failure. Upon visually inspecting these fields, you can determine this test result's status. As we mentioned earlier, this is not the ideal practice for running and interpreting your test cases. The test and monitor tool, like any good testing tool, lets you create assertions for each test case that can be configured to inspect any piece of the response data available. This lets you determine if the test was a success or a failure. Luckily, you don't have to start this process from scratch. This tool can take your current request and response data and automatically create most of the assertions that you might need to determine the test results. After submitting a test request, with one click of a button, you can automagically generate a test case that will contain several assertions based on your current response data. If you haven't guessed already, the button at the top of the HTTP Client screen labeled Generate Test is this magic button, as shown here:
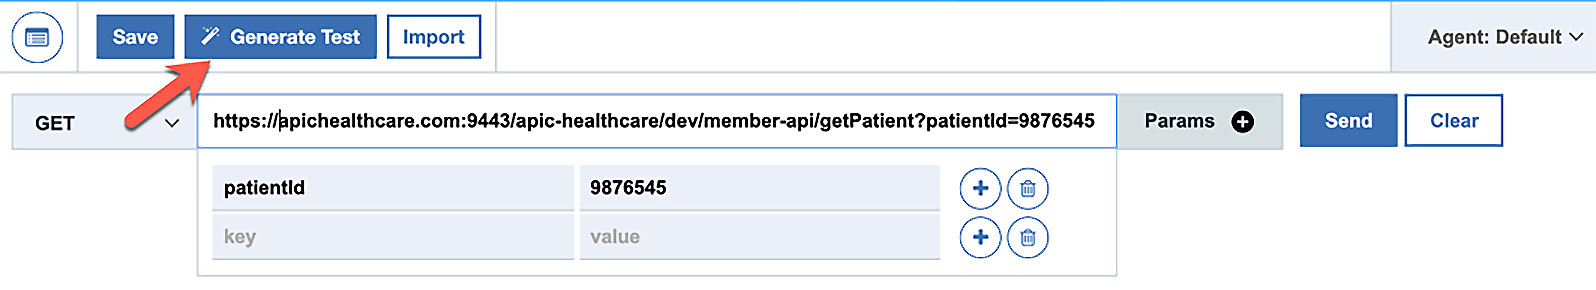
Figure 13.8 – The Generate Test button
Once you've clicked this button, you will be asked to give the test case a name and select which project to save it to. The following screenshot shows that we have named our test case getMember_success and saved it to our newly created Member API project:
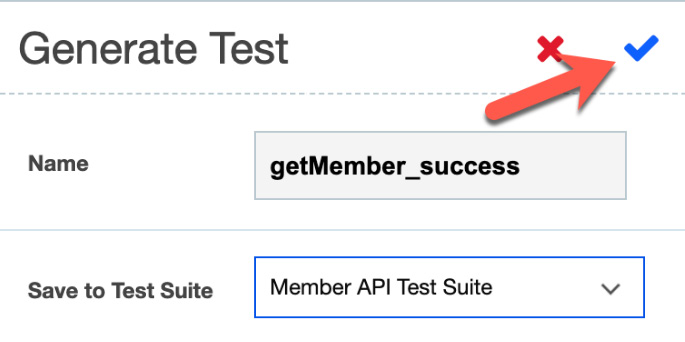
Figure 13.9 – Providing a test case name and Test Suite
If you're ready for the magic, all that is left is to click the checkmark to create your new test case, which automagically creates assertions! Once you've done this, you will be notified that the magic has been completed as you will see a list showing everything that the tool has done and if it was successful. The following screenshot shows that we were successful in creating our new test case and that it created some global parameters, an input set, and assertions:
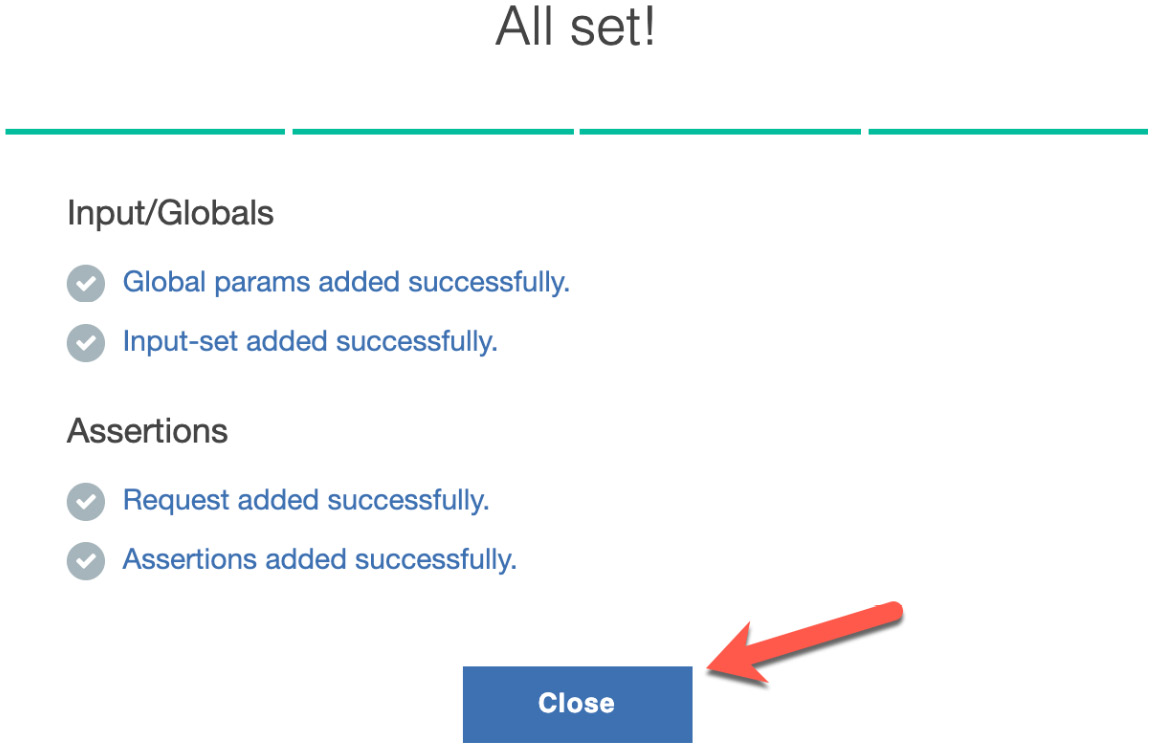
Figure 13.10 – Completed test case confirmation
Clicking the Close button will bring you to your new test case. Depending on the size of your response, you will see that several assertions have been created corresponding to each data element that was in the response. You will also see an assertion for the HTTP response code, response Content-Type header, and any additional response data that the tool was able to derive an assertion for. In addition to the automatically created assertions, you will notice that the test case now has global parameters assigned for the request fields that may change from environment to environment, such as your request URL, client ID, and client secret. The following screenshot shows our automagically generated test case with the global parameters replacing the URL, input set variables for the client secret, client key, parameters, and all of the assertions for the successful response we received from our test request:
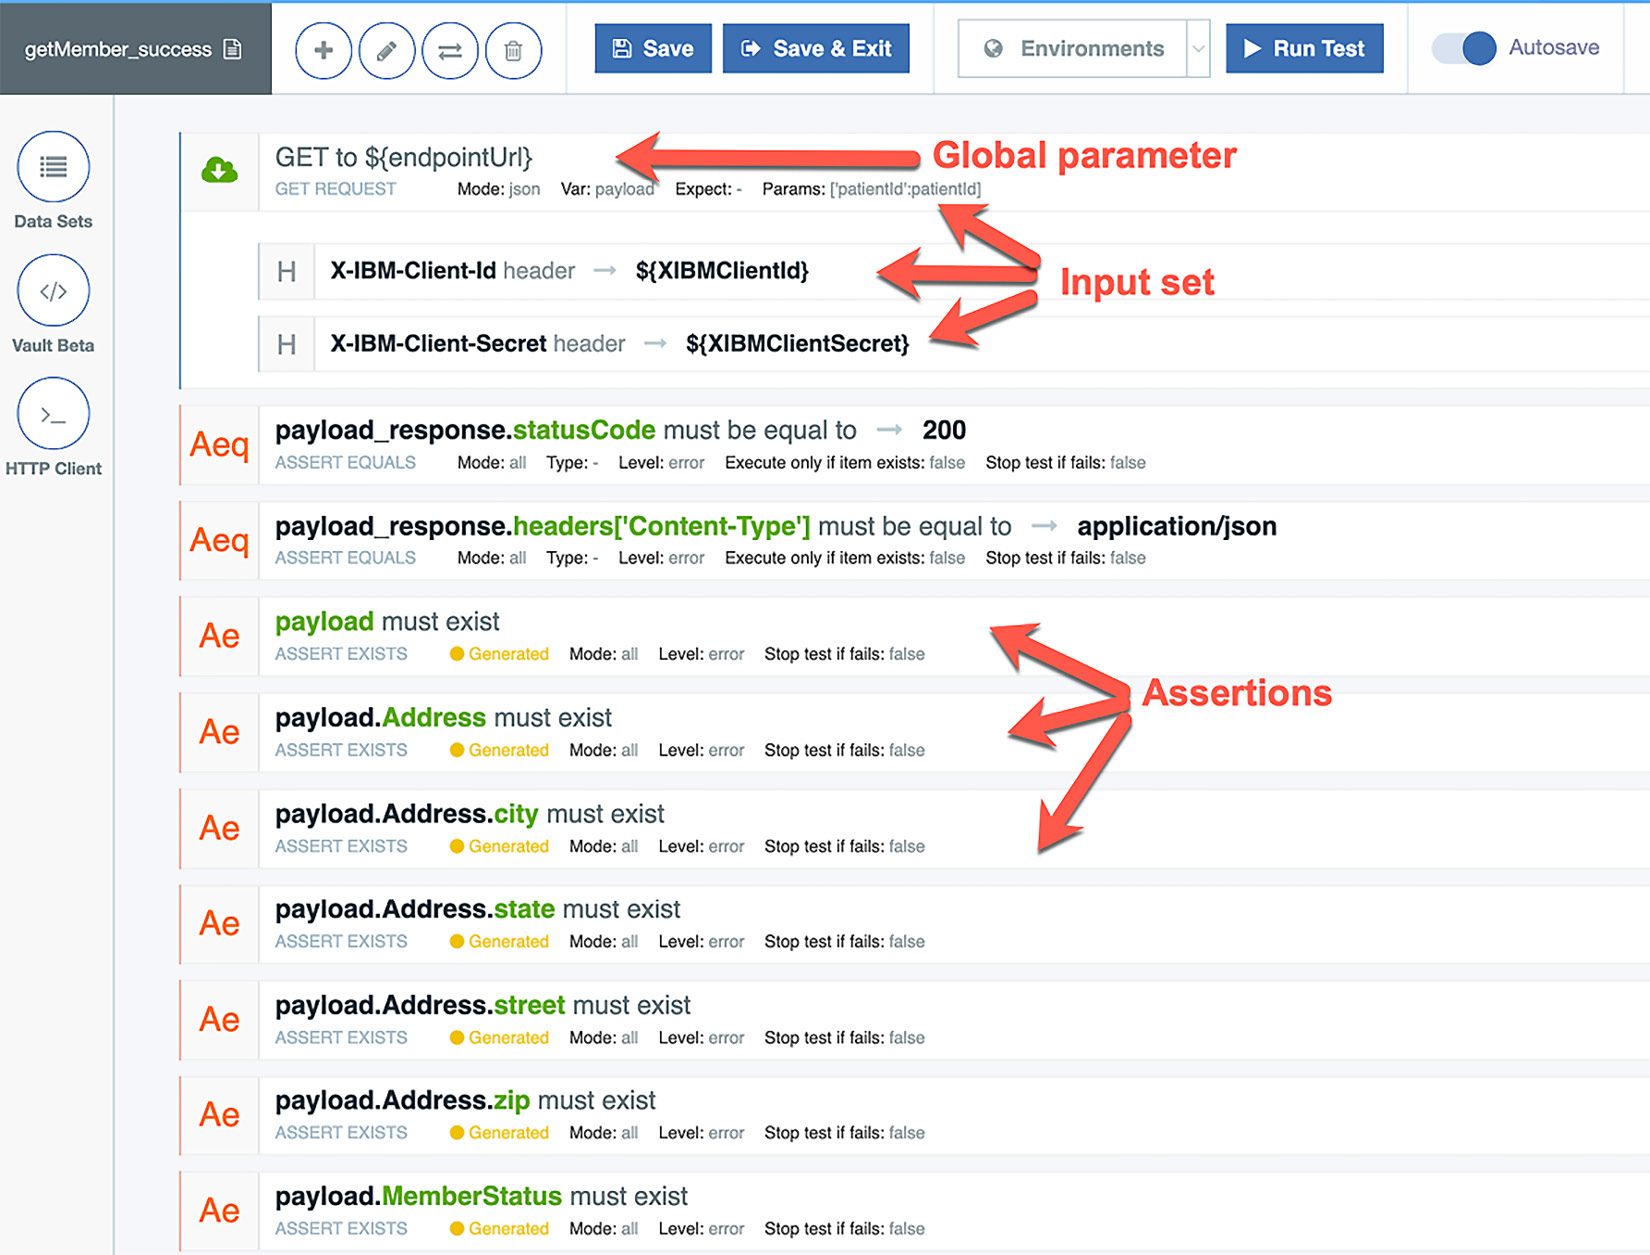
Figure 13.11 – Test case generated for the getMember test case
Clicking the Save & Exit button and then confirming that you want to save and exit will save your test case to your Test Suite and return you to a different screen. This will show some interesting information and options for your test case, as shown in the following screenshot:

Figure 13.12 – Test case status screen
By taking a look at the test case status screen, you can quickly gather some good information about the status of your new test case. The first thing you might notice in the largest portion of the screen at the top is that your new test case is live and has never run. Below that, you will see that you have two versions of your test case. You will have a Working Copy and a Published Version. Working Copy is the copy that you are editing. Once published, it becomes the Published Version type of this test case, which is executed either manually or by an API hook, as you will see in Chapter 14, Building Pipelines for API Connect. To publish your working copy, you must click the Publish button on this screen. Using the corresponding buttons on this screen, you can also perform other actions, such as editing or deleting the test case, building the test case from an API specification, or clearing your working copy.
So far, you have seen how to generate a new test case from the HTTP Client screen using a sample request and response and how to let the tool generate the test case based on the response. There are several other ways to generate test cases within the test and monitor tool, many of which are wizard-driven and intuitive. To explore these additional methods, you can click the API Management Test APIs link from the top navigation bar; it should be visible from any screen within the tool. This will bring you to the home screen, which will show all of your current projects, along with information about how many test cases are within them, how many tests were run, success versus failures, and so on:
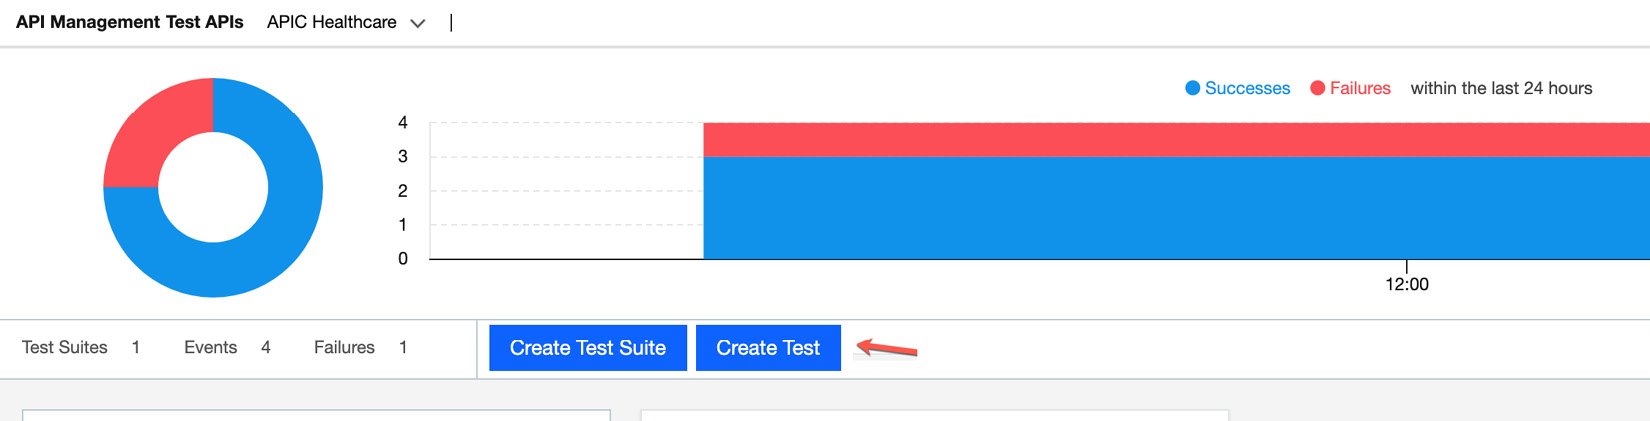
Figure 13.13 – Test APIs screen
Clicking on the Create Test button from this screen will start the process of creating a new test case using one of the available methods, as follows:
- You will be prompted to select an existing Test Suite to save your test case in. Select your Test Suite and click the checkmark button at the top right.
- Enter your test case's name, description, and any tags you might want to add to it for searchability and click the checkmark button.
- The next screen should look familiar to you as it shows all of the information about your test case. Since you haven't configured anything for it yet, it will show as incomplete. Click the Edit button to start configuring your test case.
- The next screen you will see is where things get interesting. You will see three different options for creating your new test case, as shown in the following screenshot:

Figure 13.14 – Options for creating a new test case
In addition to the three available options for creating a new test case, you can click the right and left arrows to go through a tutorial on the different screens for creating your new API.
- The three options you have to create your test case are as follows:
- Quick start from an API call: Generate a test automatically by submitting a request to an existing API. This is the same method you saw earlier using the HTTP Client to generate your test case. With this option, you can select previous requests you have made within the tool.
- Quick start from an example unit: This option will guide you through an example unit test. From this example test, you can alter the request URL, headers, assertions, and so on to customize your test case.
- I got this, let's start from scratch: This option provides a blank palette and provides the most options and flexibility for creating your test case. Selecting this option and then the Add Request/Assertions button will reveal an extensive pallet of options for building your test case, as shown in the following screenshot. As you can see, these options look similar to the options in the assembly screen, when you're creating your actual API and providing various logical decisions and connectivity components:

Figure 13.15 – Manual test creation Request/Assertions palette
As you can see, the test and monitoring tool provides you with several ways to generate your test cases. You can choose to have it create it for you or take total control and build it from scratch using any of the options provided to generate a robust test case. No matter which way you choose to initially create your test case, you can customize it to suit your needs once it has been generated.
Once you have generated your test case, you will want to run it to test it out and then continue to test the API it runs against. To view and run your test case, you can click the API Management Test APIs link at the top left of the main navigation bar to reveal all of your configured projects. Clicking the Tests button within your Test Suite will bring you to a list of all of the tests within that project. From this screen, you can run your test case by clicking the play button to the right of it, as shown in the following screenshot. Once you have executed the test case, you will see the run results to the right of it:

Figure 13.16 – Running the test case
As you can see, we ran our new test case, which succeeded.
Although we executed the test case from the test case screen, you didn't get much information about the test results themselves. To reveal all of the details of your test case run, you can click the See report document link in the results section. Clicking this will show the full report of the test case's run, including how many assertions passed, how many failed, latency, HTTP response code, and more. From this report, you can also view the actual request details, including request URL and HTTP headers.
In this section, you saw how easy it is to configure robust test cases to test your APIs. These repeatable tests will certainly provide the scope and breadth of your testing for when you're making any changes to your APIs. Of course, as you move your APIs through your software development life cycle (SDLC) environments, the test case parameters within your test cases will change. In the next section, you will learn how to configure your test cases so that they can be utilized in every environment, without the need to make changes to the test cases themselves.
Working with environments
As you may recall from when you created your new test case, the test and monitor tool generated some global parameters and an input set. These come in handy when you need to submit the same test case against a new version or environment for an API where the URL, client ID, and client secret would change. You can pass in different values for these global parameters when executing a manual test run by navigating to the edit test case screen for your test case and clicking the Data sets button from the left navigation menu. The following screenshot shows our getMember_success test case's Data Sets, along with its GLOBAL PARAMETERS and the dataset. From here, you can modify or delete a parameter, or even add additional parameters:

Figure 13.17 – Viewing and modifying parameters
Even with the ability to modify the test case parameters manually, it would still be cumbersome to have to change them each time you want to submit your test case to a new environment. To address this concern, the test and monitor tool lets you create environments. Just as it sounds, an environment is a separate configuration where you can configure new values for each environment and save them appropriately. This way, the same test case can be submitted by simply selecting the environment that you wish to run it for.
To create and configure your environments, from the test case editor, click the Environments dropdown at the top of the page and click on Open Presets Editor, as shown in the following screenshot:

Figure 13.18 – Open Presets Editor
You will then be presented with a configuration screen where you can add your global parameters and values for the environment you are configuring for. Let's take a look back at the first test case that we configured; that is, getMember_success. As you may recall, when we had this test case automatically generated for us, it generated a global variable named endpointUrl for the request URL, as well as the XIBMClientId and XIBMClientSecret variables for the client ID and client secret headers. Since these are the variables that will be changed for each environment, these are the key/value pairs we want in our environment configuration. The following screenshot shows three key/value pairs for our development environment to help us resolve our endpointURL, XIBMCLientid, and XIBMClient secret parameters to the values for this environment:
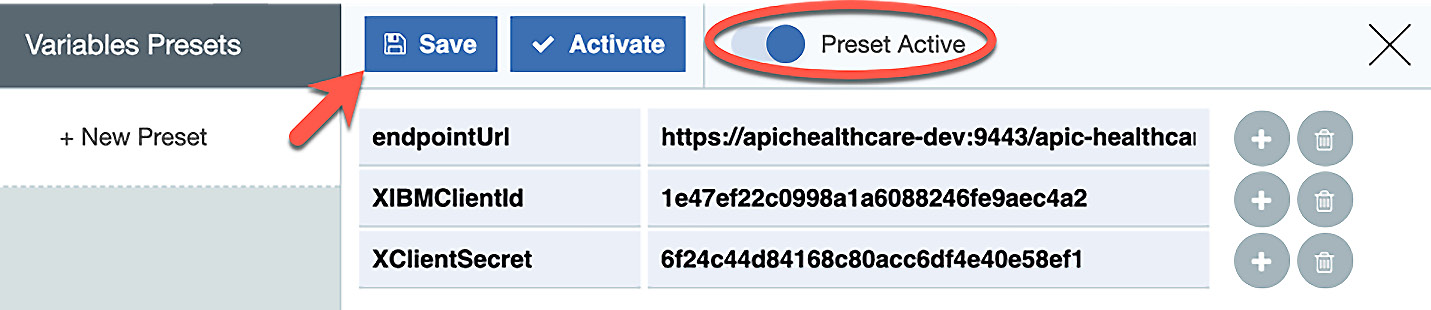
Figure 13.19 – Development environment configuration
To activate and save this configuration, click the Preset Active slider and then the Save button. You will be prompted to provide a name for this environment configuration, where you can enter a meaningful name to represent the environment that this configuration corresponds to. The following screenshot shows us naming our new environment configuration DEV. Clicking the checkmark icon in the top-right corner will save the current configuration:

Figure 13.20 – Saving the DEV environment configuration
Now that you have configured, activated, and saved your environment configuration, you can submit a new run for your existing test case by selecting this environment configuration from the Environments dropdown. The following screenshot shows the new DEV environment selected to be used for the next run of this test. Executing the test will replace the environment variables with the values provided in the DEV environment configuration before execution:
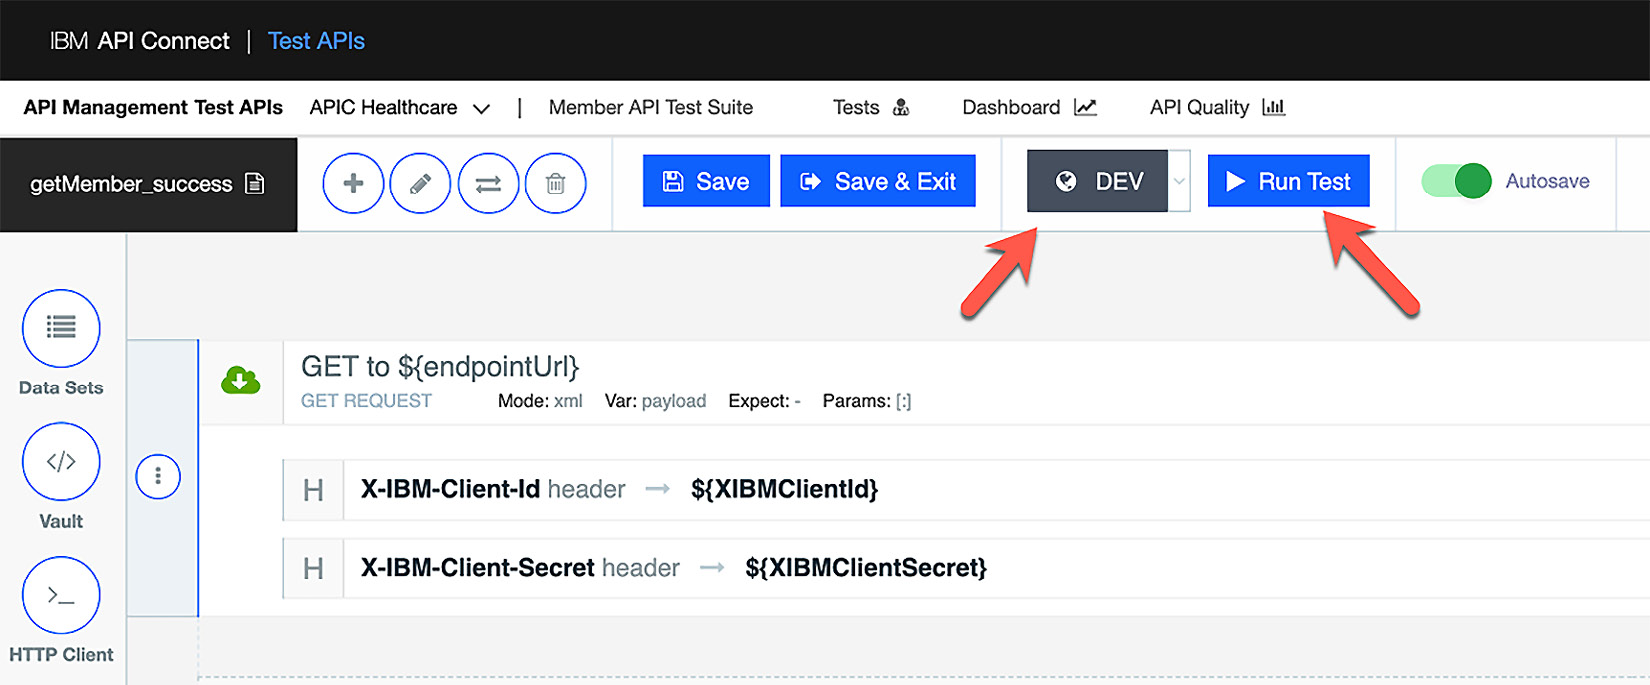
Figure 13.21 – Executing the test case using the DEV environment configuration
As you can see, you can configure a new environment configuration for each of your environments, which lets you execute the same test case against multiple environments. This eliminates the need to maintain multiple versions of your test cases to accommodate all of your different environments.
With that, you have learned how to configure and execute your test cases for your APIs across multiple environments. Whether these tests run in an automated fashion, manually, or as part of your DevOps pipeline, if no one looks at the results, then what good is it? You know what they say – "If a tree falls in the woods and no one is around to hear it, did it make a sound?" Now, let's learn how to view historical results as all of your test cases run.
Monitoring the test cases
So far, we have spent all of our time discussing creating and executing our test cases. You might be thinking, where is the monitoring piece of this test and monitor tool?, and that would be a fair question, considering the name of the tool itself. To answer this question, let's take a look at the available features that allow us to monitor the execution of our test cases.
The test and monitor tool provides several different views you can use to gather historical data on the execution of your test cases. To get a high-level view of how your test cases are doing, you can click the API Management Test APIs link at the top of any page within the tool. This will bring you to a single screen where you can glean quite a bit of information on the overall performance of your test cases within your provider organization. The following screenshot shows this high-level screen for our APIC Healthcare provider organization:
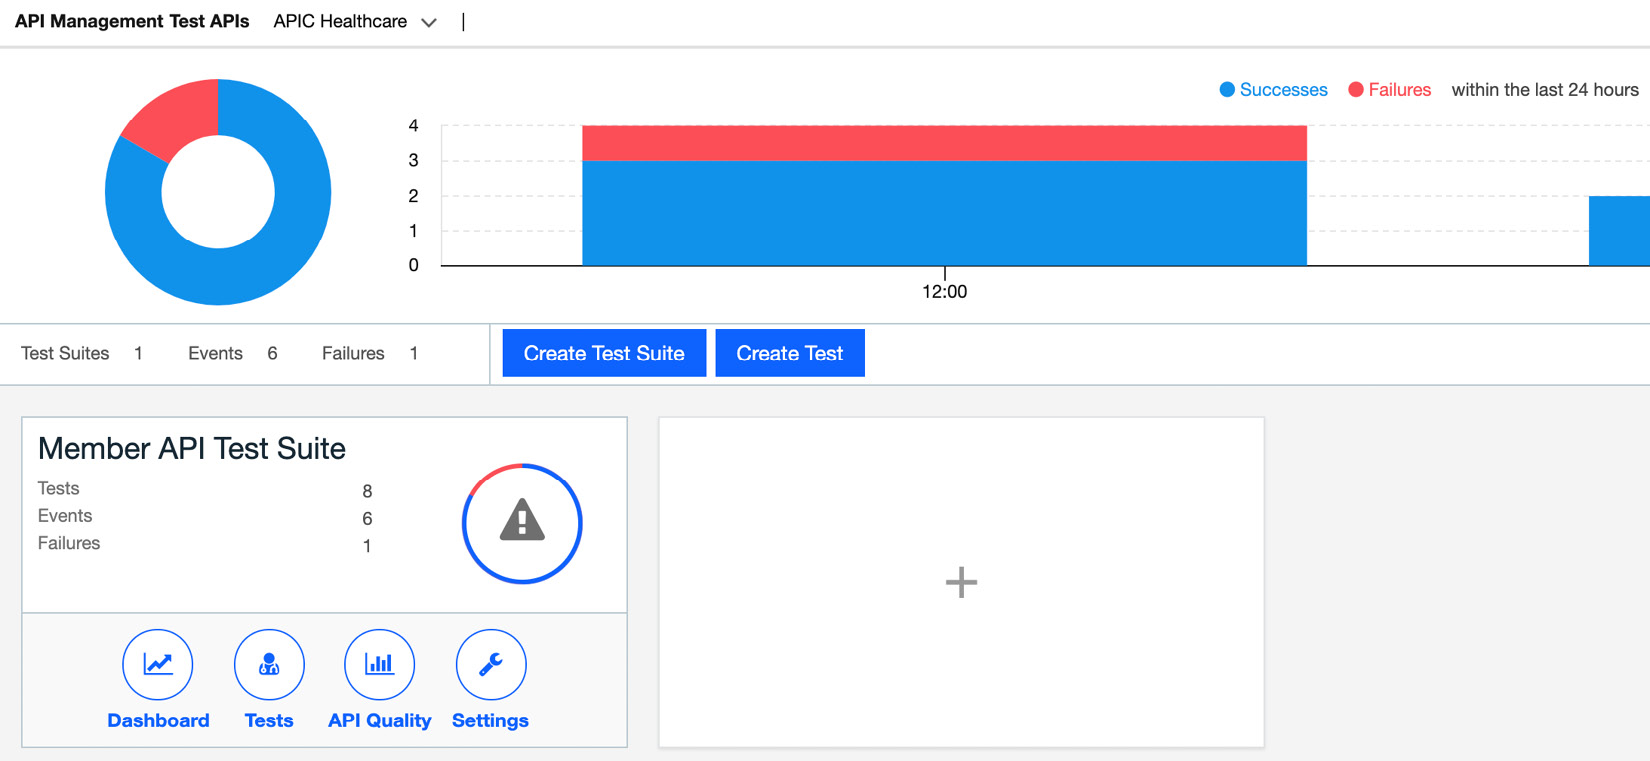
Figure 13.22 – The APIC Healthcare test case's status
Looking at our provider organization test API screen, the first thing you might notice is the large area stretching across the top of the entire screen. Here, you can see an overall success/failure chart for all of your test cases within the last 24 hours. By quickly looking at this, we can immediately tell that some of our test cases require immediate attention. Below this chart, you can see the number of Test suites, Events, and Failures.
Moving further down this page, you can see all of the Test Suites that you have created, along with the number of test cases created within, the total number of events for them, and the total number of failures. In our example, you can see that we only have one project configured consisting of three test cases. To drill down and get a closer look at the performance of your test cases within the project, you can click the API Quality button within the Test Suite. This will present a screen showing a breakdown of each test case's successes and failures for a given month, as shown in the following screenshot:
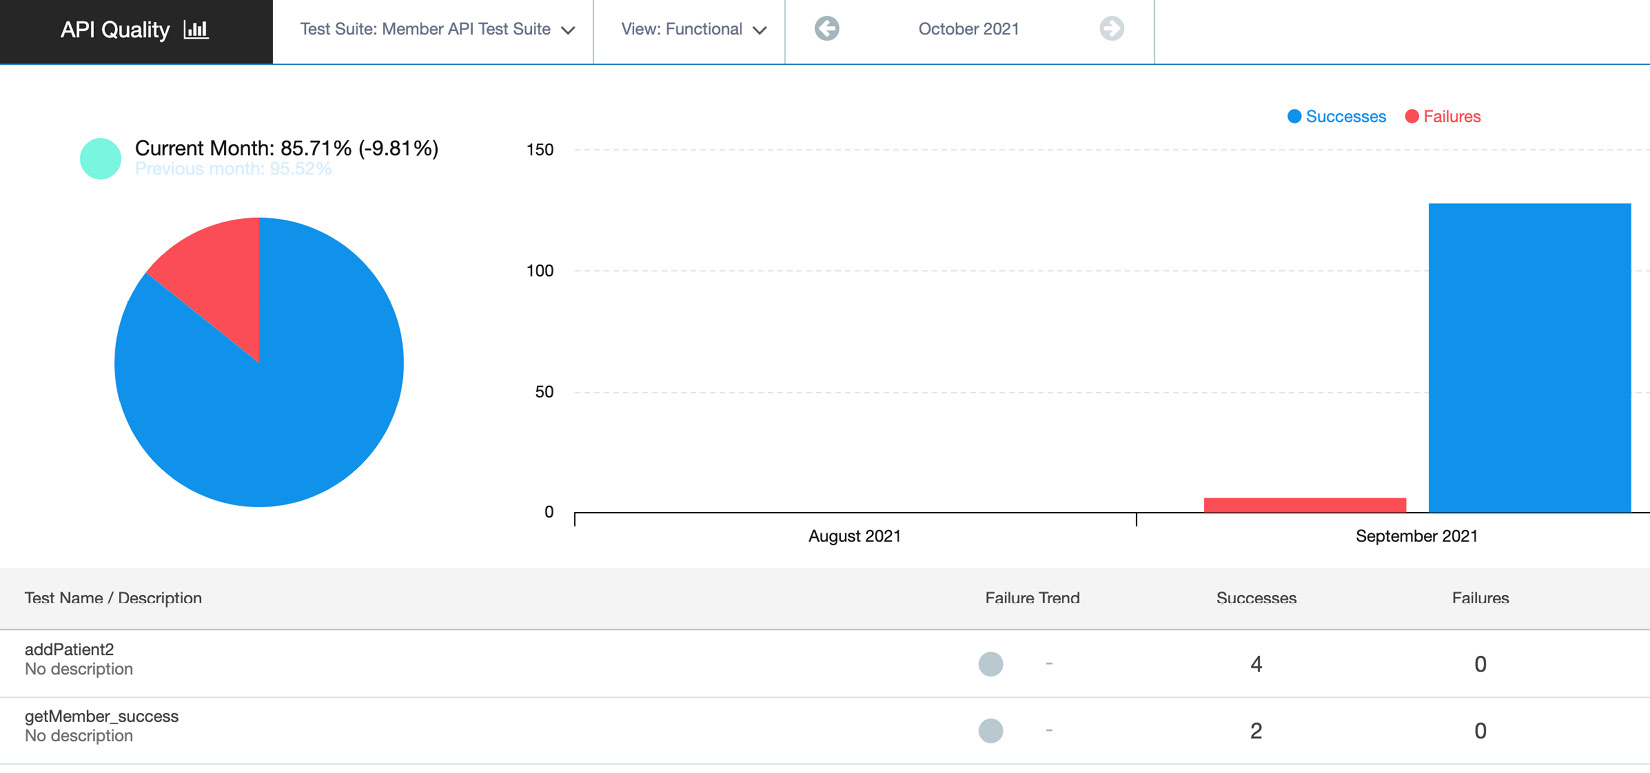
Figure 13.23 – API Quality
Here, you can start to get a better picture of where our failures are occurring. You can view the previous month's data by selecting a different month at the top of the screen.
From what you have seen on the previous two screens, you were able to identify your test case success versus failure ratio at a high level and drill down view this breakdown by test case within a project. From here, you will likely want to drill down into these test case executions even more, which will help you identify what was causing the failed test cases. For this, you can use the dashboard. You can navigate to the dashboard from the home screen by clicking the Dashboard button within the Test Suite, or you can get there from the API Quality screen by clicking the Dashboard icon, which can be found in the top main navigation menu.
Once you navigate to the dashboard, it should become evident that there is a lot of information contained within one screen with several ways to filter and view it. The following screenshot shows the initial view of the Dashboard area when you navigate to it:
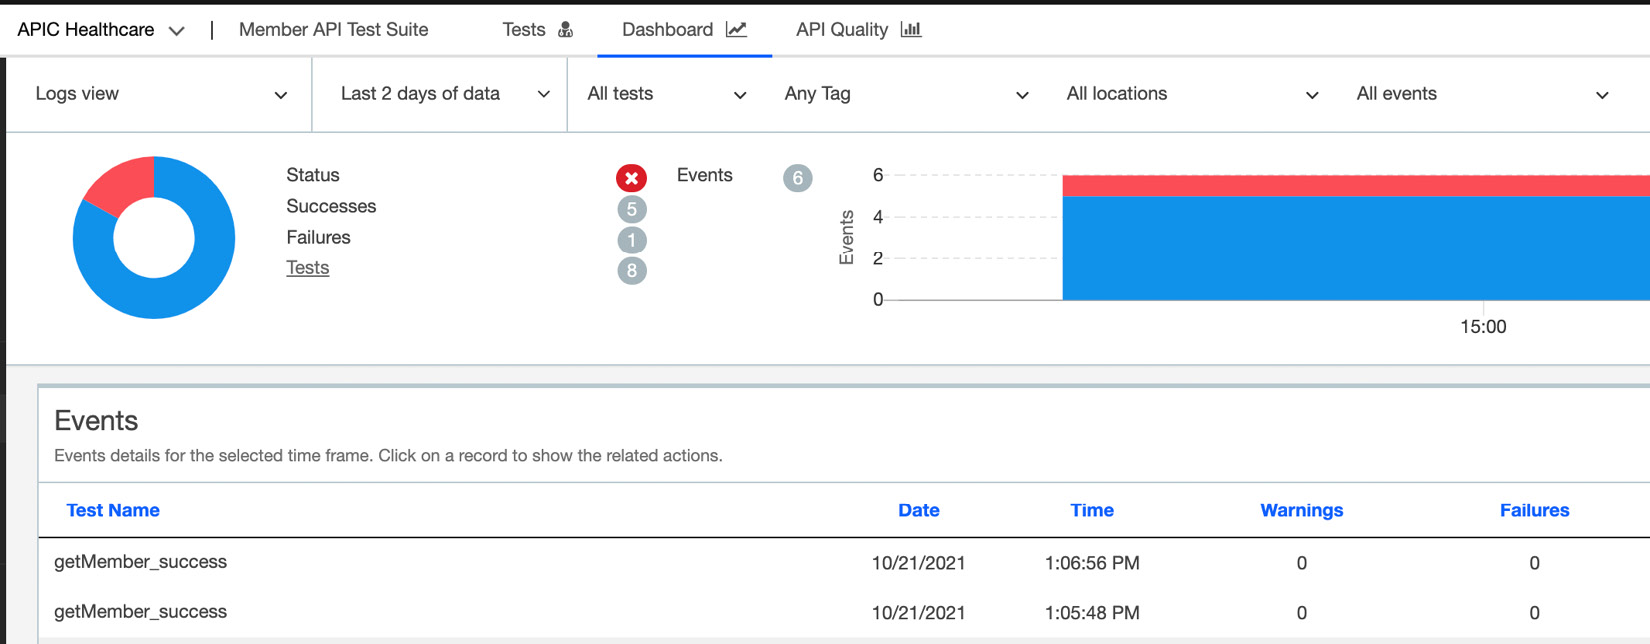
Figure 13.24 – Dashboard default view
At first glance, you will notice the familiar chart running across the top of the screen showing the number of successes, failures, and tests for the time selected. The default time that's selected is the last 2 days. Above this chart, you will see all of the options available to filter this data down. You can filter by date range, test case, tags configured in a test case, the location the test was initiated from, and events (all events or failures).
Moving along to the main body of this page, you can see each test case that's been submitted that matches the filtered criteria. Each test case execution will show the date and time submitted, the number of warnings and failures, the submitted location, and the status of the test run. Clicking on an individual test case run will provide the options to delete the entry, provide a public link to it, or view the execution report document. Within this document, you can see specific details about the execution, including the request URL, request header, and the request itself. You will also see response latency, any failures, and the overall test results. When troubleshooting test case failures, this report could prove to be your best asset in diagnosing the problem.
The sole purpose of generating test cases is to check the health of your APIs. As you generate your test cases and time goes by, these test cases should be run not only after publishing a new API but regularly to ensure the health of all of your APIs. If you don't monitor these test results properly, they won't provide much value. As you have seen, the test and monitor tool lets you track historical test case execution data, which is critical to detecting and analyzing your API failures.
Summary
Keeping your API environment healthy is critical to the success of your digital transformation. Detecting such issues early could help mitigate the damage that's done by such issues. Whether you use your test cases in your unit test environment as you develop or utilize them as continuous health checks, creating robust, repeatable test cases that provide full coverage of all the functionality of your APIs can ensure that your efficient time to market efforts do not come at a cost.
In this chapter, you learned how to utilize the built-in test and monitoring tool to generate robust test cases as you develop your APIs in a way that they can be used in each environment. Having such a tool at your disposal can significantly improve your development and deployment efficiency by keeping quality at the forefront. Although we have covered a lot of material within this chapter, there is more to discover within this testing tool. It would certainly behoove you to dig even deeper into all of the features provided by the test and monitor tool. Its robust feature set and flexibility will provide you with all of the tools you might need to keep your environment healthy.
In the next chapter, you will expand on this even further by learning how this can be integrated into your DevOps pipeline.