Chapter 10
MEASURING AND REPORTING
There are numerous entry points into the world of giving. Many businesses will start with cash donations, perhaps supporting their staff with an annual day off to volunteer. Not unlike most investments, the more time you devote to understanding the area, the more intelligent and mature your investment becomes. As the significance of the investment grows so does the desire to measure and report on that investment.
There are many options when it comes to measuring and reporting in this area. The simplest form of measurement is aligned to the simplest form of giving. If your engagement is limited to the donation of a sum of money, then the reporting too is that simple. At the end of the financial year the company carves off $50 000, which it gives to one or many charities or causes. The reporting will amount to a line on the balance sheet that records that transaction. There may be an article in the internal newsletter or a feature story on the intranet, but often that is the sum total of the reporting.
When the engagement becomes more mature, so too does the giving. Nick Dowling, CEO of the Jellis Craig Group, comments, ‘As a commercial business it would be easier from a time perspective just to channel off a portion of the share of profits that we make every year and feel good about it’. This had indeed been the previous model of CSR strategy adopted by Jellis Craig, when the give was measured by the cash it had raised and donated to its charity partners. There was no acknowledgement of the dedication of resources in the management of its position. Nick knew that when the company took on fundraising activities, the bulk of the load was carried by head office staff.
But Jellis Craig made the decision that simply channeling off a share of the profit was not going to bring the level of engagement they were looking for. In the development of their strategy they looked beyond the donation of funds to a commitment that included:
- formation of a legal entity within the group
- establishment of a foundation committee
- commitment to various community-based activities, such as:
- – Field of Women BCNA
- – Run Melbourne
- – Hands Across the Water bike ride
- – Red Cross blood donations.
The resources it commits to its program of giving quickly heads towards matching the level of cash it is providing. So how should this be reflected in the annual report it prepares for its stakeholders at the end of year? Should it simply record the amount of money it donates or should the allocation of resources towards ensuring the programs are a success be included as well?
Optus’s contribution to the community in pure dollar terms through community support initiatives such as direct cash funding, in-kind support, leverage, customer initiatives, staff time and workplace giving was reported in its 2014 sustainability report as $9.7 million, with direct grants reported as just $300 000.
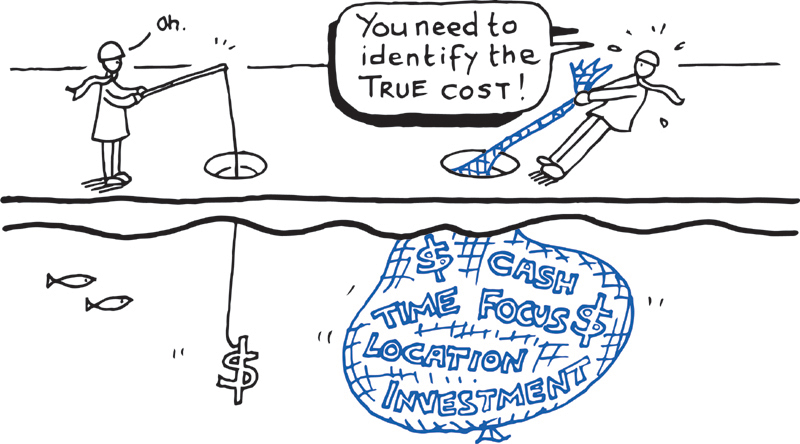
Is Optus right in including all of the costs, in-kind support and staff time it allocates to ensuring the program is a success? Of course it is. Failure to identify the true costs of the program not only would be wrong on an accounting basis but would make the accurate measurement of success or failure impossible. Whatever the business, when determining the true cost of doing business you don’t not include the non-sales areas that don’t generate a profit. It only makes sense to identify and report accurately the true cost of your CSR platform, not just the dollar contribution that reaches your partners.
When I talk with prospective clients about their CSR strategy I tell them, ‘If your CSR strategy is not a profit centre for your business, it is not as effective as it can be’. To determine whether or not the strategy is a profit centre, we have to know the true cost of executing the strategy.
The past 20 years has seen the emergence of groups who have set about measuring and reporting on the effectiveness of CSR programs by business. At the same time there is an increasing awareness of the effectiveness of programs beyond giving cash and how they are good for business.
Benchmarking and measuring
In 1994 LBG (formerly London Benchmarking Group) developed a model for measuring and reporting the value of community investment by businesses. This model is now used by more than 300 companies around the world. It has around 50 members in Australia and New Zealand, including Optus, NAB, Myer, Medibank and many others.
The LBG chapter in the Australia–New Zealand region is supported by a small administrative team. The lifeblood of the chapter is the Steering Committee, which is made up of members from industry who are committed to growing the model of measuring and reporting their community investment.
Models and reporting from organisations such as LBG become a richer and more factual representation of the entire community investment as their membership base grows. The Steering Committee is very aware of this, which is why growing the membership base falls within its ambit. Currently the membership is diverse as it is large, with less traditional and certainly smaller organisations, whose strategies around community investment are less mature, enter the group. Businesses just entering the space of community investment, or whose involvement is limited to financial donations, may not at first see the value in measuring and reporting their investment, or will see their investment simply in terms of the sum total of the dollars they give away.
LBG utilises a framework for measuring the inputs, outputs and the impact made as a result of an organisation’s contribution (see figure 10.1, overleaf).
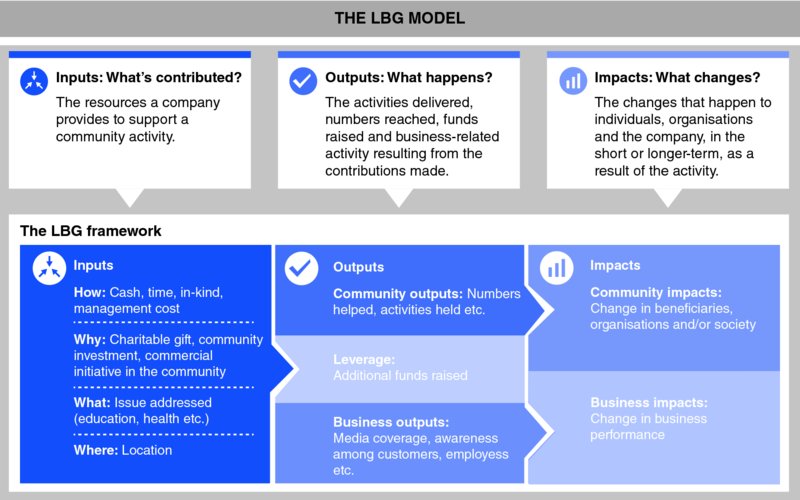
Figure 10.1: the London Benchmarking Group’s measuring model Reproduced with permission from LBG Australia & New Zealand (http://www.lbg-australia.com)
LBG effectively measures inputs — whatever has been contributed, including cash, time, in-kind support and, importantly, the management costs of maintaining a CSR program. Members of the LBG community have an average of 4.5 full time employees working within their various community engagement programs. This figure relates mainly to the larger corporate entities with the capacity to allocate a head count to their CSR initiatives.
Outputs refers to what is delivered in terms of how many are reached, how many are involved and what types of activities are run. An organisation would report on the hard evidence of the program. It is not about the success or change that resulted, but about how many were affected in a measurable way.
Impacts seeks to measure the changes achieved as a result of the program — what difference was made, not just on the receiver but importantly on the business itself. Has the program produced measurable employee development opportunities? Has there been a change in customer loyalty as a result of the program? Can new clients or customers be attributed to the program? It is often too easy to focus on the measurement of the success for the end user and miss the opportunity to measure the success of the program internally. Conversely, has the program consumed more resources than anticipated with more limited benefits to the end user, so that the program is not deemed to be worth duplicating in its current format? These types of judgements can be made only when all of the information is measured and reported.
A priority for LBG has been to assist its membership move from a focus on what is contributed in the form of inputs to really consider their outputs and, most importantly, the impact their programs are having. Navigating this is a challenge as the impact is so much more difficult to measure than something solid such as ‘we contributed $250 000 last year’, but when an understanding is gained of the impact, the gap between philanthropy and shared value is increasingly diminished.
The Optus student2student program offers a good illustration of the LBG model of measuring inputs, outputs and impacts (see illustration overleaf).

The resources that Optus committed to the student2student program included the gift to each student of a handset. As the program expanded from the initial pilot of 50 student pairs, Optus staff and family members were invited into the program as reading mentors. Also included were the administrative resources from Optus to develop, research and execute the program. In addition it provided training to each student in the responsible use of a mobile phone.
The outputs are measured in the numbers of students who have passed through the 18-week program, with 525 reading pairs participating nationally. An accurate total would far exceed this when including those who have been made aware of the program through family, teachers and other students both as mentors and mentees.
Ninety-three per cent of students improved their reading age and 96 per cent of parents noted improvements in their child’s reading. That is a clear, measurable outcome. Added to that was the experience shared by the staff and their families, which on anecdotal evidence was enriching for all involved. Through the education programs it attached to the rollout of the handsets, Optus was able to provide new mobile phone owners with important practical tips on how to effectively manage the credit attached to these phones. For the disadvantaged communities in which it was working, the importance of these lessons should not be underestimated.
The student2student program could readily be measured in terms of the input of resources such as hardware and time against the outputs and impacts of numbers involved and improvement to literacy standards. But is that a true measure of the reach of the program? For example, how many of the following may have been areas of real impact?
- What was the change in view of the children of Optus staff involved in the program on how a corporate interacts with the community?
- How many of these children have had a chance to participate with their parents in ‘giving’ in a currency other than money?
- Do Optus staff who have been involved in the program feel greater loyalty to their employer for creating an experience they could share with their children?
- Do the staff have an increased sense of pride in the company they work for?
- How many of their children have an increased loyalty to the brand as a result of their exposure?
- How many of the children from disadvantaged communities were introduced to a brand and have become new customers?
- Was there any positive press coverage of the program?
- Was there any improvement in business-to-business relationships on the back of this program?
- It was reported that 93 per cent of students enjoyed improvements to their reading age but what of the impact of that improvement on their schooling, subsequent employment opportunities and even diversion rates from the criminal justice system?
The Optus student2student case study illustrates the kinds of areas that may or may not be recorded, and the difficulty in trying to measure the total impact of a CSR program. If measurement of the impact is based on knowns and unknowns, what of the way resources or contributions are made?
One of the most effective pieces of analysis LBG provides is a breakdown of how its members contribute. It has been collecting data since 2006 and eight years of reporting has revealed marked consistencies in contribution.
As shown in figure 10.2, it measures contribution in four areas:
- cash
- time
- in-kind
- management costs.
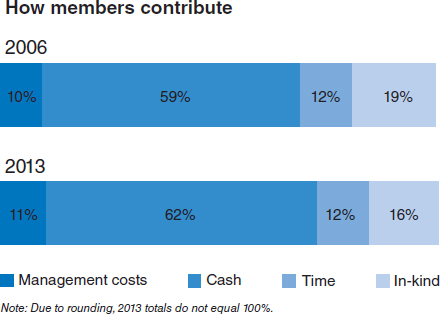
Figure 10.2 LBG analysis of CSR contribution — comparison over time
What the figures demonstrate is that over an eight-year reporting period the distribution over the four areas of measurement remains remarkably consistent. The cash contributions over eight years averages out at 60.25 per cent, while the management costs over the same period average 10.1 per cent.
Two conclusions can be drawn from these figures: first, the management costs in running the CSR programs are significant and need to be accounted for in the corporate contribution; secondly, the cash contribution is very high, and I would predict that over the next five years that figure will fall if those companies participating in the benchmarking remain the same.
This conclusion reflects the shift by those companies who have been involved in this space for some time towards a model of greater shared value. As they progress along the continuum towards fully integrated shared value, their contribution will be aligned less to the cash donated and more to the in-kind support. For example, in the guest-led mentoring program set up by the Sheraton Grande Sukhumvit (as described in the case study in chapter 2), the cash contribution by the hotel to its CSR program is zero, but its leverage and in-kind support is huge.
Optus offers another example: its cash contribution is a mere 3.2 per cent of its total give. As a company develops its maturity in this space the trend is away from direct cash donations and towards a recognition that a greater difference can occur through the leverage brought to the table. More and more, CEOs like Nick Dowling from Jellis Craig appreciate that the true value to the company and indeed to its charity partners is not in the cash given away but in the experiences shared.
Where the change in reporting may not indicate the decrease I predict is among new members of the LBG community who are just entering the CSR space and whose contribution is heavily weighted towards cash donations — because that’s what so many do at the start of their journey.
Reporting indices
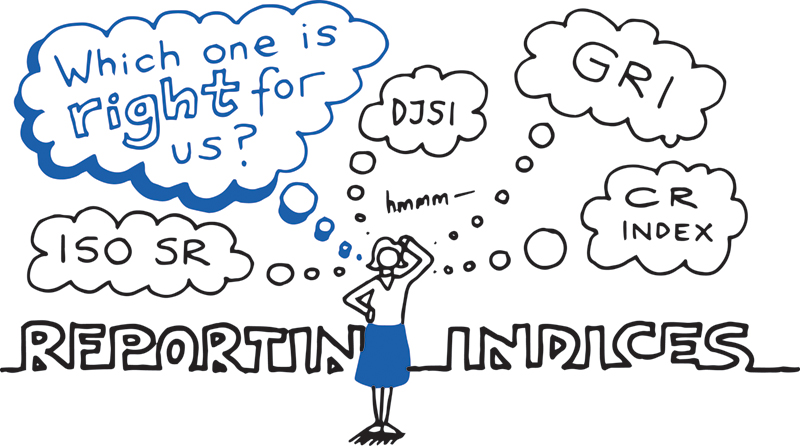
LBG is but one of several reporting indices that allow the measurement, reporting and benchmarking of companies who are involved in CSR beyond corporate philanthropy. Here are some of the other indices that are widely used for benchmarking.
Global Reporting Initiative (GRI)
GRI is an international not-for-profit (its secretariat is based in the Netherlands) with over 600 members worldwide. Founded in the US in 1997 with the core purpose of serving as an environmental reporting agency, its reporting framework has expanded to become more inclusive, providing measures of social, economic and governance issues. The latest framework, G4, was released in 2013.
GRI defines a sustainability report as ‘a report published by a company or organization about the economic, environmental and social impacts caused by its everyday activities’. The framework enables its members to report on the four key areas of sustainability — economic, environmental, social and governance.
GRI is represented in Australia by the GRI Focal Point, which is hosted by the St James Ethics Centre.
More information on GRI is available via its website: www.globalreporting.org.
Corporate Responsibility Index (CR Index)
The CR index, another benchmarking group out of the UK, was formed in 2002. It also has a presence in Australia. Its aim is to help member companies to:
- Identify — gaps for improvement and reinforce good practice
- Track — progress over time and drive continuous improvement
- Benchmark — against peers and leading practice
- Engage — board members and raise awareness internally.
The tools it offers allow companies to measure themselves and report both publicly or privately. The public disclosure allows companies to be included in the annual CR Index ranking, while private participation suits companies who are ‘not ready to disclose their performance’. Companies participating in the CR Index include Unilever, Heineken, and Marks & Spencer.
More information on the CR Index is available via its website: www.bitc.org.uk.
Dow Jones Sustainability Indices (DJSI)
The DJSI, launched in 1999, claims to be the first global sustainability benchmark. It tracks the stock performance of ‘the world’s leading companies in terms of economic, environmental and social criteria … they serve as benchmarks for investors who integrate sustainability considerations into their portfolios, and provide an effective engagement platform for companies who want to adopt sustainable best practices’.
More information on the DJSI is available via its website: www.sustainability-indices.com.
ISO 26000 Social Responsibility
In addition to benchmarking opportunities the International Organisation for Standardization has an ISO for social responsibility, ISO 26000, more commonly known as ISO SR. Unlike many of the ISO standards used to measure or demonstrate compliance and/or certification, ISO SR is ‘intended to provide organisations with guidance concerning social responsibility and can be used as part of public policy activities’. Launched in November 2010, it aims to provide practical guidelines to implement social responsibility, identify and engage stakeholders, and to enhance the credibility of reports and claims made about social responsibility.
While the standard does not allow a user to attach certification, which is the norm with ISO standards, it does allow for self-declaration based on self-assessment and evaluation against the framework of ISO SR. The use of the ISO framework in conjunction with some of the other reporting indices enriches the results and benchmarking capabilities.
ISO SR states that the social responsibility of an organisation is to ensure that its decisions contribute to sustainable development, health and community welfare; consider stakeholder expectations; comply with the law and behavioural norms; and are integrated throughout the organisation.
Organisations using the ISO should follow these principles:
- accountability for the organisation’s impact on society and the environment
- transparency in all decisions and activities that impact on society and the environment
- ethical behaviour at all times
- respect for the organisation’s employees
- acceptance of the law
- respect for international norms of behaviour and for human rights.
Following on from the key principles are the seven core subjects that organisations should focus on:
- organisational governance
- human rights
- labour practices
- environment
- fair operating practices
- consumer issues
- community involvement and development.
The question has to be asked, who benefits from taking your CSR reporting to this level? Will small to medium-sized organisations benefit by implementing these principles, and at what cost? A common view of this type of accreditation is that it is often better to not have it than to not to meet the accreditation standards, or worse still to have met them at one point but to have areas of non-compliance.
So who benefits from standards such as ISO SR? Those most likely to benefit are corporates who are working across international borders and want to demonstrate that their supply chain meets international standards around the labour practices and human rights.
The real effectiveness of the ISO standards and their level of applicability will take time to emerge. Introduced in 2010, it is too early to draw and conclusions on their success, but with the passage of time the demand by those entering into international trade will be the true measure.
How and what to report
A plethora of styles can be adopted in communicating with the key stakeholders on the activities undertaken in the year of reporting. Many of the larger corporates produce their sustainability reports in line with their annual reporting on business, some of which combine both. A lot of these reports focus on inputs and outputs, with fewer focusing on impact. Of those reporting the impact, even fewer take the next step to report on the management costs associated with their programs.
Many of the reports will focus on the cash given, the water saved and the hours devoted by employees. They can be a bit of a chest-thumping exercise and tend to be somewhat vanilla in their offerings. The most engaging reports are those that tell the stories of how it has impacted on the lives of those in the community who have benefited. For most readers, a reduction in greenhouse emissions or the fact that 5392 employees were involved in a day of volunteering doesn’t bring a lot of excitement. How about reporting on the experience of two of the volunteers — how they spent their day and the names of those they helped? Statistics and figures aren’t all that exciting unless you are an actuary; stories are what people want to hear.

The stakeholders who are likely to be interested readers will include:
- customers
- employees
- consumers
- investors
- business partners
- government agencies
- non-profit organisations
- the general community.
Each will probably have a different bias towards the information they are seeking, which will fall under a number of broader themes:
People
- workplace diversity
- targeted employment practices
- employee resource assistance
- focus on health and welfare
Giving — corporate/employee
- total cash given by way of direct funding
- employee contributions in time and money
- employee volunteer hours, matched or otherwise
- in-kind support
- leverage
Environmental
- reduction in use of water and non-renewable energy
- landfill avoidance
- reduction in greenhouse gas emissions
- investment in environmentally sustainable buildings and manufacturing
- logistics and fleet
Supply chain
- sourced from sustainable operations
- compliant with human rights standards
- compliant with accepted labour practices.
Voluntary reporting
Unlike financial reporting for companies, which is mandatory at the end of the financial year, reporting on activities around CSR programs remains voluntary. Those that do report on the environmental and social activities do so without set reporting criteria and can choose what they include and what they don’t.
There are a number of obstacles to full and frank reporting by business. Simon Robinson, a director with LBG in Australia–New Zealand, notes the following impediments to the type of reporting that might otherwise be possible:
- Many businesses still view their CSR work as charity so don’t apply the same rigour as they do to other areas of their business.
- There is a lack of executive leadership across corporate Australia promoting the necessity of reporting and the value of community investment to business and communities.
- In part because of this lack of leadership at the most senior levels, business generally doesn’t commit the resources required.
- Business struggles to measure the impact its programs are having.
- Existing methodologies to assess impacts can often be too complex and too expensive.
Research conducted by the Centre for Corporate Public on behalf of LBG Australia found that one of the main obstacles to impact assessment is a lack of clear intent behind why companies start their community investment work and what they hope to gain from it. Very few companies are measuring and reporting on their impact.
Without clear guidelines or reporting criteria, corporates can set their own measures and report as they choose. This raises the risk that the data relating to community in sustainability reports they issue at the end of their reporting cycle become more of a PR document, which may throw into question the authenticity of their entire program.
The number of benchmarking groups and measuring indices like LBG is growing. Progress in this area is being impeded not so much by a lack of agencies that are there to measure and report, but by a lack of desire by business to engage in meaningful and measured reporting.
Compulsory reporting
The state of California, in the US, may very well be the first legislature to bring into law compulsory reporting connected to CSR. On 1 January 2012 the California Transparency in Supply Chains Act 2010 (also known as Senate Bill 657 or SB 657) was enacted.
The legislation that was enacted in 2012 applies to retailers and manufacturers who have gross annual receipts that exceed $100 million. The purpose of the legislation is to require retailers and manufacturers to disclose their efforts to eradicate slavery and human trafficking from their supply chain. A condition of the act is that the retailers and manufacturers who fit within the requirement of the legislation provide their customers with information concerning their supply chain and those who contribute to the manufacture of the goods. Effectively, the legislation is forcing the retailers and manufacturers to disclose to the end customer where the goods they are buying are made, where the materials are sourced and who has contributed to the manufacturing process. It is giving the customers the information that they may seek to make informed purchasing decisions.
One outcome of SB 657 has been the resource KnowTheChain, whose purpose is, with a number of partner organisations, to analyse and measure the companies within California who are affected by the legislation and to report on their compliance. It has evaluated 500 retail or manufacturing corporations on whom the legislation impacts and holds the reports of those companies on its website. It doesn’t advocate for those who are reporting and complying with the requirements of SB 657, nor does it call on the public to boycott those who have not complied. It simply brings the information together in one place to promote discussion and awareness.
Compulsory reporting in accordance with SB 657 is a huge step towards putting the information in the public domain and allowing informed decisions by customers. Some of the companies reported on the KnowTheChain website as not complying make broad, sweeping statements about how they support equality and the good for all. You can almost see the company spokesman reading this statement, a cape across his shoulders, gazing heroically into the distance.
In its statement posted on the KnowTheChain website, Apple was more specific when outlining its activity. For example, ‘In addition to regularly scheduled audits, we conduct a number of surprise audits during which our team visits a supplier unannounced and insists on inspecting the facility within an hour of arrival. We conducted 28 of these surprise audits in 2012. During our regular audits, we may also ask a supplier to immediately show us portions of a facility that are not scheduled for review.’
Lodging such a statement doesn’t mean Apple doesn’t have a case to answer or that mention of these audits should necessarily persuade us that it is in compliance across the globe, but it does give evidence of the work it is doing.
