
SQL Server 2005 consists of a number of integrated components, as shown in Figure 2-1. When you run the SQL Server installation program on a server, you can choose which of these services to install. We focus on those components relevant to a BI solution, but SQL Server also includes all the services required for building all kinds of secure, reliable, and robust data-centric applications.
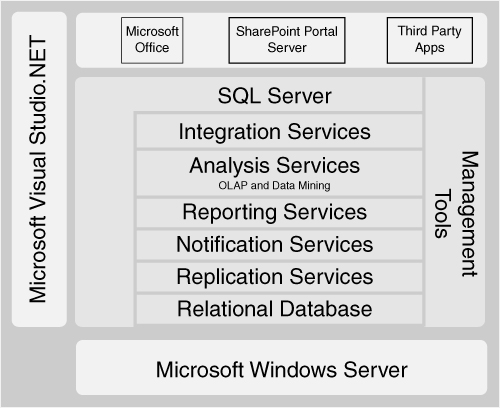
SQL Server includes two complementary environments for developing and managing BI solutions. SQL Server Management Studio replaces both Enterprise Manager and Query Analyzer used in SQL Server 2000. SQL Server Management Studio enables you to administer all the aspects of solutions within a single management environment. Administrators can manage many different servers in the same place, including the database engine, Analysis Services, Integration Services, and Reporting Services components. A powerful feature of the Management Studio is that every command that an administrator performs using the tool can also be saved as a script for future use.
For developing solutions, BI developers can use the new Business Intelligence Development Studio. This is a single, rich environment for building Analysis Services cubes and data mining structures, Integration Services packages, and for designing reports. BI Development Studio is built on top of the Visual Studio technology, so it integrates well with existing tools such as source control repositories.
You can decide where you would like to install the SQL Server components based on the particular environment into which they are deployed. The installation program makes it easy to pick which services you want to install on a server, and you can configure them at the same time.
In a large solution supporting thousands of users with a significantly sized data warehouse, you could decide to have one server running the database engine to store the data warehouse, another server running Analysis Services and Integration Services, and several servers all running Reporting Services. Each of these servers would, of course, need to be licensed for SQL Server, because a single server license does not allow you to run the various components on separate machines.
Figure 2-2 shows how these components fit together to create an environment to support your BI solution.
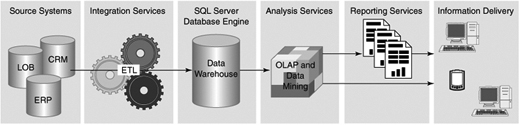
The SQL Server 2005 database engine is the service that provides support for relational databases. It is a highly reliable, available, and scalable database server. As shown in Figure 2-2, its primary role in BI solutions is to be the long-term authoritative data store for enterprise data from which Analysis Services will build OLAP databases and cubes.
Usually a single server machine runs a single instance of the database engine, but each server can be configured to run more than one instance of the database engine at the same time if necessary. Each instance has its own completely separate set of databases and tables. It is usually better to have a single instance on a machine because the overall performance of the server will be improved and the administration simplified, but sometimes it is useful to be able to run multiple isolated environments on the same large server, such as when you need to run different versions or service pack levels to support existing applications. SQL Server 2005 supports up to 50 instances on a single server.
SQL Server 2005 greatly simplifies the job of managing a database because it is largely self-tuning. Whether you need to manage a few or hundreds of SQL Servers, tools are included that will reduce the cost of implementing and maintaining SQL Server instances. Most management operations can be performed with the database online.
For backup and index maintenance operations, a wizard will create and deploy scheduled maintenance plans. It requires only a few minutes to implement a maintenance plan for a SQL Server instance. Backups of the data or the log are performed online, so there is no need to take the database down to create a backup. Most index reorganizations or rebuilds are also performed with the database online.
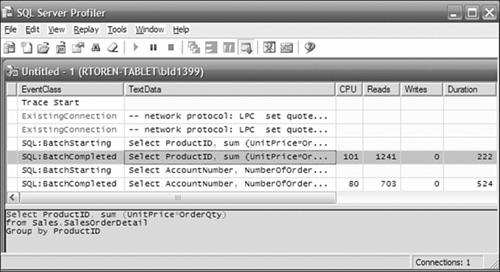
To help track down resource-intensive queries or operations, SQL Profiler can monitor all statements or a subset of the statements sent to SQL Server, as shown in Figure 2-3. You can see the statement, who issued it, how long it ran, and many other metrics and attributes. You can view the list directly or record it to a table or file. You can capture the text of a query and have the Database Engine Tuning Advisor provide suggestions for creating new indexes to help the query perform better.
SQL Server is extensively instrumented to provide information about how it is using resources. To monitor the resource consumption or internal metrics of SQL Server’s operation, you can run the System Monitor (previously known as Perfmon). You can use this information to determine or predict requirements for additional resources.
If you are managing more than a few SQL Servers, a separate product called Microsoft Operations Manager (MOM) can collect events and errors raised by each instance and filter out the important information for forwarding to the system operators. With the MOM interface, you can see at a glance the state of any of the servers. Predictive logic in MOM can alert you to potential issues before they become critical issues.
SQL Server Agent is a Windows service that can schedule and execute jobs. A job is a sequence of one or more steps. A step can invoke an operating system command, SQL script, Analysis Services query or command, Integration Services package, an ActiveX script, or a replication management command. The job can be executed on demand or scheduled to recur on a regular basis. The sequence of job steps can be conditional on the results of a prior job step. Notifications can be sent via e-mail, pager, or net send command on the success or failure of the job.
SQL Server supports authentication of connections using either Windows authentication alone or Windows and SQL Server authentication. Windows authentication uses your Windows credentials to identify you; SQL authentication uses a login name and password that a SQL Server administrator creates for you. This login is valid only for connecting to a single SQL Server instance.
SQL Server 2005 authentication has been enhanced over that of SQL Server 2000 to provide security rules such as password expiration and strong password requirements. Access to a database is not possible without an authenticated connection. You can use Windows groups or individual accounts to assign database permissions. Using groups makes administration easier because the database administrator (DBA) no longer needs to administer individual users, just a smaller number of groups. Windows authentication is preferred because it provides a single logon for users, it is more secure, and you don’t have to maintain two sets of accounts.
Database permissions can be very granular. You can set read, write, update, delete, or deny permissions at the database level, table level, or column level. In a medical application, you could deny read permission on personal identification data to most users, while allowing reads on a Diagnosis column. This would allow statistical analysis of disease data, without letting a user associate this information with any patient. The ability to invoke any management or database operation, such as backup or database creation, can be granted, or denied, to any user or group. As with all rights and permissions in SQL Server, deny overrides any granting of rights or permissions.
Transmissions “over the wire” can be encrypted to protect data being sent between the client and server. You can also encrypt stored data down to the column level, using certificates, symmetric keys, or asymmetric keys.
SQL Server provides a wide range of options to ensure availability under almost any circumstances. Whether you need server redundancy simply to be able to perform server maintenance, or geographically remote synchronized databases for disaster recovery, you will find the features and tools to support these requirements. Clustering provides automatic failover to one or more alternative servers connected to the same storage area network (SAN). Database mirroring is a cost-effective solution that provides complete synchronization over the network between databases and fast automatic failover to a completely separate set of servers and storage. Replication offers the ability to synchronize a subset of the database with another active server. All the options maintain transactional integrity.
You can run SQL Server on either 32-bit or 64-bit Windows platforms, but the file structures are exactly the same, so you can freely move databases from 32-bit to 64-bit and back again. 64-bit architecture gives you the advantages of a much larger and more efficient memory space, and more processors per server. The reason memory space is important is to support larger data and query caches. You can use up to 32TB of RAM on a 64-bit platform.
You can also add more processors to improve performance or handle a larger workload. Eight-way servers are commonplace now and are appropriate for many situations. For larger data warehouses, you can scale up SQL Server to 128 processors on a single server.
Multi-terabyte data warehouses are supported with good design and infrastructure in most contexts. The maximum single database size is 1,048,516 terabytes. We will avoid becoming famous for stating that this “should be enough for anyone.” However, it is likely enough for the next few years, for most uses.
Partitioned tables and distributed partitioned views are two features of the database engine that enhance support for very large databases. A partitioned table appears as a single table to a query, but the rows in the table are physically divided across a number of filegroups in the same database. A distributed partitioned view is similar in concept, but the tables are distributed across several SQL Servers and presented to the user through a view. If the SQL Servers are multiple instances on a single server, this is called simply a partitioned view. These features offer improvements in performance through parallel queries and through manageability and maintenance (because you can treat each partition independently in many respects).
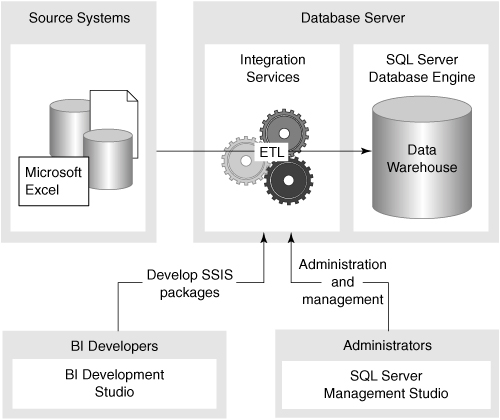
SQL Server Integration Services (SSIS) provides the data ETL services that you use to deliver clean, validated data to your data warehouse. Integration Services also enables you to invoke administrative tasks, monitor external events, and maintain audit logs of Integration Services runtime events. The design and runtime environments are totally new in SQL Server 2005, replacing Data Transformation Services (DTS) of SQL Server 2000. DTS packages may continue to be executed, but not modified, because Integration Services has a completely different architecture.
Integration Services is an independent service that you can choose to install and run on any server, as shown in Figure 2-4, regardless of whether the SQL Server engine is installed on that server. You create packages to access, cleanse, and conform source data; load data into the relational data warehouse and Analysis Services databases; and audit the overall ETL process. Packages are usually executed by a job scheduled by the SQL Agent, or an active package can wait on an external event such as the arrival of a file.
BI Development Studio is the development environment for Integration Services packages. You create an Integration Services project, which may contain one or more packages. A graphical designer is used to build the packages, and you can configure most complex tasks or transforms via a wizard. The designer retains metadata about all the data flowing through the package. You can break data flows, insert new transforms, and reconnect the data flow without fear of losing column mappings going into or out of a transform.
A package primarily contains one or more control flows, and usually a data flow invoked by the control flow. You can think of a control flow as a high-level description of the steps needed to accomplish a major task. For example, the steps to update the data warehouse might be “initiate an FTP download from regional offices,” “load the sales data,” and “load the inventory data.”
The details of how to load the sales and inventory data are not part of the control flow, but are each a separate data flow. The data flow tasks would define the source for the data, which columns you needed, probably some key lookups, validation, and eventually would write the transformed data to the data warehouse.
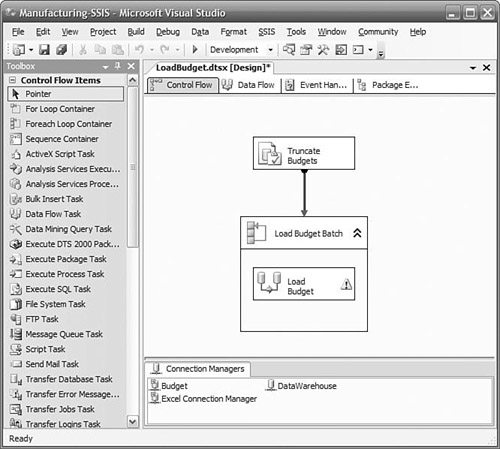
Even though our goal is frequently just to move data from our sources to the data warehouse, quite a bit of administration and overhead is required to implement a full production-ready ETL solution. You might need to empty tables, update audit logs, or wait for an event to occur indicating the availability of new data. Some tasks must be performed before others. This is what a control flow is for. Integration Services provides a number of different types of tasks that you can link together to perform all the steps necessary for your ETL solution.
You graphically design the control flow by dragging tasks from the toolbox onto the work surface, as shown in Figure 2-5. Simple tasks do things such as execute an SQL statement, invoke a data flow task, or invoke another package. Variables can be defined and used to pass information between tasks or to other packages. You can define a sequence for their execution by linking one task to another, or you can define a group of tasks that can execute in parallel by putting them in a sequence container and simply linking other tasks to or from the container. You can put a set of tasks in a loop to be executed until some condition is satisfied, or have them repeated while enumerating the values on a list, such as a list of file names to be loaded.
Other tasks are related to interacting with external events and processes rather than data. You can work with a message queue to send or wait for a message. You can listen for any Windows Management Instrumentation (WMI) event, such as a new file added to a directory, and begin the control flow task when this occurs. You can use a web service to receive data or a command to initiate processing. You can initiate FTP sessions to send or receive data files between systems with no other common interface.
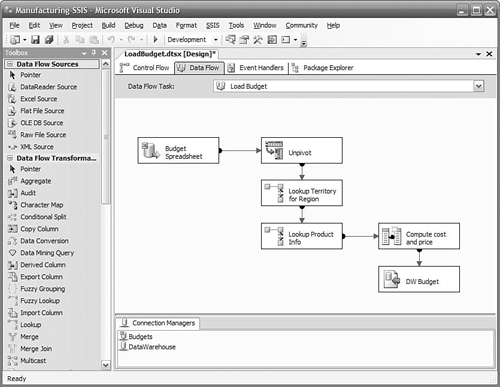
A data flow defines where the data comes from (the data source), the transformations required to make it ready for the data warehouse, and where the data goes to (the data destination), as shown in Figure 2-6. This is generally the core of a package. Many data flows can be invoked by a control flow, and they may be invoked in parallel. A data flow is initiated when a data flow task is executed in a control flow.
Integration Services supports a wide variety of data sources and data destinations. Common relational databases such as SQL Server, Oracle, and DB2 are supported directly “out of the box.” In addition, Excel, Access, XML documents, and flat files connectors are provided. Connections can also be made to Analysis Services cubes, Directory Services, and Outlook, among many other services with OLE DB providers. You can use Integration Services for essentially all your ETL requirements between any data sources and destinations. There is no requirement at all that a SQL Server database be either the source or the destination of a data flow.
Data transformations are used to define the specific actions to be performed on the data in a data flow task as it flows from a data source to a data destination. You graphically design the sequence of actions by dragging data sources, transforms, and data destinations onto a design surface, configuring them, and linking them together. Simple transforms provide a means of changing data types, computing new columns, or looking up values in a reference table based on one or more columns in the data flow.
Many other powerful transforms make it easy to solve some difficult problems you might encounter in the course of importing data into a data warehouse, such as slowly changing dimensions, which is described in Chapter 8, “Managing Changing Data.” If you have duplicate rows in an address table, a Fuzzy Grouping transform will provide a ranking of rows that are probably the same, even with minor differences in spelling or punctuation. If you receive data in a spreadsheet, it is often denormalized, with multiple time periods across the columns when you really need one row per time period. An Unpivot transform will normalize the data stream, putting each column on its own row, retaining the row key and adding an additional key to indicate which column the row corresponds to.
You can also add transforms to split or merge a data flow. If you need to process some rows differently than others based on some value in the row, you can use a Conditional Split transform to create multiple independent data flows. You can perform unique transforms on each data flow, and then send each one to unique destinations in the data warehouse or other data target, or you can merge some of the data flows back into the main stream.
Data flows quickly through most transforms thanks to the new pipeline architecture in Integration Services. You will see that a typical data flow consists of reading data from a source, passing it through several transforms, and the finally writing it to a destination. The data is not written to disk between each transform. Instead, it is retained in memory and passed between the transforms. For large volumes of data, a block of records is read from the source and then passed on to the first transform. When the transform completes its work on the block, it passes the data on to the next transform and then receives another block to continue working. Both transforms can now work in parallel. This design means there is little overhead spent writing intermediate results to disk only to be read back in again immediately.
Debugging packages is easy, too. When the package is executed in the BI Development Studio, each task is color coded by its state. Running tasks are yellow, successfully completed tasks turn green, and failing tasks turn red. Row counts display along each data flow path so that you can observe the progress and traffic along each path. If you need to view the data flowing along a path, you can add a data viewer to the path. A data viewer can show you the value of each column in each row in a grid, or you can choose to view column values as a histogram, scatter plot, or column chart. If a transform or task fails, a descriptive error is written to a progress file. You can set breakpoints at any task, or at any point in a script task or transform, step through each task or script, and view the values of variables as they change.
The ETL process is critical to ensuring high quality of the data reaching the data warehouse. Integration Services transforms are designed so that data containing errors can be redirected to a different path for remediation. Common errors such as missing business keys or string truncation errors automatically raise an error condition by default, but you can specify alternative actions. You can also use a Conditional Split transform to redirect rows with values that are out of a predefined range. Nearly every transform provides multiple data flow outputs that you can simply drag to some other transform to create a new data flow that you use to handle the data that has failed some test.
You can deploy packages to other environments such as test or production one at a time from the development studio, or in a batch using a command line. Using package configuration sources, you can reconfigure properties such as connection strings, server names, or parameters at runtime. The source for these properties can be environment variables, the registry, a database table, or an XML file.
Integration Services packages can be run from the BI Development Studio designer, by starting them in SQL Server Management Studio, from a command line, or through the SQL Agent to schedule the execution. You can also invoke a package from another package. You can pass parameters to the packages using any of these methods. The parameters can set package variables that can be used to set task and transform properties, such as a server name, or to control other aspects of the package execution. You can use Management Studio to view or stop currently executing packages, regardless of how they were started.
SQL Server Analysis Services is an engine designed to support storing and querying large amounts of data based on dimensional models. Analysis Services implicitly understands concepts such as dimensions, hierarchies, slicing, and filtering. Using Analysis Services, you no longer need to worry about how to construct complex SQL statements to do the kind of analysis of your data commonly performed in BI applications.
In addition to simply presenting a set of values as output, Analysis Services can assist in interpreting these values. Data mining capabilities in Analysis Services can provide insight into the relationships between different aspects of your data (for example, how level of education correlates with credit risk). Another common application in BI is key performance indicators (KPI), where you are measuring success against some pre-established goals.
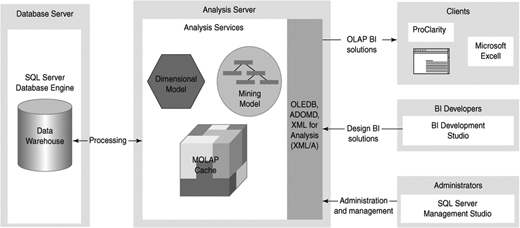
Analysis Services reads data from one or more sources to populate the dimensions and cubes you have designed. It is a distinct service from the SQL Server database engine. Most common data sources can be used by Analysis Services as data sources. You can just as easily create Analysis Services databases with Oracle or Access databases as you can with SQL Server databases.
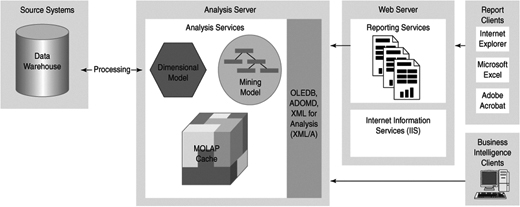
Like the SQL Server database engine, Analysis Services is a server application, as shown in Figure 2-7, not an end-user application. Queries in the form of Multidimensional Expressions (MDX) statements are submitted to the server, and results are typically returned to the user through Excel, Reporting Services, Business Scorecard Manager, or third-party tools such as ProClarity, Cognos, and Panorama. Communication with end-user applications is done using XML for Analysis (XMLA), an open standard for interfacing with data sources. The XMLA council has more than 20 vendors (and many more subscribers to the standard).
Usually a single server machine runs a single instance of Analysis Services, just like the SQL Server database engine, but you can configure a server to run more than one instance of the Analysis Services engine at the same time if necessary.
With Analysis Services 2005, you can have on-demand, real-enough-time, or real-time updating of the analysis database. The notification of new data being available can be automatic if you are using SQL Server or via polling for other databases. You choose how long to wait before processing new data, and how old the data is allowed to be, and Analysis Services will ensure that if the data is not available in its database within that timeframe, it will revert to the relational data store until it is available. This feature is called proactive caching and is an important feature not just for real-time scenarios but for high availability, too. Updating performed using proactive caching does not mean taking the database offline.
In a BI development environment, you need to specify what the data sources are, what your dimensions and measures are, the goals of your KPIs, and other design criteria. This is not an end-user task, but a task for a BI developer.
BI Development Studio is the graphical development environment where you create your Analysis Services database design, as shown in Figure 2-8. This is the same environment used to develop Integration Services packages and Reporting Services reports. Analysis Services projects can be included in source control services, and you can define multiple project targets, such as “dev,” “test,” and “production” environments.
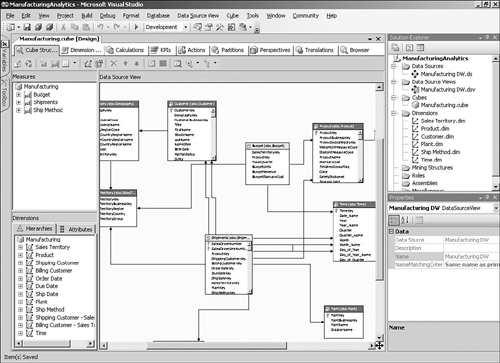
Building a basic cube is extremely simply, thanks to a wizard. All you need to do is to tell the wizard which tables to include, and it will determine which tables represent dimensions and which represent facts. If you have enough data in the tables, the wizard can determine some of the natural hierarchies of each dimension. You can be well on your way to having the framework for a cube within minutes. Many other wizards are available to help you build special objects such as time dimensions.
In the designer, you also specify any KPI, actions, data partitioning, and other options you require. The result of building an Analysis Services project is an XML file that completely describes your design. You can have this file deployed to any server running Analysis Services, which creates the Analysis Services database and performs the initial population of the dimensions and cubes. You can use the Analysis Services Deployment Wizard to deploy your database to other servers and environments, and as part of the deployment, specify properties to change so that the solution will work in the new environment, such as the data source server, the log files, and so on.
You can also reverse engineer an existing Analysis Services database into a BI Development Studio project. This is important because you can make changes to a live database through the SQL Management Studio, or through programmatic means; neither method modifies the underlying project.
You use SQL Server Management Studio as shown in Figure 2-9 to perform routine maintenance, manage security, and to browse the dimensions and cubes.
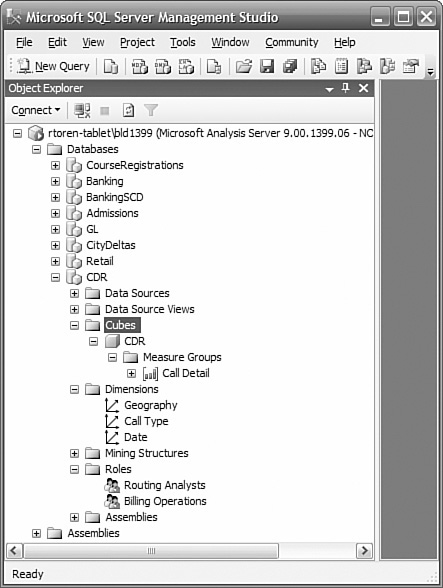
If you need to understand the kinds of queries being presented to a cube, you can use SQL Profiler (the same one used to trace relational queries). You can filter on the duration of a query, who issued the query, and many other attributes. You can capture the query string, put it into an Analysis Services query window in Management Studio, and execute it to review its results and test modifications to the query.
Analysis Services by default requires authentication of connections using Windows authentication. When you log in to Windows, you are authenticated, and the credentials you receive are used by Analysis Services to determine your permissions. In this default mode, access to a database is not possible without an authenticated connection and explicit permission granted for that database. In Analysis Services, you create roles to which you give permissions to all or portions of a cube. You can place Windows groups or individual user accounts in these roles. Using groups makes administration easier because you no longer need to administer individual users, just a smaller number of groups, and the specific groups rarely change.
You can configure Analysis Services to use Basic or Digest authentication or to simply grant unauthorized users access (although, of course, the latter is not generally recommended).
OLAP technology can usually support all the different design elements covered in Chapter 1, “Introduction to Business Intelligence,” including the ability to easily handle stars or snowflakes and to define hierarchies from the attributes in a dimension. However, in the past there has always been one major reason that people continued to use relational reporting as well as OLAP. Most OLAP technologies restrict users to drilling down through summary data along predefined hierarchies; so when users get to a point in their analysis where they want to see detailed transactional information, they need to switch to a relational report.
SQL Server 2005 includes some OLAP innovations that can unify these previously separate relational and dimensional reporting models, called the Unified Dimension Model (UDM). The term UDM refers to the extended set of capabilities offered by Analysis Services 2005, which essentially means that cubes are not restricted to providing classic drilldown access through a star or snowflake schema, but can support detail-level reporting from complex real-world source databases.
The major difference is that users of Analysis Services 2005 cubes are not restricted to a predefined set of hierarchies for querying the cube. Instead, they can use any descriptive attribute on a dimension to analyze information. This means that in addition to the classic OLAP-style reports with summary information, users can include attributes such as order numbers to generate reports with the most detailed level of information available, such as a list of order-line items.
As BI solutions become a key part of the strategy of a company, BI will quickly move from being simply an important initiative to a mission-critical system. In large and more complex BI solutions, Analysis Services’ support for availability, scalability, and very large volumes of data become essential.
Analysis Services is cluster-aware. It can be placed in a failover cluster to provide fault tolerance or in a load-balanced cluster to provide more resources to support additional users or more complex queries. Database synchronization provides a means to propagate changes from an Analysis Services database to other databases in a load-balanced cluster. The cubes remain online during synchronization and present a consistent view to the users. When synchronization is complete, the new version of the database is presented to the users.
Analysis Services can be run on either 32-bit or 64-bit Windows platforms and can use as many processors as the operating system will support. Typically, you would use 2-way to 16-way servers, but you can go up to 128 processors. This extreme is usually unnecessary because Analysis Services databases can also be deployed to as many servers as required to support the volume of queries you have. Databases can be transparently synchronized from a master database to the other servers to support this scenario.
When cubes become large, they could require a long time to process after the addition of new data. Analysis Services supports partitioning of cubes, and you only have to process partitions where the underlying data has changed. You usually partition over time, so by designing your partitions so that only the most recent ones are updated, you can reduce the overall processing time significantly (often to just a few minutes).
SQL Server Reporting Services is a server-based platform for designing, managing, and delivering both interactive reports and traditional printed reports. Although Reporting Services is a component of SQL Server 2005 and uses a SQL Server database as the catalogue, you can include data in your reports from any database with an OLE DB or ODBC driver. This version of Reporting Services also has great integration with Analysis Services, making it easy to build reports that take advantage of the rich multidimensional information available in cubes.
Many reporting technologies required a client application to be installed on every user’s computer. Reporting Services is different: It is a fully server-based application built around web services, as shown in Figure 2-10, which can render and deliver the same report in whatever format the user requests. The report can be an HTML page that is displayed using a browser, a PDF file that uses Adobe Acrobat Reader, an Excel spreadsheet, or one of several other formats.
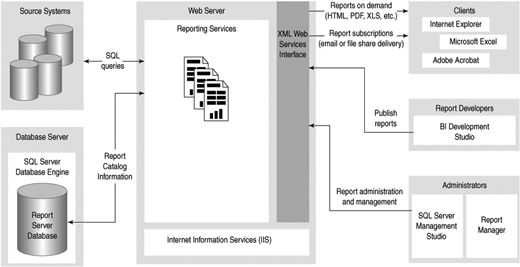
Report developers can design a report on their workstation and then publish the report definition to the reporting server. When a user makes a request for a report, the Reporting Services web service is responsible for querying the underlying data sources, rendering the report in the necessary format, and returning the information back to the client for display. Reports can also be configured so that the data is cached to improve performance.
Reporting Services requires Internet Information Services (IIS) to be installed on the server, and in common with many Web applications, it is usually installed on a separate server from the database server.
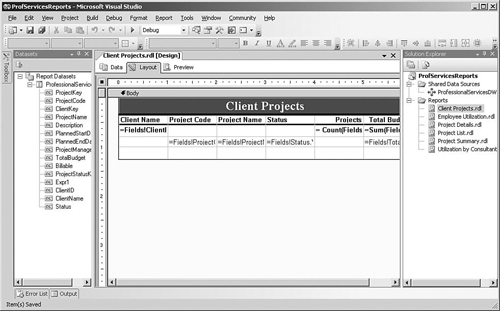
BI Development Studio includes a Report Server project type for building reporting solutions. Reports are developed using a drag-and-drop report layout and query designer, as shown in Figure 2-11, and the report can also be executed within the designer to preview the results. The report designer is flexible and not restricted to “bands” (in contrast to many other reporting environments). You can combine tables, lists, and text boxes in a single report that may have multiple data sources.
You can add parameters to the reports so that users can select the data that they are interested in seeing before running the report. You can link each parameter to a query so that a list of possible values is presented to the user. Reports can also include complex expressions using the VB.NET syntax, to provide totals or more complex calculations. For more complex applications, you can add functions to the report’s code section or even register a .NET assembly and make calls to it from within report expressions.
Report solutions that you create in the BI Development Studio environment consist of RDL (Report Definition Language) and other files on your development machine. After you have finished designing the reports, you can deploy the solution to a server running Reporting Services so that users can access the reports.
Because Reporting Services is essentially a web service that delivers reports on request, you can integrate reports into your Web-based or Windows client applications easily. Visual Studio 2005 includes a ReportViewer control that you can use to display server-based reports within a Web-based or Windows client application. Reporting Services also includes two Web parts that enable you to display reports in a Windows SharePoint Services (WSS) team site.
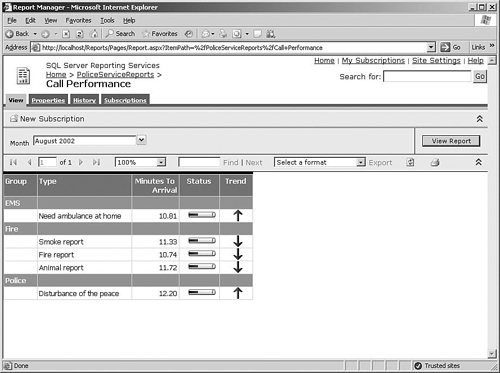
You can also access every report via a simple URL, so the easiest way to integrate reports into your own Web applications is just to supply a hyperlink that the user can click to display the report in his browser. Alternatively, one of the most common ways that users access reports is via a Web application called Report Manager that is installed as part of Reporting Services, as shown in Figure 2-12. Report Manager enables users to browse a list of reports that they have access to, enter parameter values, and view the reports in the browser.
One of the most interesting features of Reporting Services is that a single report can include information from different queries, which are available as datasets in the report designer. Each dataset can be associated with data regions in the report to display the information. The data region could be a simple table, a flexible list that gives you more control over the formatting, or a matrix, which is similar to a table but with dynamic columns determined at runtime.
Rather than just statically presenting a list of information, you can also configure reports to include some interactivity. For example, in a report that shows revenue by product with subtotals for each product category, the report could be designed so that only the summary data is initially displayed and the user can drill down to see the detailed product-level information for a particular category.
You can also configure data elements in reports to include hyperlinks. These links can be used to create drillthrough reports, where the user clicks the link to display another report containing the details of the total the user selected. Alternatively, the link could open another Web application and pass across the data selection as a parameter, or jump to a particular section of the same report.
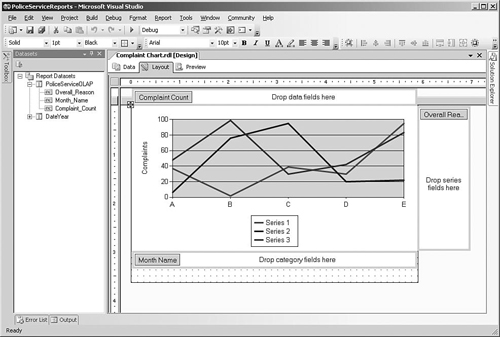
Reports can also include charts to graphically represent data in a report. All the standard chart types are supported, including bar and column charts, pie charts, and line and area charts, as shown in Figure 2-13. The chart designer enables you to drag and drop fields for the data values, categories, and series onto the design surface and then specify display options such as fonts and colors.
Access to predefined, parameterized reports suffices for many users, but most organizations have a number of people who need more flexibility in reporting but who don’t have the technical background to be comfortable with BI Development Studio and SQL or MDX query syntax. Report Builder is a component of Reporting Services that enables business users to create their own ad-hoc reports against a more user-friendly view of the data called a report model.
Report models can be built on top of SQL Server relational or Analysis Services databases using BI Development Studio, or a complete report model can be generated from an Analysis Services data source in one step using the Report Manager or SQL Server Management Studio tools. After the report model has been deployed to the reporting server, business users can launch the Report Builder application to create reports, as shown in Figure 2-14.
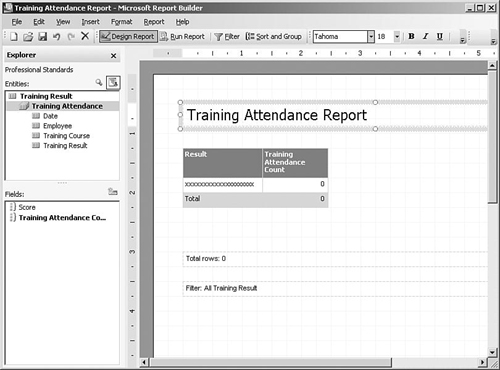
Report Builder is designed along the same lines as other Microsoft Office applications (although it is a click-once application that doesn’t require a complex client installation before use). Users start by selecting the area of the model and a standard layout, and then they can drag and drop fields onto the design surface and specify filters. Reports are then published to the Reporting Services server, either to the user’s personal “My Reports” folder or to more widely available folders if the user has the appropriate level of access.
So far we have looked at how users can view reports when they want, but Reporting Services also enables users to subscribe to a report and have it delivered to them via e-mail on a periodic basis. Users can specify parameter values for the report so that they receive the information relevant to their job, such as for a particular sales region or product group. Users can manage their subscriptions using the My Subscriptions feature in Report Manager, which allows them to modify or delete subscriptions.
A subscription can also be set up to send the report directly to a file share rather than by e-mail, which enables users to send a copy of a report to their folder of choice in a handy format such as an Excel spreadsheet or PDF. This proves useful for standard reports such as weekly sales reports that can be made available in the user’s folder automatically every week.
Other than individual subscriptions to a report, Reporting Services also supports a feature called data-driven subscriptions that enables you to broadcast a report to a list of users. You can set up a query that returns a mailing list of e-mail addresses (or file share locations) and associated parameter values so that individual users can receive customized reports, and this list is then used at runtime to determine where to send the report.
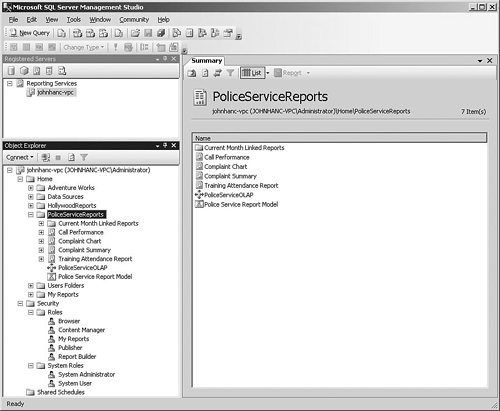
Reporting Services can be managed using SQL Server Management Studio, as shown in Figure 2-15; alternatively, if you are managing a single report server over a Web connection, you can use Report Manager. Many of the report properties are defined in BI Development Studio, but you can use the management tools for tasks such as changing the data source connections to point to production servers or modifying the parameters that are shown to the user.
Reporting Services has a number of settings that you must define, such as the location of the catalog database and the credentials used to access it, as well as the virtual directories for the web service and Report Manager Web application. SQL Server 2005 has a tool called the Reporting Services Configuration Manager that enables administrators to specify these settings and test the results.
Access to reports is based on the users’ Windows account credentials and the groups that they belong to. Using the management tools, a single report can be secured so that only specific users or groups can access the report, or the security can be defined at the level of a folder containing multiple reports.
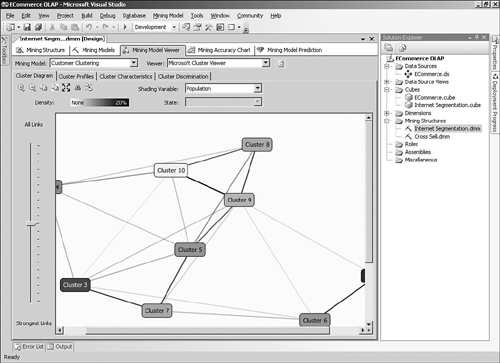
As you have seen, Analysis Services enables you to build powerful BI solutions that enable users to really understand the business. However, many business problems rely on the ability to spot patterns and trends across data sets that are far too large or complex for human analysts. Data mining can be used to explore your data and find these patterns, allowing you to begin to ask why things happen and to predict what may happen in the future.
Data mining in SQL Server 2005 is integrated into the Analysis Services engine, as shown in Figure 2-16. The information derived from data mining can be made available as part of Analysis Services cubes and Reporting Services reports so that users can apply the groupings and predictions from data mining to the existing data.
Data mining and data warehouses go well together because using clean, validated information is vital to the successful use of data mining. Just like most Analysis Services features, you can use data mining against almost any source of information, including transaction systems, but as usual we recommend starting from a data warehouse as the best source of data.
One of the great features of data mining in SQL Server 2005 is that you can either use relational tables as the source data for the models or you can build models on top of multidimensional cubes. The advantage of using cubes as the source is that the models can use any complex calculations that you may have added and can also sometimes benefit from the query performance increase for aggregated information.
You can use the BI Development Studio to design and validate data mining models by adding them to an Analysis Services project, as shown in Figure 2-17. After deciding whether to use a data source or the current cube as the source, you can select an algorithm and then supply the relevant information to set up the model. A data mining algorithm is the mechanism that actually creates the mining models by looking for specific patterns in a data set. The model created can be validated and tested within the same development environment and then deployed to an Analysis Services server.
After your model has been deployed on a server, you can use it to make predictions using a query language called DMX (Data Mining Extensions), which is somewhat similar to SQL. The process for querying a mining model is similar to querying other Analysis Services objects and uses the OLE DB Provider for Analysis Services. For example, when customers on your e-commerce site adds a DVD to their online shopping basket, you could submit a DMX query to use a mining model to predict which other titles a specific customer might like to purchase.
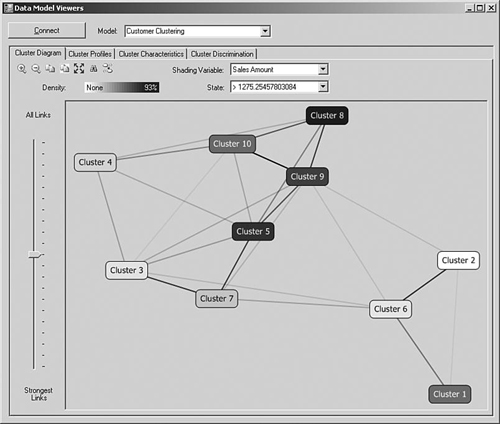
If you want to display the data mining models in your application, two different viewer libraries are available depending on whether you are building Web-based or Windows Forms applications. The Web-based controls are included with SQL Server 2005 as a sample project that you will need to compile using Visual Studio. These controls can then be added to Web pages to show the results of some of the algorithms.
For Windows client applications, the data mining viewer controls shown in Figure 2-18 are shipped as part of the Feature Pack for SQL Server 2005, which is a collection of add-ons and components that were only completed after the release of SQL Server 2005.
SQL Server 2005 ships with many Microsoft data mining algorithms in the box and also supports “plug-in” algorithms from third-party vendors. The algorithm that you decide to use will depend on the task you are trying to accomplish. For example, some algorithms such as Microsoft Decision Trees are good for predicting the expected value of a numeric attribute such as sales revenue, or predicting the category that a particular record may fall into. Other algorithms are used to group records together into similar categories, such as using the Microsoft Clustering Algorithm to segment customers by demographic information.
One of the most innovative aspects of data mining in SQL Server 2005 is the incorporation of data mining features into Integration Services. Data quality is one of the main concerns in BI projects, and Integration Services includes a Data Mining Query transformation that you can use to redirect or modify a row depending on the results of a data mining prediction. For example, data that is outside the normal range could be flagged for review or could be categorized using the mining model, as shown in Figure 2-19.
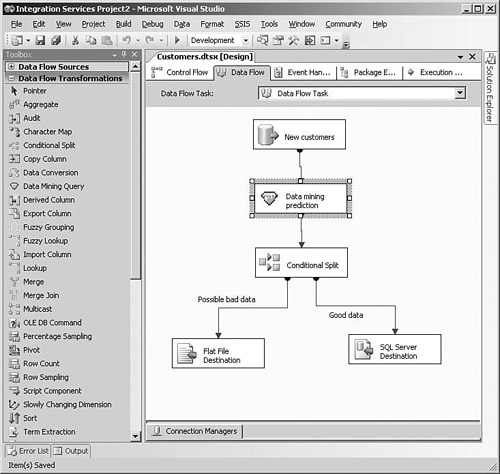
Integration Services also has some transformations that take advantage of data mining, such as Fuzzy Lookup, which can be used to return “close” rather than just exact matches from a reference table, and Fuzzy Grouping to help identify possible duplicate rows.
Because SQL Server’s data mining features are provided by Analysis Services, the security and management for data mining models work the same way as for cubes and other Analysis Services objects. You can add users to roles, which control their ability to access data mining models, and you can use SQL Server Management Studio to reprocess the models to load new data.
Here are some other components of SQL Server that you might find useful, although they aren’t commonly used in standard BI applications.
Full-text search enables you to index and search text fields in a database, as well as to search text in various types of files on disk, such as Word documents or PDF files. The search uses word stemming and fuzzy matching to return a ranking of how well each document or row in a table meets the search criteria. An example of the use of full-text search is to allow customers to search an online product catalog. Full-text search supports multiple languages.
Notification Services enables you to notify a large number of users with personal messages of some data event, such as a stock exceeding a preset value or a delay of a flight. Subscribers to notifications can set the criteria, and event providers provide event notifications. Standard event notification sources include file system changes, SQL Server queries, and Analysis Services queries. In addition to e-mail, you can send notifications to a variety of other devices.
If you need to send an asynchronous message between two applications using SQL Server, with guaranteed delivery, Service Broker can provide that capability. It is similar to the intent of a message queuing service, although without some of the administrative requirements. Service Broker is integrated with the SQL Server database engine service and can be used effectively in the development of distributed applications.