
A good programmer is not necessarily one who can get things right the first time. To be fully effective as a VBA programmer, you need to master the art of debugging—the process of troubleshooting your application. Debugging involves locating and identifying problem areas within your code and is a mandatory step in the application-development process. Fortunately, the Access 2002 Visual Basic Editor provides excellent tools to help you with the debugging process. Using the Access 2002 debugging tools, you can step through your code, setting watchpoints and breakpoints as needed.
Using the VBA debugging tools is significantly more efficient than taking random stabs at fixes to your application. A strong command of the Access 2002 debugging tools can save you hours of trial and error. In fact, it can be the difference between a successfully completed application-development process and one that continues indefinitely with problems left unsolved.
The best way to deal with bugs is to avoid them in the first place. Proper coding techniques can really aid you in this process. Using Option Explicit, strong typing, naming standards, and tight scoping can help you eliminate bugs in your code.
Option Explicit requires that all your variables be declared before they are used. Including Option Explicit in each Form, Code, and Report module helps the VBA compiler find typos in the names of variables.
As discussed in detail in Chapter 7, “VBA: An Introduction,” the Option Explicit statement is a command that can be inserted manually into the General Declarations section of any Code, Form, or Report module. If you prefer, it can be inserted automatically by selecting Require Variable Declaration from the Editor tab after choosing Tools|Options from within the Visual Basic Editor. After it is inserted, Option Explicit is placed in the General Declarations section of all new modules. Existing modules are not affected.
Strong-typing your variables is discussed in Chapter 7. Strong-typing a variable means indicating what type of data is stored in a variable at the time it is declared. For example, Dim intCounter As Integer initializes a variable that contains integers. If elsewhere in your code you assign a character string to intCounter, the compiler will catch the error.
Naming standards can also go a long way toward helping you eliminate errors. The careful naming of variables makes your code easier to read and makes the intended use of the variable more obvious. Problem code tends to stand out when naming conventions have been followed judiciously. Naming standards are covered in Chapter 1, “Access as a Development Tool,” and are outlined in detail in Appendix B, “Naming Conventions.”
Finally, giving your variables the narrowest scope possible reduces the chances of one piece of code accidentally overwriting a variable within another piece of code. You should use local variables whenever possible. Use module-level and global variables only when it is necessary to see the value of a variable from multiple subroutines or multiple modules. For more information about the issues surrounding variable scoping, see Chapter 7.
Unfortunately, no matter what you do to prevent problems and errors, they still creep into your code. Probably the most insidious type of error is a logic error. A logic error is sneaky because it escapes the compiler; your code compiles but simply does not execute as planned. This type of error might become apparent when you receive a runtime error or when you don’t get the results you expected. This is where the debugger comes to the rescue.
The Immediate window serves several purposes. It provides you with a great way to test VBA and user-defined functions, it enables you to inquire about and change the value of variables while your code is running, and it enables you to view the results of Debug.Print statements. To open the Immediate window while in the Visual Basic Editor, do one of three things:
Note
An advantage of pressing Ctrl+G is that it invokes the Immediate window without a Code window being active. You can click the Immediate Window toolbar button or choose View|Immediate Window only from within the VBE.
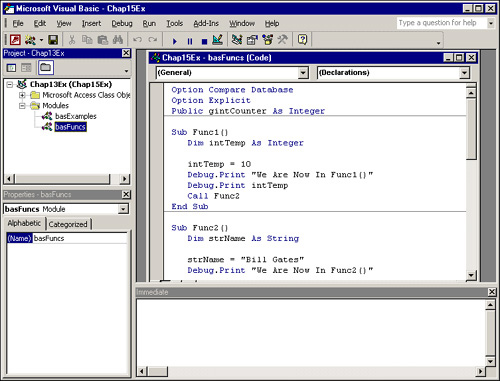
The Immediate window is shown in Figure 15.1.
Note
The Debug tools are available on a separate toolbar. To show the Debug toolbar, right-click any toolbar or menu bar and select Debug from the list of available toolbars.
The Immediate window enables you to test the values of variables and properties as your code executes. This can be quite enlightening as to what is actually happening within your code.
To practice with the Immediate window, you do not even need to be executing code. To invoke the Immediate window while in a form, report, or module, press Ctrl+G. To see how this works, follow these steps:
Run the frmClients form from the CHAP15EX.MDB database on the accompanying CD-ROM.
Press Ctrl+G to open and activate the Immediate window. You are placed in the Visual Basic Editor (VBE) within the Immediate window.
Type
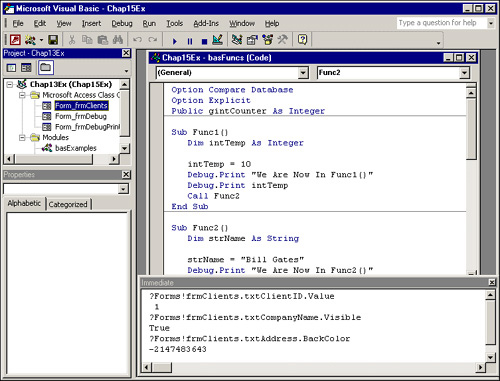
?Forms!frmClients.txtClientID.Valueand press Enter. The client ID of the current client appears on the next line.Type
?Forms!frmClients.txtCompanyName.Visibleand press Enter. The wordTrueappears on the next line, indicating that the control is visible.Type
?Forms!frmClients.txtContactTitle.BackColorand press Enter. The number associated with the BackColor of the Contact Title text box appears on the next line.
Your screen should look like the one shown in Figure 15.2. You can continue to request the values of properties or variables within your VBA code.
Not only can you display things in the Immediate window, you can use the Immediate window to modify the values of variables and controls as your code executes. This feature becomes even more valuable when you realize that you can re-execute code within a procedure after changing the value of a variable. Here’s how this process works:
Invoke the Immediate window, if necessary. Remember that you can do this by pressing Ctrl+G.
Type
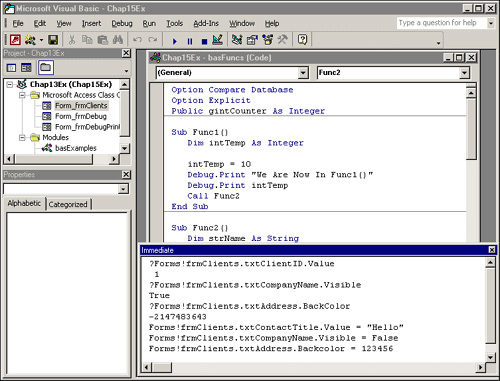
Forms!frmClients.txtContactTitle.Value = "Hello"in the immediate pane. Press Enter. The contact title of the current record changes toHello.Type
Forms!frmClients.txtCompanyName.Visible = False. Press Enter. ThetxtCompanyNamecontrol on thefrmClientsform becomes hidden.Type
Forms!frmClients.txtClientID.BackColor = 123456. Press Enter. The background color of thetxtClientIDcontrol on thefrmClientsforms turns green. The Immediate window and your form now look like those shown in Figure 15.3.
The Immediate window is an extremely valuable testing and debugging tool. The examples here barely begin to illustrate its power and flexibility.
Caution
Changes you make to data while working in the Immediate window are permanent. On the other hand, changes you make to the properties of controls or the values of variables are not saved with the form or report.
Some people think that data changes made in the Immediate window are not permanent. In other words, if you modify the last name of a customer, she believes that the change will not be permanent (but, of course, it is). Other people think that if they change the backcolor property of a control, the change will persist in the design environment (but, of course, it won’t).
The Immediate window displays the last 200 lines of output. As additional lines of code are added to the Immediate window, older lines disappear. When you exit completely from Access and return to the Immediate window, it is cleared. If you want to clear the Immediate window at any other time, follow these three steps:
In addition to being able to test and set the values of properties and variables using the Immediate window, you can test any VBA function. To do so, type the function and its arguments in the Immediate window, preceded by a question mark. This code returns the month of the current date, for example:
?datepart("m",date)This tells you the date one month after today’s date:
?dateadd("m",1,date)This tells you how many days exist between the current date and the end of the millennium:
?datediff("d",date(),#12/31/2999#)In addition to enabling you to test any VBA function, the Immediate window lets you test any user-defined subroutine, function, or method. This is a great way to debug your user-defined procedures. To see how this works, follow these steps:
Open the basExamples module found in the CHAP15EX.MDB database on the accompanying CD-ROM.
Invoke the Immediate window if it is not already visible.
Type
?ReturnInitsFunc("Bill","Gates"). This calls the user-defined functionReturnInitsFunc, sending"Bill"as the first parameter and"Gates"as the second parameter. The valueB.G.appears in the Immediate window. This is the return value from the function.Type
Call ReturnInitsSub("Bill","Gates"). This calls the user-defined subroutineReturnInitsSub, sending"Bill"as the first parameter and"Gates"as the second parameter. The valueB.G.appears in a message box.
Notice the difference between how you call a function and how you call a subroutine. Because the function returns a value, you must call it using a question mark. On the other hand, when calling a subroutine, you use the Call keyword.
The capability to print to the Immediate window is useful because you can test what is happening as your code executes without having to suspend code execution. It also is valuable to be able to print something to a window when you are testing, without interfering with the user-interface aspect of your code. You can test a form without being interrupted and then go back and view the values of variables and so on. Here’s how the process works:
Type
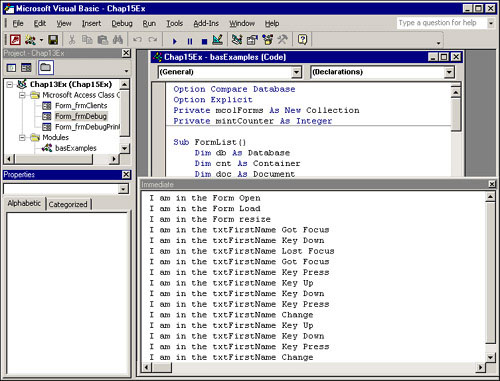
Call LoopThroughCollection. This calls the user-defined subroutineLoopThroughCollection. The valuesSkating,Basketball,Hockey, andSkiingappear. These values are printed to the Immediate window by the routine.Open the form frmDebugPrint in Form view.
Press Tab to move from the First Name field to the Last Name field.
Press Tab to move back to the First Name field.
Type your first name.
Open the Immediate window. Notice that all the statements are printed to the Immediate window. (See Figure 15.4.) These
Debug.Printstatements are coded in all the appropriate form and control events.
Note
Although it is good practice to remove Debug.Print statements when the debugging process is complete, you can safely deploy your applications without removing them. Your users will never know that the statements are in your code unless they view the Immediate window. The Debug.Print statements result in only a minor degradation in performance.
You can invoke the Access debugger in several ways:
Place a breakpoint in your code.
Place a watch in your code.
Press Ctrl+Break while the code is running.
Insert a
Stopstatement in your code.
A breakpoint is an unconditional point at which you want to suspend code execution. It is temporary because it is in effect only while the database is open. In other words, breakpoints are not saved with the database.
A watch is a condition under which you want to suspend code execution. You might want to suspend code execution when a counter variable reaches a specific value, for example. A watch also is temporary; it is removed after you close the database.
A Stop statement is permanent. In fact, if you forget to remove Stop statements from your code, your application stops execution while the user is running it.
As mentioned, a breakpoint is a point at which execution of code will be unconditionally halted. You can set multiple breakpoints in your code. You can add and remove breakpoints as your code executes.
A breakpoint enables you to halt your code execution at a suspicious area of code. This enables you to examine everything that is going on at that point in your code execution. By strategically placing breakpoints in your code, you quickly can execute sections of code that already are debugged, stopping only at problem areas.
To set a breakpoint, follow these steps:
Place your cursor on the line of code where you want to invoke the debugger.
You can insert a breakpoint in one of four ways:
Press your F9 function key.
Click in the gray margin area to the left of the line of the code that will contain the breakpoint.
Click the Toggle Breakpoint button on the Debug toolbar.
Choose Debug|Toggle Breakpoint.
The line of code containing the breakpoint appears in a different color, and a dot appears, indicating the breakpoint.
Run the form, report, or module containing the breakpoint. VBA suspends execution just before executing the line of code where you placed the breakpoint. The statement that is about to execute appears in a contrasting color (the default is yellow).
Now that your code is suspended, you can step through it one line at a time, change the value of variables, and view your call stack, among other things.
Keep in mind that a breakpoint is actually a toggle. If you want to remove a breakpoint, click in the gray margin area, press F9, or click Toggle Breakpoint on the Debug toolbar.
Breakpoints are removed when the database is closed, when another database is opened, or when you exit Access.
It is easiest to get to know the debugger by actually using it. The following example gives you hands-on experience in setting and stopping code execution at a breakpoint. The example is developed further later in the chapter.
TRY IT
Start by creating a form called frmDebug that contains a command button called cmdDebug. Give the button the caption Start Debug Process. Place the following code in the Click event of the command button:
Sub cmdDebug_Click ()
Call Func1
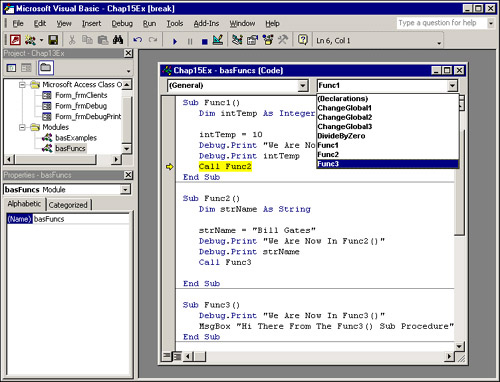
End SubCreate a module called basFuncs. Enter three functions into the module:
Sub Func1 ()
   Dim intTemp As Integer

   intTemp = 10
   Debug.Print "We Are Now In Func1()"
   Debug.Print intTemp
   Call Func2
End Sub

Sub Func2 ()
   Dim strName As String

   strName = "Bill Gates"
   Debug.Print "We Are Now In Func2()"
   Debug.Print strName
   Call Func3

End Sub

Sub Func3 ()
   Debug.Print "We Are Now In Func3()"
   MsgBox "Hi There From The Func3() Sub Procedure"
End Sub
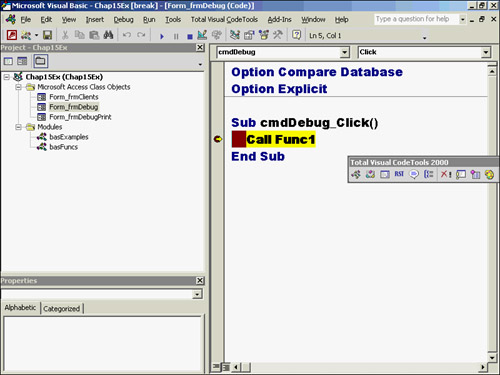
Now you should debug. Start by placing a breakpoint within the Click event of cmdDebug on the line called Call Func1. Here are the steps:
Click anywhere on the line of code that says
Call Func1.Click in the gray margin area, press the F9 function key, click the Toggle Breakpoint button on the Debug toolbar, or choose Debug|Toggle Breakpoint. The line with the breakpoint turns a different color (red by default).
Go into Form view and click the Start Debug Process button. Access suspends execution just before executing the line where you placed the breakpoint. VBA displays the line that reads
Call Func1in a different color (by default, yellow), indicating that it is about to execute that line. (See Figure 15.5.)
Access 2002 gives you three main options for stepping through your code. Each one is slightly different. The Step Into option enables you to step through each line of code within a subroutine or function, whereas the Step Over option executes a procedure without stepping through each line of code within it. The Step Out option runs all code in nested procedures and then returns you to the procedure that called the line of code you are on. Knowing the right option to use to solve a particular problem is an acquired skill that comes with continued development experience.
When you reach a breakpoint, you can continue executing your code one line at a time or continue execution until another breakpoint is reached. To step through your code one line at a time, click Step Into on the Debug toolbar, press F8, or choose Debug|Step Into.
The following example illustrates the process of stepping through your code, printing the values of variables to the Immediate window, and modifying the values of variables using the Immediate window.
TRY IT
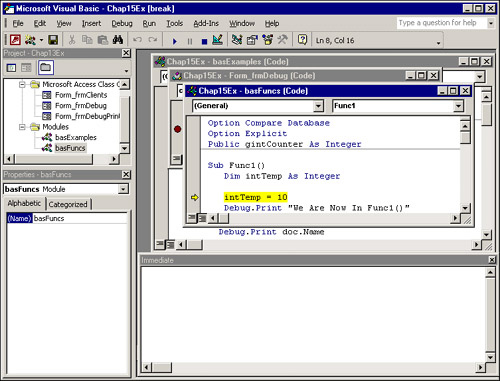
You can continue the debug process from the breakpoint you set in the previous example. Step two times (press F8). You should find yourself within Func1, about to execute the line of code intTemp = 10. (See Figure 15.6.) Notice that VBA did not stop on the line Dim intTemp As Integer. The debugger does not stop on variable declarations.
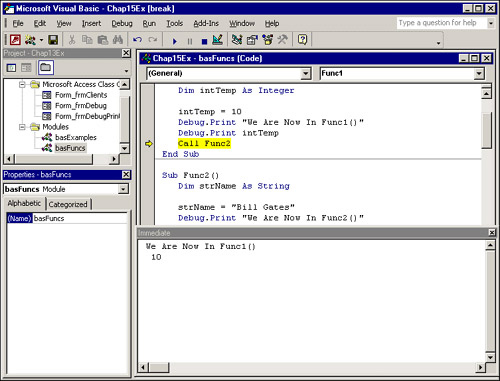
The Debug statements are about to print to the Immediate window. Take a look by opening the Immediate window. None of your code has printed anything to the Immediate window yet. Press F8 (step) three more times until you have executed the line Debug.Print intTemp. Your screen should look like Figure 15.7. Notice the results of the Debug.Print statements.
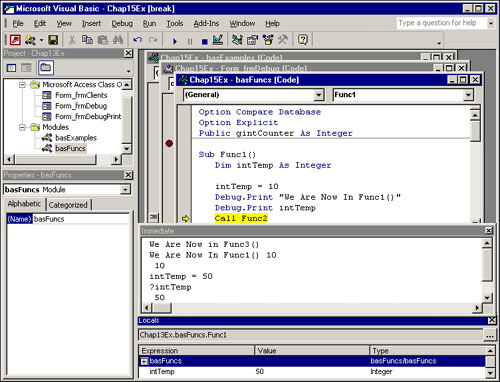
Now that you have seen how you can display variables and the results of expressions to the Immediate window, take a look at how you can use the Immediate window to modify values of variables and controls. Start by changing the value of intTemp. Click the Immediate window and type intTemp = 50. When you press Enter, you actually modify the value of intTemp. Type ?intTemp, and you’ll see that Access returns the value of 50. You also can see the value of intTemp in the Locals window. Notice in Figure 15.8 that the intTemp variable appears along with its value and type.
Suppose that you have reached a breakpoint, but you realize that your problem is farther down in the code execution. In fact, the problem is actually in a different function. You might not want to continue to move one step at a time down to the offending function. Use the Procedure drop-down menu to locate the questionable function, and then set a breakpoint on the line where you want to continue stepping. You now are ready to continue code execution until Access reaches this line. To do this, click Continue on the Debug toolbar, press F5, or choose Run|Continue. Your code continues to execute, stopping at the next breakpoint. To see how this works, continue the Debug process with the next example.
Note
You also can opt to resume code execution to the point at which your cursor is located. To do this, select Run to Cursor from the Debug menu, or press Ctrl+F8.
TRY IT
Suppose that you realize your problem might be in Func3. You do not want to continue to move one step at a time down to Func3. No problem. Use the Procedure drop-down menu to view Func3, as shown in Figure 15.9. Set a breakpoint on the line that reads Debug.Print "We Are Now In Func3()". You are ready to continue code execution until Access reaches this line. Click Continue on the Debug toolbar, press F5, or choose Run|Continue. Your code continues to execute, stopping on the breakpoint you just set. Press F5 again. The code finishes executing. Return to the Form View window.
Sometimes you already have a subroutine fully tested and debugged. You want to continue stepping through the routine that you are in, but you don’t want to watch the execution of subroutines. In this case, you use Step Over. To step over a subroutine or function, click Step Over on the Debug toolbar, press Shift+F8, or choose Debug|Step Over. The code within the subroutine or function you are stepping over executes, but you do not step through it. To experiment with the Step Over feature, follow the next example.
TRY IT
Click the open form and click the Start Debug Process button one more time. Because your breakpoints are still set, you are placed on the line of code that reads Call Func1. Select Clear All Breakpoints from the Debug menu, or use the Ctrl+Shift+F9 keystroke combination to remove all breakpoints. Step (press F8) five times until you are about to execute the line Call Func2. Suppose that you have tested Func2 and Func3 and know that they are not the cause of the problems in your code. With Func2 highlighted as the next line to be executed, click Step Over on the toolbar. Notice that Func2 and Func3 are both executed but that you now are ready to continue stepping in Func1. In this case, you are placed on the End Sub line immediately following the call to Func2.
The Step Out feature is used to step out of the procedure you are in and to return to the procedure that called the line of code you are on. You use this feature when you have accidentally stepped into a procedure that you realize is fully tested. You want to execute all the code called by the procedure you are in and then step out to the calling procedure so that you can continue with the debugging process. To test how this works, follow this example.
Place a breakpoint on the call to
Func2.Click the Reset button on the toolbar to halt code execution.
Activate the frmDebug form and click the Start Debug Process command button.
Step once to place yourself in the first line of
Func2.Supposethat you realize you just stepped one step too far. You really intended to step over
Func2and all the procedures it calls. No problem! Click the Step Out button to step out ofFunc2and return to the line following the line of code that calledFunc2. In this case, you should find yourself on theEnd Substatement ofFunc1.
After you have stepped through your code, watched the logical flow, and modified some variables, you might want to re-execute the code beginning at a prior statement. The easiest way to do this is to click and drag the yellow arrow in the margin to the statement on which you want to continue execution. If you prefer, you can click anywhere in the line of code where you want to commence execution and then choose Debug|Set Next Statement. Regardless of the method you chose, notice that the contrasting color (usually yellow)—indicating the next line of code to be executed—is now placed over that statement. You then can step through the code by pressing F8, or you can continue normal code execution by pressing F5. Access enables you to set the next line to be executed within a procedure only. This feature can be used to re-execute lines of code or to skip over a problem line of code.
The following example walks you through the process of changing the value of a variable and then re-executing code after the value is changed.
TRY IT
The preceding example left you at the last line of code (the End Sub statement) within Func1. You want to change the value of intTemp and re-execute everything.
Go to the Immediate window and type
intTemp = 100.You need to set the next statement to print on the line that reads
Debug.Print "We Are Now in Func1()". To do this, click and drag the yellow arrow from the End Sub statement to theDebug.Print "We Are Now In Func1()" line. Notice the contrasting color (yellow), indicating that the next line of code to be executed is now over that statement.Press F8 (step) two times. The code now executes with
intTempset to 100. Observe the Immediate window again. Notice how the results have changed.
You have learned how to set breakpoints, step through and over code, use the Immediate window, set the next line to be executed, and continue to run until the next breakpoint is reached. When you reach a breakpoint, it often is important to see which functions were called to bring you to this point. This is where the Calls feature can help.
To bring up the Call Stack window, click the Call Stack button on the toolbar or choose View|Call Stack. The window in Figure 15.10 appears. If you want to see the line of code that called a particular function or subroutine, double-click that particular function or click the function and then click Show. Although your execution point is not moved to the calling function or subroutine, you are able to view the code within the procedure. If you want to continue your code execution, press F8. You move back to the procedure through which you were stepping, and the next line of code executes. If you press F5, your code executes until another breakpoint or watch is reached. If you want to return to where you were without executing additional lines of code, choose Debug|Show Next Statement.

TRY IT
To test this process, perform the next example.
Click the Reset button to stop your code execution if you are still in Break mode.
Remove the breakpoint on the call to
Func2.Move to the procedure called
Func3in basFuncs. Set a breakpoint on the lineDebug.Print "We Are Now in Func3()".Run the frmDebug form and click the command button. You are placed in
Func3on the line where the breakpoint is set.Bring up the Call Stack window by clicking the Call Stack button on the toolbar. If you want to see the line of code that called
Func2fromFunc1, double-clickFunc1. Although your execution point is not moved toFunc1, you are able to view the code within the procedure. To return to the next line of code to execute, choose Debug|Show Next Statement.Press F5, and the rest of your code executes.
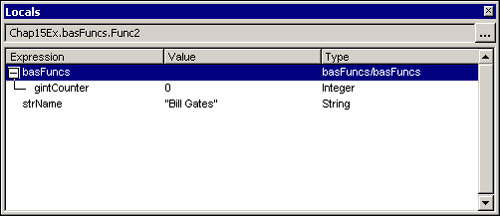
The Locals window enables you to see all the variables on the current stack frame and to view and modify their values. To access the Locals pane, click Locals Window on the toolbar, or select Locals Window from the View menu. Three columns appear: Expression, Value, and Type. The Expression column shows you the variables, user-defined types, arrays, and other objects visible within the current procedure. The Value column displays the current value of a variable or expression. The Type column tells you what type of data a variable contains. Variables that contain hierarchical information—arrays, for example—are displayed with an Expand/Collapse button.
The information contained within the Locals window is dynamic. It is updated automatically as the code executes and as you move from routine to routine. Figure 15.11 illustrates how you can use the Locals window to view the variables available with the Func2 subroutine. To try this example yourself, remove all existing breakpoints. Place a breakpoint in Func2 on the line of code that reads Debug.Print strName. Click Reset if code is still executing, and click the Start Debug Process command button to execute code until the breakpoint. Click the Locals Window button on the Debug toolbar. Click the plus sign to view the contents of the public variable gintCounter.
Sometimes it is not enough to use the Immediate window to test the value of an expression or variable. You might want to keep a constant eye on the expression’s value. Access 95 introduced the capability to set watches before running a procedure or while code execution is suspended. After a Watch expression is added, it appears in the Watch window. As you’ll see, you can create several types of watches.
The quickest and easiest way to view the value contained within a variable is to use Auto Data Tips, which is an option for working with modules. This feature is available only when your code is in Break mode. While in Break mode, simply move your mouse over the variable or expression whose value you want to check. A tip appears with the current value. To set the Auto Data Tips option from the Visual Basic Editor (VBE), choose Tools|Options, click the Editor tab, and check the option for Auto Data Tips, which is under the Code Settings options.
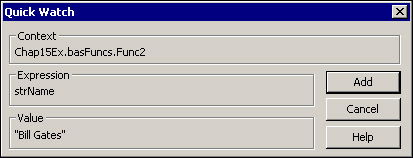
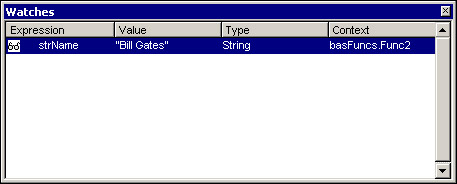
A quick watch is the most basic type of watch. To add a quick watch, highlight the name of the variable or expression you want to watch and click the Quick Watch button on the toolbar. The Quick Watch dialog box, shown in Figure 15.12, appears. You can click Add to add the expression as a permanent watch or choose Cancel to view the current value without adding it as a watch. If you click Add, the Watches window appears, like the one in Figure 15.13. This window is discussed in more detail in the next section.
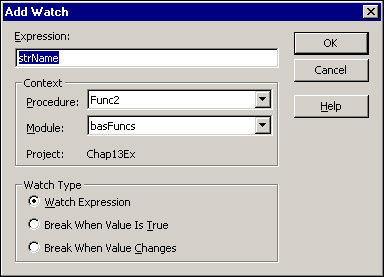
As you saw, you can add a Watch expression using a quick watch. Adding a watch this way does not give you full control over the nature of the watch, however. If you need more control over the watch, you must choose Debug|Add Watch. The Add Watch dialog box appears, as shown in Figure 15.14.
Tip
If you add a quick watch or you add a watch by choosing Debug|Add Watch, you easily can customize the specifics of the watch by clicking with the right mouse button over the watch in the Watches window. Then select Edit Watch.
Tip
A quick way to add a watch to the Watches window is to click and drag a variable or expression from a Code module into the Watches window. The watch is added with default settings.
In the Expression text box, enter a variable, property, function call, or any other valid expression. It is important to select the procedure and module in which you want the expression to be watched. Next, indicate whether you want to simply watch the value of the expression in the Immediate window, break when the expression becomes True, or break whenever the value of the expression changes. The two latter options are covered in detail in the following sections.
The next example walks you through the process of adding a watch and viewing the Watch variable as you step through your code. It illustrates how a variable goes in and out of scope, and changes value, during code execution.
To begin, stop code execution if your code is running, and remove any breakpoints you have set.
Click within the
strNamevariable inFunc2.Right-click and choose Add Watch.
Click OK to accept the
Func2procedure as the context for the variable and basFuncs as the module for the variable.Set a breakpoint on the line
strName = "Bill Gates".Run the frmDebug form and click the command button. View the Watches window and notice that
strNamehas the value of a zero-length string.Step one time and notice that
strNameis equal toBill Gates.Step three more times. Notice that, although you are in the
Func3routine,strNamestill has the valueBill Gates. This is because the variable is still in memory in the context ofbasFuncs.Func2.Step four more times until you are back on the
End Substatement ofFunc2. ThestrNamevariable is still in context.Step one more time. The
strNamevariable is finally out of context becauseFunc2has been executed.
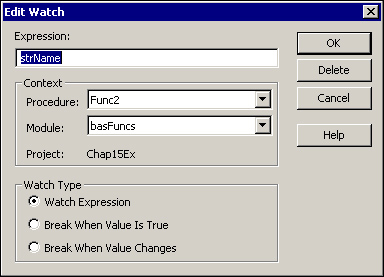
After you add a watch, you might want to edit the nature of the watch or remove it entirely. You use the Edit Watch dialog box to edit or delete a Watch expression. Follow these steps:
Activate the Watches window.
Select the expression you want to edit.
Choose Debug|Edit Watch, or right-click and choose Edit Watch. The dialog box in Figure 15.15 appears.
Make changes to the watch or click Delete to remove it.
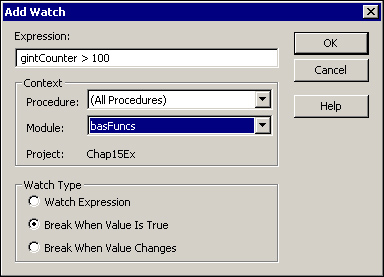
A powerful aspect of a Watch expression is that you can break whenever an expression becomes True. You can break whenever a Public variable reaches a specific value, for example. You might want to do this when a Public or Private variable somehow is being changed, and you want to find out where. Consider the following code, located in the basFuncs module of CHAP15EX.MDB:
Sub ChangeGlobal1()
   gintCounter = 50
   Call ChangeGlobal2
End Sub

Sub ChangeGlobal2()
   gintCounter = gintCounter + 10
   Call ChangeGlobal3
End Sub

Sub ChangeGlobal3()
   Dim intCounter As Integer
   For intCounter = 1 To 10
      gintCounter = gintCounter + intCounter
   Next intCounter
End Sub
You might find that gintCounter somehow is reaching a number greater than 100, and you are not sure how. To solve the problem, add the watch shown in Figure 15.16. Notice that the expression you are testing for is gintCounter > 100. You have set the breakpoint to break the code whenever the expression becomes True. To test the code, type ChangeGlobal1 in the Immediate window and press Enter. The code should break in the ChangeGlobal3 routine, indicating that this routine is the culprit.
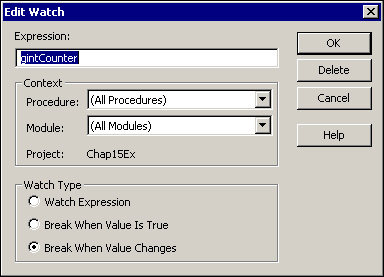
Instead of breaking when an expression becomes True, you might want to break whenever the value of the expression changes. This is a great way to identify the place where the value of a variable is mysteriously altered. Like Break When Value Is True, the Break When Value Changes option is great for tracking down problems with Public and Private variables. Notice the watch being set in Figure 15.17. It is in the context of all procedures within all modules. It is set to break whenever the value of gintCounter changes. If you execute the ChangeGlobal1 routine, you’ll find that the code halts execution within ChangeGlobal1 immediately after the value of gintCounter is set to 50. If you press F5 to continue execution, the code halts within ChangeGlobal2 immediately after gintCounter is incremented by 10. In other words, every time the value of gintCounter is modified, the code execution breaks.
As you are testing, you often discover runtime errors that are quite easy to fix. When a runtime error occurs, a dialog box similar to the one shown in Figure 15.18 appears.
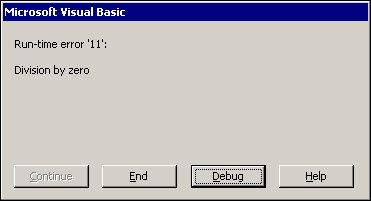
If you click Debug, you are placed in the Code window on the line that generated the error. After rectifying the problem, click the Continue button on the toolbar, or choose Run|Continue.
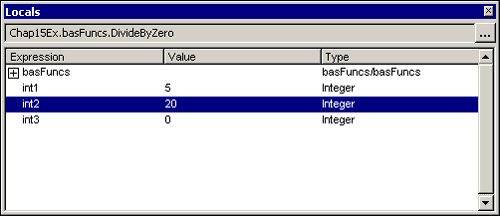
Figure 15.19 shows the locals window after Debug was clicked from the Runtime Error dialog box and the value of int2 was set to 20. Code execution now can continue without error.
Often, after an error occurs, VBA displays a message giving you the option of resetting your code. If you opt to reset your code, all variables (including Publics and Statics) lose their values. You also can click Reset on the toolbar. You must decide whether it is better to proceed with your variables already set or to reset the variables and then proceed.
Note
The General tab of the Options dialog box allows you to configure how VBA error handling and the debugger interact. The available options are discussed in Chapter 16, “Error Handling: Preparing for the Inevitable.”
Although the Access debugger is excellent, the debugging process itself is wrought with an array of potential problems, as follows:
The debugging process can interrupt code execution, especially when forms are involved. When this occurs, the best bet is to place
Debug.Printstatements in your code and examine what happens after the code executes.Along the lines of the previous problem, it is difficult to debug code where
GotFocusandLostFocusevents are coded. Moving to the VBE triggers theLostFocusevent of the control. Returning to the form causes theGotFocusevent of the control to be triggered. Once again, a great solution isDebug.Print. You also might consider writing information to an error log for perusal after the code executes.Many methods of the DoCmd object cannot be successfully executed during debugging. An example is
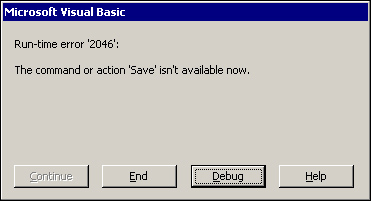
DoCmd.RunCommand accmdSaveRecord. When executed in the debugger, this line of code renders the error shown in Figure 15.20.Code that uses
Screen.ActiveFormandScreen.ActiveControlwreaks havoc on the debugging process. When the VBE is active, there is no active form and no active control. Avoiding these lines in your code wherever possible alleviates this problem.Finally, be aware that resetting code can cause problems. If you are modifying environmental settings, you are left with whatever environmental settings your application code changed. If you continue execution after the error without resetting, all sorts of other problems can occur. It is a good idea to code a special utility routine that resets your environment.
Assertions are used to ensure that, if a certain state is encountered, the debugger is invoked. The following code, found in basExamples, is an example:
Sub Assertion()
    Dim intAge As Integer
    intAge = InputBox("Please Enter Your Age")
    Debug.Assert (intAge >= 0)
    MsgBox "You are " & intAge
End Sub
In this example, a variable called intAge is set equal to the value entered into an Input Box. The Debug.Assert statement “asserts” that the value entered is greater than or equal to zero. If it is, code execution proceeds as expected. If the assertion is incorrect, the debugger is invoked.
It is a good idea to include a comment as to why an assertion might fail. By doing this you will facilitate the process of responding to the situation when it occurs. Also, it is important to realize that, if you deploy your application with Debug.Assert statements intact, you will receive a technical support call when an assertion fails, and your user is placed in the debugger without warning!
The following tips will make your life much simpler and easier when debugging:
Before starting to debug, be clear about what the problem is. Make sure that you get all of the necessary information from the user as to what they did to generate the problem. Without this vital information, you can spend countless hours trying to reproduce the problem rather than solve it.
Make changes one line of code at a time. I have seen many hot-shot developers attempt to change multiple lines of code simultaneously. Instead of correcting the problem they initially set out to solve, they generate a multitude of additional problems.
Talk the problem out with other developers. Sometimes the process of simply verbalizing the problem can be enough to help you to figure it out. If verbalizing the problem doesn’t provide you with the answer, the person that you are verbalizing to might know the answer.
When all else fails, take a break. Many times I have stayed up into the wee hours of the night, attempting to solve a problem. After finally giving up, I surrender and go to bed. It’s amazing how many times I solve the “unsolvable” problem from the night before while in the shower the next morning!
If programming were a perfect science, there would be no reason to use a debugger. Given the reality of the challenges of programming, a thorough understanding of the use of the debugger is imperative. Fortunately, the Access 2002 VBE provides an excellent tool to assist in the debugging process.
This chapter began by showing you how you can reduce the chance of bugs within your application in the first place. It then taught you how to use the Immediate window to test and change the values of variables and properties. You learned how to use watches and breakpoints, as well as how to view the call stack. All these techniques help make the process of testing and debugging your application a pleasant experience.