
CHAPTER |
|
14 |
Marker Clustering: Handling Many Markers on the Map |
In Chapter 7, you learned how to use markers to identify features on the map. You have also seen how to handle the click event on a marker, and you’ve learned several methods of displaying additional information about the selected marker. The preceding chapters included examples of handling markers on a map, even from within Windows applications.
There’s a special, yet rather common, situation that I haven’t discussed yet: how to handle maps with too many markers. More often than not, maps contain multiple markers. Displaying a few markers on the map is a simple process, but what if you want to mark a large number of features on the map? Technically, you can add any number of markers to a map. But as the number of markers on the map increases, you’ll have to deal with two problems: Your application will become sluggish and the drag operations will make your application less and less responsive. In addition, when users zoom out, the map will be covered with markers. Figure 14-1 shows a map with the locations of 9,000 airports around the world. The data for the airports, which is included in the sample scripts of this chapter, was obtained from http://openflights.org/data.html. The data at this site is free, but if you find it useful, you can give a donation to keep the site going. When you view a large portion of the globe, the markers cover all but the least populated parts of the planet. This chapter explores techniques to handle maps with a very large number of markers; there are several approaches. The first idea that comes to mind is to use smaller icons for the markers, right? Even so, the United States and Europe will be totally covered with markers. For a smaller marker icon, consider the following image (you’ll find differently colored versions of the same pin at this location):
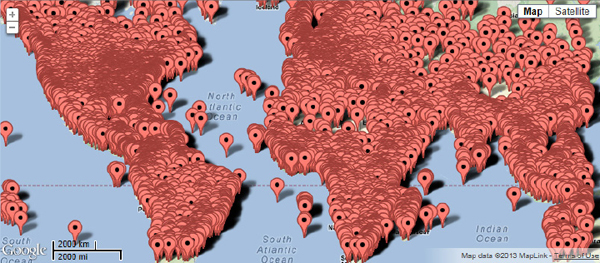
Figure 14-1 Placing too many markers on the map results in crowded maps and sluggish performance.
Then, in each marker’s declaration, assign the
smallPin variable to the marker’s icon property.Handling Maps with Too Many Markers
If there are too many markers to display on your map, you must redesign your application and somehow reduce the number of markers. A functional application shouldn’t overwhelm the user with data; it should display only as many markers as can fit comfortably on the map. The markers shouldn’t cover the map’s features, not to mention that too many markers convey very little information, except perhaps for the density of the points of interest. Handling maps with too many markers is more common than you think and there are a few tools that will help. But before exploring any specialized tools, let’s start with design principles based on common sense.
As the number of markers increases, the application becomes less responsive—or quite sluggish, depending on the number of markers on the map. The first rule is to not display the markers that are not visible. It makes absolutely no sense to create markers that lie outside the current viewport. If you have up to a few hundred markers, then go ahead and place them all on the map. As users drag the map, all markers will be in place and will appear instantly. If you have a few thousand markers, however, then the invisible markers will bog down your application. Display only the markers that are visible. You can include the ones just outside the visible part of the map to be prepared for small displacements, but loading thousands of invisible markers on the map is a common mistake.
Another common sense technique to avoid the display of too many markers on the current viewport is to display a subset of the markers at small zoom levels. If possible, assign a detail level to each marker and don’t show the markers with a detail level less than the current zoom level. If you’re displaying cities, for example, it’s reasonable to not display all towns with a population of less than 10,000 at the state level. As users zoom in, then you can display the smaller towns. At that time, the viewport is fairly limited and only a small number of markers will become visible. The two techniques mentioned here require some programming, but nothing special.
Another method of reducing the visible markers on the map is to filter the various features. You can design a page that gives users the option to see only a subset of the markers on the map. If you’re displaying the airports in a country, for example, you might want to view the airports near a specific location, airports for international flights, small/large airports, and so on. If you attempt to display all airports in the world, the entire map will be covered with markers with the exception of the deserts and certain countries in central Asia. Sometimes you need to see the density of airports around the world, and there are special graphs, called heatmaps, which map the density of data points to gradients. Heatmaps use color to represent the density of a large number of data points—you will actually see such maps in Chapter 18. Heatmaps represent the density of the data with a color range but no individual data items.
In certain situations, however, you need to display a large number of markers on the map. There are two ways to handle the markers without overloading the map. To make such a map meaningful, you must limit the zoom level. It makes no sense to display 9,000 airports on the map and zoom out to continent level. You can let users view the markers in a small section of the map, but then you need a mechanism to display only the markers that fall within the current viewport. Otherwise, your application will be sluggish because of the large number of markers that are not even visible.
Another interesting approach is to cluster markers together and display a single marker that represents a large number of individual markers over small areas of the map. There’s actually a third-party component you can use to perform the clustering, the
MarkerClusterer component, which is presented a little later in this chapter. The MarkerClusterer component clusters a number of markers that are close to each other into a single marker. As you zoom in, the cluster marker breaks up into individual markers, or smaller clusters.Display Markers as You Go
The first method of handling a large number of markers is demonstrated by the
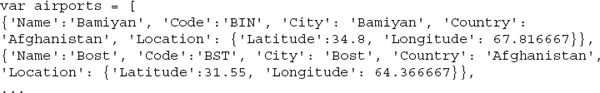
Map with Many Markers.html web application, which is shown in Figure 14-2. An array in the script holds the data for 9,000 airports. Listing 14-1 shows the definitions of the first two elements of this array.
Figure 14-2 The Map with Many Markers application adds only the markers that are visible in the current viewport.
Listing 14-1 An array of custom objects representing airports
The script selects the airports that fall in the current viewport, creates a marker for each one of them, and then places the markers on the map. This process is repeated every time the user changes the map’s viewport, and this may take place either after a zoom operation or after a drag operation. Both actions are captured by the
bounds_changed event, and this event is associated with a listener that places the visible markers on the map.If the user zooms out far enough, he or she may end up filling the map with markers. The technique presented in this section doesn’t decongest the map; it simply makes the map more manageable by placing on the map only the visible markers. If the user zooms out at continent level, the map will become crowded. Actually, it will become so crowded, that you’ll end up seeing only markers and oceans, with the markers outlining the continents. To make this approach a little more functional, you can select a minimum zoom level for each marker. If you had data about the number of passengers arriving at each airport per year, you could skip the “smaller” airports at small zoom levels. As the user zooms in, the less “busy” airports will become visible. It’s also reasonable to assume that viewers are interested in exploring airports in a specific part of the world and impose a minimum zoom level. You can set the map’s
minZoom property to 5 or 6, which corresponds roughly to country level. Sensible users shouldn’t even attempt to view all airports at once, but users are known to abuse applications in any way imaginable.To help readers locate the desired airport, a table with data about the selected airports is placed below the map. This table, which is a navigational tool, contains one row per airport and displays the airport’s name and code, as well as its location. If you had more data about the airports, this would be the place to show it. The airport codes are links and when you click them, the corresponding marker on the map is selected. The selected map bounces a couple of times and then an info window is displayed for this marker. Likewise, when you select a marker on the map, the corresponding table row is highlighted.
Designing the
Map with Many Markers PageLet’s design an application for displaying only the markers in the current viewport—which is the
Map with Many Markers.html web page. First, the code adds an event listener for the bounds_changed event, which occurs when the viewport changes. At that time, the markers on the map must be updated, an action that takes place from within the showMarkersInViewport() function. Every time the user changes the viewport, either by dragging the map or by zooming in or out, the showMarkersInViewport() function is executed:The
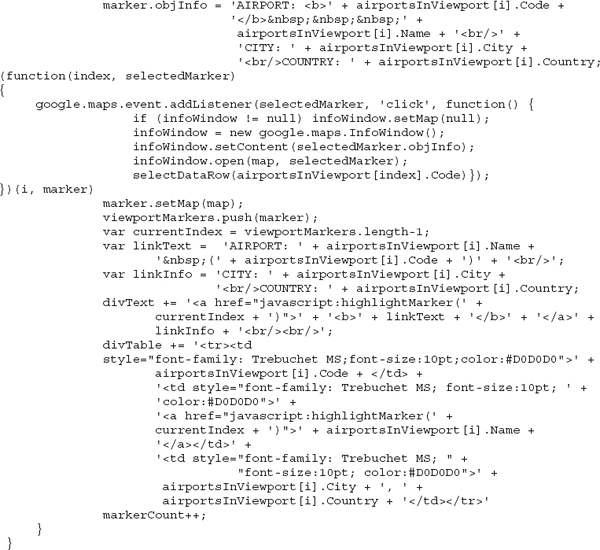
showMarkersInViewport() function iterates through the airportsInViewport array, which contains the airports that belong to the current viewport. For each airport, it creates a new marker and sets its position and title attributes. In addition, it sets the marker’s objInfo property to an HTML fragment that will be displayed when the user clicks the marker. To display the info window, the script adds a listener for the marker’s click event. The event listener is a typical function that creates an InfoWindow object with the data that describes the selected airport and opens it. The last few statements generate the <tr> element corresponding to the current airport and add it to the table below the map. This is just HTML code, which uses styles to achieve the visual effect shown in Figure 14-2. Listing 14-2 shows the showMarkersInViewport() function.Listing 14-2 The
showMarkers InViewport() function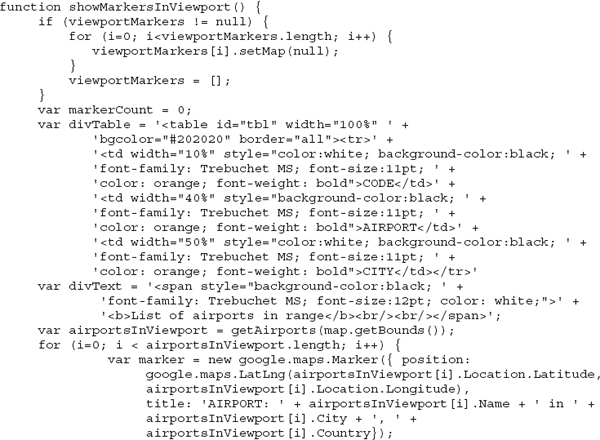
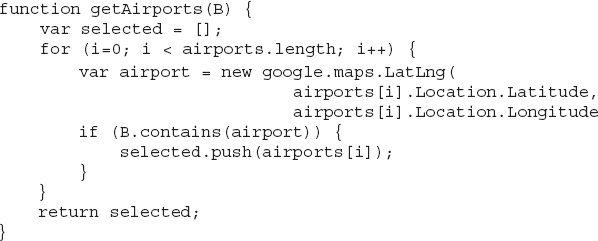
The
getAirports() function, shown in Listing 14-3, accepts as an argument a bounding box, which is a LatLngBound object that delimits the current viewport, and selects the elements of the airports array that fall within that box. The selected airports are stored in the selected array, and this array is returned to the caller.The function very quickly iterates an array of 9,000 airports and selects the ones that match the spatial criteria. In Chapter 15, you replace the call to a function with a call to a web service that looks up the same airports in a database and selects some of them based on the same criteria. Even with the
getAirports() function, shown in Listing 14-3, you can follow the code that displays a small number of markers on the map depending on the map’s zoom level and location.Listing 14-3 The getAirports() function
Note the in-place function that adds the
click event listener to the current marker in Listing 14-1. As explained in Chapter 4, when you add event listeners that rely on a variable that changes with each iteration of the loop, you must use closures to make sure that the listener will be called with the appropriate arguments for each marker. For more information on closures, refer to Chapter 4.The MarkerClusterer Component
The
MarkerCluster, a third-party tool that’s available from Google, allows you to cluster markers together. As users zoom in, clusters break up into smaller ones and finally into individual markers. Figure 14-3 is a typical example of clustered markers. The map shown was generated by the application Clustered Markers Demo.html and the markers correspond to U.S. cities. The map shows various clusters of different sizes. The MarkerClusterer component uses a grid-based algorithm, which divides the map into a grid and clusters the markers in each square into a single one. The script that implements the Marker Cluster component can be found at http://google-maps-utility-library-v3.googlecode.com/svn/trunk/markerclusterer/src/markerclusterer.js. You can also download the file to your own web server and add a reference to it in your project.
Figure 14-3 When too many markers fall in a small area of the map, the
MarkerClusterer component clusters them into a single marker with a custom icon.Clustering your markers is as simple as creating a new instance of the
MarkerCluster object and passing to its constructor an array with the markers. Each cluster stands for a number of individual markers, and the number of markers in a cluster is indicated by the cluster icon’s color, as well as the number in each cluster icon. The densest clusters, ones with more than 10,000 markers, are colored with a deep purple color. The next densest clusters are colored purple, and then red, yellow, and blue for the least dense clusters. A map with over 10,000 markers in a single cluster is probably too busy no matter how you look at it. To experiment with the MarkerClusterer component, you will find the Clustered Airports.html sample page, which displays a little over 9,000 markers that correspond to airports and can be used as a test bed for mapping applications with many markers. Both Chrome and Internet Explorer handle the markers pretty well.To use the
MarkerClusterer component, you must reference the following script in your code (or copy the file at your web server and adjust the src attribute of the <script> tag accordingly):The sample application’s code is simpler than the code used in the preceding examples. Here are the statements that generate the overlay on the map:

The
createMarkers() function goes through the airports and creates the individual markers, as usual. It just doesn’t place them on the map. This action takes place in the MarkerClusterer object’s constructor, which accepts as arguments a Map object and the array with the markers. It also accepts a third argument with options. The MarkerClusterer options are the grid’s size and a maximum zoom level, after which all markers are displayed individually, even if there are multiple markers in the same grid square. The algorithm breaks up the map into a grid and clusters together all markers that fall in the same cell of this grid. It may happen that a cell contains a few dozen markers, which are all clustered together into a single multi-point marker, and one of the neighboring cells contains just a single marker, which can’t be clustered.NOTE The
CreateMarkers() function populates an array with markers that are constructed with data already embedded in the script. Later in this book, you’ll see a different implementation of the same function that doesn’t rely on local data. Instead, it will request its data from a web service and will read only the markers in the current viewport. With this implementation, you won’t have to download a huge dataset to the client and your script won’t get bogged down by data that the user doesn’t need.Open the application and see how the
MarkerClusterer component handles the markers. As you zoom in, clusters break up into smaller ones. If a grid square contains a single marker, this marker is displayed without a cluster. Experiment with the grid size setting to understand how the MarkerClusterer handles many markers that fall close to each other at any given zoom level and find out the best grid size for your data.The
MarkerClusterer component provides quite a few methods. The addMarker() and addMarkers() methods add a single marker and an array of markers to a MarkerClusterer object, respectively. Use these methods to update the clusters as more data become available. To remove a marker, call the removeMarker() method passing the marker to be removed as an argument. To remove all markers from the map, just call the removeMarkers() method without any arguments. The getTotalClusters() and getTotalMarkers() methods return the total number of clusters on the map and the total number of markers being clustered. Unfortunately, there’s no method to retrieve the number of markers per cluster, or the individual markers that make up a cluster.Ultimately, you can get as creative as you wish when it comes to handling maps with too many markers. For example, you can create a set of markers that represent clustered markers and display the overview data at certain zoom levels. The overview data could include a single marker for each country or state. When users click one of these markers, you can display the markers in the selected country, even if it’s not the only country visible on the map.
Another approach is to use clusters up to a certain zoom level and then switch to individual markers. When the zoom level is less than 5, for example, you can display a set of markers that correspond to states (one marker per state). This marker represents all cities in the state, and you can set their title to the state name and the number of cities grouped by that marker. When users exceed a specific zoom level, you can switch to another set of markers that represent cities.
Summary
Markers are the trademark of Google Maps and being able to create maps with many markers is a technique you need to master. In this chapter, you saw how to handle a large number of markers on the map, either by limiting the number of visible markers, or through the use of an external component for grouping the markers. The downside of the approaches presented in this chapter is that all markers are defined in the script and are immediately available to your script.
A totally different approach is to limit the number of data items downloaded to the client and to write a script that requests only the data items that fall in the map’s current viewport. If you can write a web service to retrieve only the markers in the current viewport, then the client application will never have to download nearly 10,000 airports at once. A web service is a special kind of program that exposes methods that can be called from a remote computer. The service is executed on a server and returns the requested dataset. Then, you can use simple techniques in your script to create a marker for each data point and place it on the map.
Even if you don’t plan to write your own web service, you can still take advantage of other people’s web services and use their data to generate annotated maps, as explained in the following chapter.
..................Content has been hidden....................
You can't read the all page of ebook, please click here login for view all page.