


5.4.2.2.5 Production process
There are three alternatives based on the operating pressure at the reactor: high pressure (250–300 atm), medium pressure (100–250 atm), and low pressure (50–100 atm). In all cases the process consists of three stages; see Fig. 5.41 for a typical configuration.

Syngas production: Fig. 5.41 shows a scheme of the production of methanol from natural gas reforming consisting of desulfurization of the methane and removal of H2S, saturation of the methane with water, prereforming, and primary and secondary reforming. Part of the methane is burned to provide the energy to the endothermic reaction, and also to heat up the natural gas. The proper H2-to-CO ratio is around 2. Other technologies for syngas production can be used as presented in the first section of this chapter.
Methanol synthesis: Step reaction that is 50% of the equilibrium at most, operating at 200–300°C and under pressure. Methanol and water are condensed and the unconverted gases recycled:
High-pressure operation: Operating at 25 MPa, zinc oxide–chromium oxide catalysts are used in five bed reactors. Dimethyl ether and water are also produced.
Low-pressure operation: Since 1923 these have been the typical plants. Operating around 50 atm and using copper-based catalysts, this operation uses reactors such as the one in Fig. 5.36.
Distillation of a water–methanol mixture: The liquid mixture is separated.
Example 5.12
The production of methanol yields a stream with 45% molar methanol and the rest water. The requested purity of methanol is 97%, and the residue is assumed to have 5% methanol. The column processes a saturated liquid mixture with an L/D ratio of 1.5. Calculate the flow of distillate and residue, and the number of trays, assuming that each tray has an efficiency of 70%. Assume that the mixture behaves as ideal.
Solution
Assuming that Raoult’s Law holds, and using Antoine’s correlation for the vapor pressures, we draw the XY diagram for the mixture:
where

Assuming that the liquid and vapor flows remain almost constant along the columns in each region, we have the rectifying and stripping operating lines by performing a mass balance to the condenser and the reboiler as follows:
Since we have the information on the reflux ratio, we compute the slope and the intercept. We perform a mass balance to the condenser as follows:
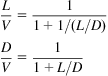
Thus,
| L/D | 1.5 |
| L/V | 0.6 |
| D/V | 0.4 |
xD=0.97, according to the information provided. Thus we plot the operating line at the rectifying section. The operating lines intercept at the q line.
Since the feed is saturated liquid, the q line is vertical, and with the rectifying section operating line we can also plot the stripping section operating line; see Fig. 5E12.1 The intercept is given for x=0.45. Solving yn from the operating line, yn=0.67 (Fig. 5E12.1).

We need eight theoretical trays. The actual number is given as follows:
By performing a global mass balance and another one to the most volatile, using a total feedstock of 100 kmol, we have:
| F | D | R | |
| Total | 100 | 43.4782598 | 56.5217402 |
| CH3OH | 45 | 42.173912 | 2.82608701 |

5.4.2.3 Syngas reaction to Fischer–Tropsch liquids
The desired products determine the operating conditions in terms of temperatures and pressures (from 10 to 40 bar), and the catalyst type employing either cobalt- or iron-based catalysts. For the production of gasoline and small hydrocarbons, currently iron-based catalysts are used, operating at high temperatures (300–350°C)—ie, high-temperature Fischer–Tropsch (HTFT). If diesel or heavier products are to be obtained, either cobalt-based or iron-based catalysis can be used. The reactors will operate at lower temperature (200–240°C), ie, low-temperature Fischer–Tropsch (LTFT). The iron catalyst provides high selectivity for C10–C18, which means a higher yield of diesel. Cobalt catalysts typically do not allow WGSR, and require higher H2-to-CO ratios. Moreover, the reactions with iron catalyst are usually conducted at 30 bar. Furthermore, FT synthesis requires careful control of the H2:CO ratio to satisfy the stoichiometry of the synthesis reactions as well as to avoid deposition of carbon on the catalysts (coking). An optimal H2:CO ratio from 1:1 to 2:1 for the production of diesel and gasoline is recommended (Dry, 2002, Swanson et al., 2010).
5.4.2.3.1 Mechanisms
The main reactions can be seen below. The first reaction corresponds to methanation, the second is the WGS reaction, and the third reaction is the Boudouard reaction. The methanation reaction and the Boudouard reaction are undesirable:

The reaction to produce hydrocarbons given below is the desired one, and is the most dominant reaction when applying cobalt-based FT catalyst. When using iron-based catalyst, the WGS reaction also readily occurs, enabling the operation at a lower temperature.

The details for the elementary chemical steps on the surface of the catalysts are unclear, but it is widely accepted that a stepwise chain growth process is involved. Fig. 5.42 shows the polymerization-based mechanism. Large hydrocarbon chains are believed to be produced through the dissociation of CO. At each stage of the growth process, the surface species (at first, surface carbon) have the option of desorbing to produce alkenes, or to be hydrogenated to desorb as an alkane, or to continue the chain growth process by adding another CH2. Fischer–Tropsch liquids can be refined to various amounts of renewable (green) gasoline, diesel fuel, and aviation fuel depending upon process conditions.

Botao et al. (2007) presented the following kinetic mechanism where “rds” represents limiting steps.

5.4.2.3.2 Reactor types
Four main types of reactors are used within FT facilitates. From left to right in Fig. 5.43 we have circulating bed, typically used from 1950 to 1987 for HTFT, with a production capacity of 2–6.5 kbdp. To the right there is the multitubular reactor, used from 1950 to 1985 for LTFT, with production capacities of 0.5–0.7 kbdp. The second generation of reactors from the 1980s–90s includes the fixed fluidized bed (Synthol reactor) from 1989, with a production capacity of 11–20 kbdp, used for HTFT; and the fixed slurry bed, introduced in 1993 for LTFT, with production capacities of 2.5–17 kbdp.

5.4.2.3.3 Syngas production and synthesis
The alternative technologies for the production of FT liquids came from the combination of the various technologies available for each step, from the processing of the various raw materials, gas cleaning, catalysts employed, and the type of reactor. In Table 5.6, a few of the main companies producing FT liquids are compared with regards to the decision on the technologies that constitute their characteristic flowsheets.
Table 5.6
Alternative Processes for FT Production

The entire flowsheet for the production of FT liquids consists of syngas production, purification, and composition adjustment. After that, the FT reactor is used to produce the hydrocarbon mixture. There are two alternatives as mentioned above: LTFT and HTFT. The product distribution is a direct function of them and the ratio of the H2-to-CO feed to the reactor.
5.4.2.3.4 Product distribution
To determine the composition of the products as a function of the operating conditions at the reactor, the Anderson–Schulz–Flory (ASF) distribution has typically been used. It assumes that the FT reactor operates as a polymerization reactor. The fraction of mass of the hydrocarbons i=number of C, and wi depends on the probability of chain growth, α.
(5.28)
According to the studies by Song et al. (2004), α is a function of the temperature and the ratio CO-to-H2, as follows:
(5.29)
Fig. 5.44 shows the effect of α on the composition of the products. Diesel is produced as the main component for values of α around 0.9 using LTFT. Gasoline requires slightly lower values of α, 0.7–0.8, and HTFT.

5.4.2.3.5 Product upgrading and refinery processes
The product stream from an FT reactor is separated and treated to obtain fuels. This stream can be very similar to crude oil, and the same upgrading methods are common to a regular refinery.
HTFT: The exit of the FT reactor is separated, obtaining the decanted oil (DO) fraction, the stabilized light oil (SLO) fraction, the condensate, and the aqueous phase. The condensate allows production of ethylene, propylene, and monomers using cold separation. From the SLO fraction, an atmospheric distillation unit allows the production of chemicals and gasoline. The heavy products from the atmospheric distillation are fed to the vacuum column together with the DO fraction, which allows production of light vacuum gas oil and heavy vacuum gas oil. From the bottoms we get wax. The most widely used method for upgrading the wax produced in FT reactors is hydrocracking, which allows the production of liquefied petroleum gases (LPGs): gasoline and diesel. This process combines the hydrogenation and cracking of the heavy oil. Therefore, the catalyst is bifunctional. Cracking is obtained using acidic support—ie, zeolites or amorphous silica alumina—while hydrogenation is imparted by metals such as Pd, Pt, Mo, Wo or Co, and Ni. The advantage is that it is possible to process a wide range of feedstocks (with high distillate selectivity) to naphtha and diesel—typically around 60% diesel and 30% naphtha—operating at 370°C and 7 MPa. It is an exothermic process, but it is expensive. Fluid catalytic cracking (FCC) is another option to break down large hydrocarbons. The process uses a sand-like material as catalyst, and heat. The catalyst is circulated from the reactor and the regenerator. The reactor typically operates at about 715°C and 3.4 bar. On the catalyst, carbon is deposited, and the regenerator, operating at 1.7 bar, burns the coke, heating up the catalyst. This energy is used to vaporize the feedstock and to carry out the endothermic cracking reactions. The product stream, consisting of a gas phase containing light hydrocarbons, gasolines, light and heavy oils, and slurry oil, is sent to fractionation. Fig. 5.45 shows a scheme of the operation of such an upgrading process.

LTFT: The wax and condensate obtained from the FT reactor are cracked to obtain LPGs (gasoline and diesel) using hydrocracking or FCC.
5.4.2.4 Use of CO2 to chemicals
Lately, various catalysts have been developed for the hydrogenation of CO2 to fuels. Typically, those that allow reverse WGSR are the ones suitable for this operation. Thus, sufficient concentration of hydrogen is required (Riedel et al., 1999). Below we present the main equilibria involved in the production of the same chemicals as above, but from CO2. The mechanism consists of a large number of steps (up to 49) involving more than 30 species (Grabow and Mavrikakis, 2011).
Methane has been produced using metal catalysts such as Ni, Ru, Fe, Co, Pd, or Rh supported on Al2O3 (Janke et al., 2014) following these reactions:
(5.28)
(5.29)
The equilibrium constants can be found in Roh et al. (2010), where T is in K and P in kPa.
(5.30)
 (5.30)
For methanol production, catalysis based on Cu, Zn, Cr, and Pd is used, such as Cu/ZnO supported on Al2O3. Zr can be used as an efficient promoter (Jadhav et al., 2014). The reactions are as follows:
The values of the equilibrium constants for reactions are computed using Eqs. (5.31) and (5.32) (Chinchen et al., 1988).
(5.31)
 (5.31)
(5.32)
 (5.32)
For FT fuels, the reactions are as follows:
So far the yield is nowhere comparable to the one from syngas (Riedel et al., 1999, Rodemerck et al., 2013).
5.4.2.5 Methanol to gasoline (MTG)
This is a technology based on the dehydration of methanol to dimethylether (DME) and its subsequent use to produce olefins (Exxonmobil, 2014). Methanol is vaporized and fed to a DME reactor, which is a fluidized bed reactor that uses ZSM-5 catalyst. The feed enters at 300–320°C and 14.5 bar. It is highly exothermic, 1740 kJ/kg of methanol. Therefore, heat removal is an issue. The effluent of this reactor, at 400–420°C, is mixed with the recycle gas from the methanol to gasoline (MTG) reactors and fed to the MTG reactors. This recycle helps control the temperature:
The conversion of the process is close to 100% and yields 1% gas, 5% LPG, 38% gasoline, and 56% water. For the organic phase we have a composition of 0.7% CH4, 0.4% C2H6, 0.2% propylene, 4.3% propane, 1.1% butylenes, 10.9% butane, 82.3% naphtha, and 0.1% oxygenates.
The water produced is removed from the organic phase and sent to a train of columns to recover the C2 fraction (de-ethanizer column), LPG (stabilizer or de-butanizer column), and light and heavy gasoline (splitter). While most of the de-butanizer bottoms (stream containing C5+) are sent to the gasoline splitter, a small portion of the de-butanizer is recycled to the de-ethanizer column to act as a lean oil solvent. This stream helps in the separation of the gases. After this stage, the heavy gasoline containing C9+ hydrocarbons is treated. This stream contains durene. It is an undesirable product that is responsible for carburetor “icing” due to its high melting point. The treatment is conducted with a Heavy Gasoline Treater (HGT). This stage removes durene via hydrogenation. The liquid obtained is stabilized in a stripper column and combined with the light gasoline from the de-butanizer. (Jones and Zhu, 2009).
Such a plant produces 3.2 bbl of gasoline per day and a ton of methanol, 0.42 bbl of LPG/day t, and 0.097 bbl/day t of fuel gas.
5.5 Problems
P5.1. Coal is processed using air and steam to produce a syngas with an H2-to-N2 ratio of 3. The coal has 10% ash and 90% C. 1% of the carbon is lost with the ash. In the water gas cycle, 80% of the steam reacts. In the gas generator cycle, 65% of the carbon produces CO2 and the rest CO. In the water gas cycle, the carbon generates CO. The air used is at 25°C and 760 mmHg with 55% relative humidity.
Determine:
a. Relative amount of air and steam.
b. Heating power of the gas produced per ton of coal.
c. Amount of air required per ton of coal.
P5.2. Syngas with an H2-to-CO ratio of 2 is to be produced from C2H2. Steam reforming of the hydrocarbon, fed at 900K, is carried out using 50% excess of water with respect to the stoichiometric one. In the process, 100% conversion of the hydrocarbon is obtained. A fraction of the gas product is sent to a WGSR, maintaining the temperature from the previous stage, to increase the yield to hydrogen. Assume isothermal operation of the WGSR. See Fig. P5.2 for the scheme of the flowsheet. Determine the temperature and composition of the gases leaving the reformer, which requires 75,000 kcal/kmol of hydrocarbon and the fraction of the product gas that is fed to the WGSR.
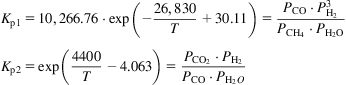
P5.3. The feedstock for the production of ammonia contains 0.5 mol of Ar per 100 mol of N2–H2 mixture. After mixing it with the recycle, the stream is fed to the converter. The syngas has stoichiometric proportions of nitrogen and hydrogen (N2+3H2). The gas also contains 5 moles of Ar per 100 moles of syngas. The reactor is operated at 200 atm and 740K isothermally where the equilibrium shown below takes place:
The equilibrium constant (Kp) can be computed as a function of the temperature using the following equation:

The ammonia produced can be completely recovered by condensation. The unreacted gas is recycled. A fraction of the recycle stream is purged. Determine the flow of each stream (1, 2, 3, and 4) in Fig. P5.3 per 100 moles of syngas fed to the system.
P5.4. In a coal-based synthesis gas facility, 45% of the fuel is consumed in the generator gas cycle while the rest follows the water gas cycle. The coal consists of 90% C and 10% ash. Assume that the losses of C with the ashes are negligible.
The generator gas cycle uses atmospheric air (Ts=23°C, φ=0.62, and PT=720 mmHg), and the reaction takes place at 973K and 1 atm. Assume that no water gas equilibrium with steam is reached, just reaction. The equilibrium constant as a function of the temperature can be computed using the following equation:
The water gas cycle uses steam so that only 40% of it reacts. The equilibrium for the WGS among the resulting gases establishes at 800K. The equilibrium constant can be determined using the following equation:
– Relative amounts of generator gas and water gas produced.
– Heating value of both gases.
– Fraction of the initial heating power in C remaining in both gases.
P5.5. The ammonia converter is fed with a stoichiometric mixture of nitrogen and hydrogen. The mixture carries 5 moles of Ar per 100 moles of synthesis gas. The reactor operates at 230 atm and 800K isothermally.
The value for the equilibrium constant as a function of the temperature can be computed using the following equation:

The ammonia is condensed in a heat exchanger at the reaction pressure. Determine the final temperature to recover 96% of the ammonia produced. Assume humid air ideal behavior in the ammonia condensation. The ammonia vapor pressure is seen below (Fig. P5.5):
log10(Pv)=A−(B/(T+C))
Pv=vapor pressure (bar)
T=temperature (K)
| Temperature (K) | A | B | C |
| 164.0 – 239.6 | 3.18757 | 506.713 | −80.78 |
| 239.6 – 371.5 | 4.86886 | 1113.928 | −10.409 |

P5.6. In a thermal plant, coal is burned with dry and stoichiometric air. After sulfur removal, the CO2 produced in the combustion is expected to be further used. The CO2 stream is fed to a coal bed to recover part of its synthetic potential. The aim is to achieve 99% CO2 conversion. Determine the pressure and temperature of operation, as well as the coal consumption during this operation, not accounting for the thermal plant operation, per kmol of dry air used to burn the original coal. The equilibrium constant for the operation of the coal bed is given by the following equation:
P5.7. In a coal-based synthetic gas production facility, 40% of the fuel follows the generator gas cycle and the rest, 60%, is used in the water gas cycle. The coal consists of 90% carbon and 10% ash. Assume negligible carbon losses in the ash. In the generator gas cycle, half of the carbon produces CO and the other half produces CO2. The oxygen is completely consumed. Dry air is used. The water gas cycle operates at 1000K and 1.09 atm. Assume that the carbon is completely consumed and the steam is fed in 50% excess.
Determine:
– Composition of the gas generator and water gas.
– Operating temperature of the gas generator cycle.
– Heating values for the two gases per kg of carbon fed.
– The H2-to-CO ratio of the mixed gases.
P5.8. Syngas with the appropriate H2-to-CO ratio for ethanol production is produced. An electrolytic cell operating at 80°C is used for the production of hydrogen. The current yield of the cell is 55%. The hydrogen is at 80°C. On the other hand, a flowrate of 36 kmol/h of flue gas from a thermal plant is available. The composition, once cleaned, consists of 66% molar CO2, and the rest is CO. Determine the consumption of water in the electrolysis (kg/h) and the energy required to be applied to the electrolytic cell (kW).

P5.9. A purified CO2 stream from a thermal plant is to be reused for the production of hydrogen from CH4. The methane and the CO2 are fed at 25°C, while the gases exit at 600°C. Compute the amount of methane per mol of hydrogen produced considering an adiabatic reforming process and assuming 100% methane conversion. Determine the fraction of methane used to provide the required energy for the reaction.
P5.10. Methane is autoreformed adiabatically with oxygen and steam. The methane and the oxygen are fed at 25°C. The steam is fed at 233°C. The exit gas contains CO, CO2, and hydrogen. The temperature is 600°C and the ratio of H2O vap/O2 fed is equal to 2. Determine the amount of water and oxygen required to perform the autorefoming of methane and the composition of the product gas.
P5.11. Methanol is produced using hydrogen and CO. The feed gas comes from the partial oxidation of hydrocarbons. The molar composition is given in dry basis in Table P5.11.
1. This gas is to be processed to obtain a hydrogen-to-CO ratio of 2. A fraction of the feed is bypassed. The rest is subjected to WGS adding steam. The stream contains 1.6% moles of CO. Determine the fraction of the gas being bypassed.
2. Next, CO2 is removed to obtain the syngas. Compute the moles of CO2 removed from the raw syngas per 100 moles of initial gas.
3. Finally, in a third stage, the syngas produces methanol. Assume 90% conversion; the methanol is recovered. Determine the composition of the unreacted gases and the volume to produce 100 kmol of methanol.
P5.12. FT diesel is produced using hydrogen and CO. The feed gas comes from the partial oxidation of hydrocarbons. The molar composition is given in dry basis in Table P5.12.
1. This gas is to be processed to obtain a hydrogen-to-CO ratio of 2. A fraction of the feed is bypassed. The rest is subjected to WGS adding steam. The stream contains 1.6% moles of CO2. Determine the fraction of the gas being bypassed.
2. Next, CO2 and H2S are removed, as well as the water. Compute the moles of CO2 removed from the raw syngas per 100 moles of initial gas.
3. Finally, in a third stage, the syngas produces FT diesel. Determine the operating temperature to maximize the diesel fraction, assuming that the product distribution can be predicted using the Anderson–Schulz–Flory model. Compute the moles of liquid fuels produced assuming that only the -CH2- synthesis reaction occurs with 70% conversion.
P5.13. Syngas in stoichiometric proportions (1:3 N2:H2) is fed to the system. See Fig. P5.3 for the scheme of the synthesis loop. It also contains Ar, 0.2 moles per 100 moles of mixture (N2+3H2). Assuming the following, determine the purge of the system:
1. The reactor conversion is 25%.
2. Only 75% of the ammonia produced is recovered.
3. The converter can only handle Ar at 2.43 moles per 100 moles of syngas mixture.
P5.14. The expected increase in hydrogen demand results in the development of propane steam reforming. In the furnace, two main reactions take place, the steam reforming and the WGS:
The reforming reaction takes place over Ni catalyst in the tubes of the furnace. The feed consists of a mixture of steam and propane with a molar ratio of 5:1 at 125°C. The products leave the furnace at 800°C. Assume complete propane conversion.
The reaction is endothermic, and thus energy must be provided. A hot flue gas with a composition of 22% CO2 and the rest nitrogen is fed at 1400°C and 1 atm, and exits at 900°C. The flue gas is further used to produce steam by cooling it down to 250°C. Water is fed at 25°C and the stream is produced at 125°C and 1 atm. Determine the molar composition of the gas product and the flue gas required to produce the steam required by the reforming stage.
P5.15. Methanol is produced using syngas, a mixture (CO+2 H2) containing CO2 as an inert impurity. Originally there were 0.25 mol per 100 mol of syngas. The reactor operates at 25 bar and 232°C. Assume that 90% of the methanol can be recovered condensing it. No water is produced since Co-based catalysts are used. The reactor can handle up to 5 moles of CO2 per 100 moles of syngas. Fig. P5.15 shows the scheme of the synthesis loop. Determine:
1. The reactor conversion assuming that the equilibrium constant of the process taking place in the reactor can be computed using the following equation:
P5.16. Stream number 2 in the flowsheet above is separated using a flash, the system between 2 and 4 in the figure. Compute the composition of the gas and liquid phases if the stream is cooled down to 27°C, maintaining the reactor pressure.
P5.17. Stream number 2 in the flowsheet above is separated using a flash, the system between 2 and 4 in the figure. Compute the cooling temperature to recover 98% of the methanol produced. Assume that the reactor pressure is maintained in the flash.
P5.18. A methanation reaction takes place in a multibed, Co-based catalytic reactor where the WGS does not take place. The reactants are fed with a hydrogen-to-CO ratio of 6, and the conversion per pass is 75% of the equilibrium conversion. Determine the temperature of the feed to the first bed to reach 25% conversion. Data for the equilibrium and the energy balance:

Hint: See Example 7.7.
P5.19. Ammonia synthesis is performed in a multibed catalytic reactor; see Fig. P5.19. Each bed operates adiabatically and the reactor employs indirect cooling. Compute the conversion reached after two catalytic beds if only 50% of the equilibrium conversion is reached. The feed to the first bed is 400°C, and after each bed the feed is cooled to 400°C. Total pressure is 300 atm. Data for the equilibrium and the energy balance:


Hint: See Example 7.7.
P5.20. A methanation reaction takes place in a multibed Co-based catalytic reactor where the WGS does not take place. The reactants are fed at 500°C with a hydrogen-to-CO ratio of 7. After each bed, the products are cooled to the initial temperature. The pressure of operation is 500 kPa. Compute the number of beds so that the final conversion is 75%.
Data for the equilibrium and the energy balance:

Hint: See Example 7.7.
P5.21. Ammonia synthesis is performed in a two-bed catalytic reactor; see Fig. P5.21. Each bed operates adiabatically and the reactor employs direct cooling. The syngas is at 20°C. The heated syngas is fed to the first bed at 400°C. Total pressure is 300 atm. Determine the fraction of the syngas that is directly fed to the second bed so that the initial temperature of all beds is 400°C and there is total conversion.
Data for the equilibrium and the energy balance:


Hint: See Example 7.7.
P5.22. An ammonia production plant operates an absorption column with 15 trays. It processes a gas stream of 15 kmol/s with 25% ammonia in countercurrent flow with water. The flow of water is 20 kmol/s. The column operates at 10 atm and 25°C to recover 98% of the ammonia. Calculate the tray efficiency and the excess of liquid flow with respect to the minimum. Assume that Raoult’s Law holds.
P5.23. An ammonia production facility uses an absorption tower with 10 trays with an efficiency of 80%. It processes a gas stream of 15 kmol/s, 25% ammonia with a water stream in countercurrent at 10 atm and 25°C to recover 98% of the ammonia. Determine the water flow rate and its excess with respect to the minimum. Assume that Raoult’s Law holds.
P5.24. Captured CO2 with nitrogen is to be used as a carbon source for the production of methanol (as in the figure). The reaction over Co catalysts is as follows:

The feed to the system is in stoichiometric proportions containing 0.5% nitrogen. The reactor operates with syngas in stoichiometric proportions at 25 atm. It can handle up to 3 moles of nitrogen per 100 mol of syngas (CO2+3H2). A conversion of 20% per pass is expected. Assuming that 90% of the methanol and all the water produced are recovered, determine the operating temperature at the reactor and the purge fraction. Fig. P5.24 shows the synthesis loop.
P5.25. In a methanol production plant the distillation column has 9 trays with an efficiency of 75% certified by the vendor. We process a mixture of 45% methanol and the rest water. The distillate has a composition of 97% methanol, and the residue 3% methanol. Calculate the reflux ratio (L/D) if the feed is saturated liquid and the mixture behavior is assumed to be ideal:
P5.26. In a methanol production plant the distillation column has 12 trays, but we do not trust the efficiency provided by the vendor. We process a mixture of 45% methanol and the rest water. The distillate has a composition of 97% methanol, and the residue 3% methanol. The column is operated with a reflux ratio (L/D) of 1.75 and the feed is saturated liquid. Determine the efficiency of the trays assuming ideal behavior of the mixture.
P5.27. A stream of 40 kmol/s (34.5 bar and 298K) of syngas with 10% CO2 is processed in a 12-tray absorption column to remove 99.5% of it before further stages. The equilibrium data for the system CO2–amine is given in Table P5.27. The L/G ratio is 1.5, the minimum one. Determine the efficiency of the trays.
P5.28. Repeat Example 5.9 using any commercial process simulator and compare the results; T reactor (300°C).
P5.29. Simulate the methanol and ammonia synthesis loops using process simulators. Evaluate the effect of using CO2 as a carbon source instead of CO.
P5.30. A novel process for the production of hydrogen from propane is being evaluated. In the fired furnace reformer, two main reactions take place:
Propane steam reforming occurs in a reactor whose pipes are packed with nickel catalyst. The feed to the reactor consists of a mixture, steam–propane with a molar ratio of 6:1 at 125°C. The products of the reforming stage leave the reactor at 800°C. The excess of steam assures the complete consumption of propane. The syngas has a molar ratio of CO-to-CO2 of 5. Determine the fraction of the initial propane needed to operate the furnace adiabatically, and the syngas molar composition.
P5.31. Select between the use of a flash or an absorption column to recover 80% of the ammonia in a stream consisting of 211, 70.4, 9.12, and 62.1 kmol/s of H2, N2, Ar, and NH3, respectively. The initial temperature and pressure are 400°C and 100 bar. For the absorption column, it operates at 100°C and 100 bar with a liquid flow twice the minimum and an efficiency of 57% for the stages.
Cost of cooling 1€/kW (cp(kJ/kg K): H2=14; N2=1; Ar=0.52; NH3=2.2; λ=1369 kJ/kg). Recovering ammonia from liquid, 1500€/(kg/s). Cost of vessels, 25,000€/stage. The flash is 1 stage.
P5.32. Using a process simulator (ie, CHEMCAD), compute the conversion of a multibed reactor with direct cooling; see Fig. 5.19 for reference. The feed to the system is 1 kmol/s of N2, 3 kmol/s of H2, 0.2 kmol/s of Ar at 30 MPa and 373K. The reactor consists of three beds, and the first is fed at 673K. The feed to each of the following beds should be around 673K. Determine the feed rates of unconverted syngas to each of the beds assuming that they are at 293K, 30 MPa, and the same composition as the initial feed.


